Setting Properties for Columns
When you build an analysis, you can edit properties for columns to control factors such as their appearance, data display, and layout. For example, you can specify that values in the Revenue column are displayed with two decimal places and a dollar sign.
To apply formatting to a column
-
Open the analysis for editing.
-
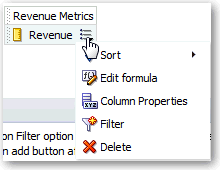
In the Selected Columns pane, click Options beside the column name.

Description of the illustration analysis17.gif
-
To format the headings and values of the column, click the Column Format tab and select the appropriate options. The following table describes some of these formatting options.
Field Description Hide Click to hide the column in the analysis. You can hide columns whose appearance adds no value to the analysis. Hidden columns do not affect the aggregation of the values. For example, you want to build an analysis that includes only customers located in Illinois. To build the proper filter, you must include the column called Customers.State. Because you added this column for filtering purposes only and its appearance adds no value to the analysis, you can hide this column. Custom Headings Click to enable you to enter your own values in the Folder Heading and Column Heading fields. You can reference variables and format the heading values. These values identify the column in the analysis. For more information, see Advanced Techniques: Referencing Stored Values in Variables.
Value Suppression Use the buttons in this area to affect the display of repeating data values for the column. When the same value occurs in multiple consecutive rows, you can specify to show that value only once. This specification can make it easier to see the relationships in the data. For example, suppose that one column lists customer names and another column lists the regions that those customers are in. The region data could be repeated for each customer row. If you specify to not display repeated values, then the distinctions in that data can be more apparent.
-
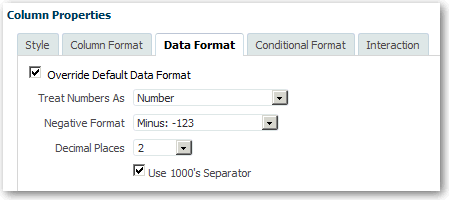
To override the default display of data for the column, click the Data Format tab and select the appropriate options. Override the default only if you want the value to differ for this column.
The options that display on this tab depend upon the data type (text, numeric, or date) of the column. For example, if the data type is numeric, then you can add the thousands separator to the values.

Description of the illustration analysis37.gif
For information on formatting text data, see Formatting Text Data.
-
To apply formatting to the column, see Formatting Columns.
-
To specify how to interact with values in the column, see Adding Interactivity to Analyses.
-
(Optional) If you have the appropriate privileges and want to save the formatting for this column as the default formatting, then click one of the Save as System-wide Default options.
Option Purpose Restore column property defaults Returns the property values for the column back to the last saved default values. Save as the system-wide default for this column Save the properties as the systemwide default for this column in all analyses in which it is used. Save as the system-wide default for this data type Save the properties as the systemwide default for all columns that have the same data type as this column. You cannot save and restore the settings on the Conditional Format tab.
A value such as Default (System) for an option indicates that formatting can change. The column acquires whatever is currently set as the default value for the system. The ability to set a system-wide default can provide consistency and save time within your organization. For example, suppose that your organization had decided to use Arial as the font family for all text columns in all analyses. Suppose that a decision is later made to switch to Times New Roman for all text columns. You can simply save Times New Roman as the system-wide default for text columns. All existing analyses that contain text columns in which the font family is specified as Default (Arial) are updated automatically.
Specify a specific value, such as Arial, only when you are certain that you want that value rather than the system default value. Best practice is to change the default value rather than overriding the default with specific values.
-
Click OK.
Formatting Text Data
You use the Column Properties: Data Format tab to override the default display of data for the column. The options on the tab differ depending on the data type. For the text data type, the tab includes the Treat Text As and Custom Text Format fields. From the Treat Text As list, you can select to display the values as plain text, HTML, or a link. Based on your choice, the "Custom Text Format" field displays the applicable HTML string used to display the data.
If you select Custom Text Format, then you can write HTML calls that provide formatting. You can also enter any valid HTML string, including JavaScript, VBScript, and so on. The first character must be the at sign (@). This character enables devices that are incapable of displaying the custom format to display the data in the appropriate default format.
For example, the following sample HTML code sets the width and height of a column in tables and pivot tables. In the example, the text html enclosed in brackets ([html]) means to use HTML The at sign character represents the dynamic contents of the column.
@[html]<span style="width:200px; height:50px>@</span>