Adding Interactivity to Analyses
In analyses, views that display data are not static. You can make views dynamic by specifying the interactions that are available to those who left-click in a view or right-click to display a popup menu. The default primary interaction is a left-click that drills down to detail in the data, if data is hierarchical.
Other interactions are available as options on a right-click popup menu. These interactions can include displaying a web page and linking views such that one view drives changes to data in one or more other views. You can also specify that no interactions are available.
For example, you can specify the default primary interaction (the left-click action) for the Region column as Drill. This enables you to drill down to information by state by left-clicking in the column.
To add interactivity to an analysis:
-
Open the analysis for editing.
-
In the Selected Columns pane, click Options beside the column name.
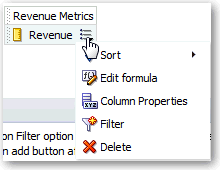
Description of the illustration analysis17.gif
-
Click the Interaction tab in the Column Properties dialog.
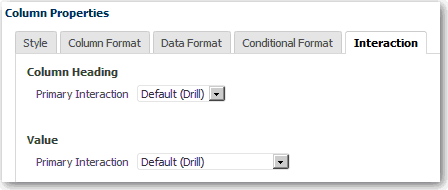
Description of the illustration analysis20.gif
The default primary interaction for column headings and values is Drill, which enables users to drill down to more detailed information.
-
(Optional) Select an interaction from the drop-down menu in the Column Heading section.
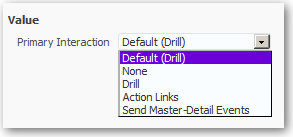
Description of the illustration analysis21.gif
-
(Optional) Select an interaction from the drop-down menu in the Values section.
The following table shows available primary interaction choices:
Interaction Action More information None Disables all interactions on the column. None Drill (Default) Displays a deeper level of detailed content if the data is hierarchical. If no hierarchy is configured for the column, then drilling is not enabled. Drilling in Results Action Links Opens a web page or navigates to supporting BI content. Adding Actions to Analyses Send Master-Detail Events Links views such that one view drives changes in one or more other views. Linking Views in Master-Detail Relationships -
Click OK.
You can specify the interactions that are available at runtime when you right-click on a dashboard column or data cell. The following figure shows an example of interactions available when you right-click on a product name in the Products column. This column is in a Top Product Performers Based on Revenue table:
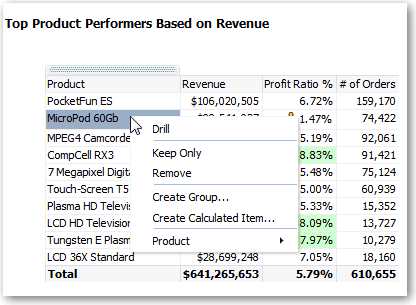
Description of the illustration analysis76.gif
Of the selections shown, you can set Drill, Create Group, and Create Calculated Item.
To specify the interactions that are available when you right-click in a pivot table, table, treemap, or trellis view:
-
Open the analysis for editing.
-
Click on either the Analysis editor: Criteria tab or Analysis editor: Results tab.
-
Click Edit Analysis Properties on the toolbar.
-
Click the Interactions tab of the Analysis Properties dialog.
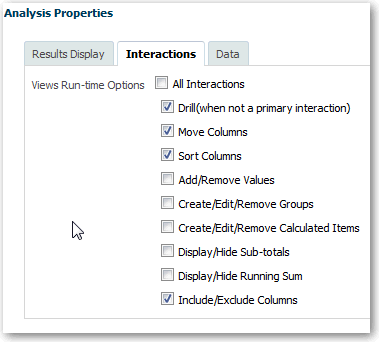
Description of the illustration analysis23.gif
-
Select the appropriate interactions from the list.
-
Click OK.