C Data Presenter Examples
This appendix describes a variety of business scenarios that require creation of data visualization, and explains how to use WebCenter Portal's Data Presenter to meet those requirements.
This appendix includes the following topics:
-
Section C.2, "Displaying Employee Data from SQL Data Control"
-
Section C.3, "Presenting Data from the WebCenter Portal MDS Repository"
-
Section C.4, "Presenting Data from a WebCenter Portal Web Service Data Source"
-
Section C.5, "Building and Using a Custom Task Flow Style with Predefined Columns"
-
Section C.6, "Building and Using a Custom Task Flow Style with Date Fields"
-
Section C.7, "Presenting Data in a Master-Detail Relationship that Contains a Google Maps Task Flow"
Permissions:
To perform the tasks in this appendix on shared Data Presenter assets, you need the application-level permissionCreate, Edit, and Delete for each of the different Data Presenter assets: Data Controls, Task Flows, and Task Flow Styles. Users with the Application Specialist role automatically have these permissions. For more information about application-level permissions, see the "About Application Roles and Permissions" section in Administering Oracle WebCenter Portal.
To perform the tasks in this appendix on portal-level Data Presenter assets, you need the portal-level permission Create, Edit, and Delete Assets (standard permissions) or Create, Edit, and Delete (advanced permissions) for each of the different Data Presenter assets. For more information about portal-level permissions, see Section 29.1, "About Roles and Permissions for a Portal."
Note:
This appendix describes only the high level steps to perform a task. For the detailed steps, refer to Chapter 27, "Working with Data Presenter."Sample applications created for some of the examples in this appendix are available on Oracle Technology Network (OTN). The following page on OTN provides links to Data Presenter-specific samples and other sample applications that illustrate the different WebCenter Portal capabilities:
http://www.oracle.com/technetwork/middleware/webcenter/ps3-samples-176806.html
A readme file available with each sample describes what the application illustrates and provides guidance for extending or customizing the application for real life use cases.
C.1 Presenting Data from Analytics
Analytics displays metrics, such as community traffic, portlet traffic, searched keywords, response times, and usage behavior, for the entire WebCenter Portal application. This example describes how to create a task flow with data retrieved from the analytics data source. It includes the following topics:
-
Section C.1.2, "Using a Parameterized Task Flow to Display a Graph of Page Hits in a Portal"
-
Section C.1.3, "Creating a Graph to View Portal Site Traffic Data"
-
Section C.1.4, "Presenting Data with Two Task Flows in a Master-Detail Relationship"
If your system administrator has configured WebCenter Portal tools and services, WebCenter Portal provides an analytics connection, ActivitiesDS, out-of-the-box. You can use this connection to create a SQL data control and consume that data control as a graph to display statistics for the WebCenter Portal application.
Your system administrator configures analytics, as described in the "Managing Analytics" chapter in Administering Oracle WebCenter Portal.
C.1.1 Creating a Graph to Display Page Hits
To create a graph that displays statistics for pages in your application:
-
Create a SQL data control,
PageStats, using theActivitiesDSconnection. Specify the following SQL query:SELECT space.name_ spaceName, page.name_ pageName, space.id, page.id, count(1), fact.page_, page.resourceid_ FROM asfact_wc_pagevie_0 fact , asdim_wc_groupsp_0 space , asdim_wc_pages_0 page, asdim_wc_applica_0 app WHERE space.id = fact.groupspace_ and page.id = fact.page_ and app.id = fact.application_ and fact.occurred between to_date(:startdate, :dateformat) and to_date(:enddate, :dateformat) and app.name_ = :appname and page.personal_ = :ispersonal and space.name_ is not null and page.name_ is not null and space.id is not null and page.id is not null and fact.page_ is not null and page.resourceid_ is not null GROUP BY space.name_, page.name_, space.id, page.id, fact.page_, page.resourceid_ ORDER BY count(1) desc
-
Set the bind variables as follows:
-
startdate -
01/01/2013 -
dateformat -
MM/DD/YYYY -
enddate -
01/01/2014 -
appname -
webcenter -
ispersonal -
1
For the detailed steps, see Section 27.2.2.1, "Creating a SQL Data Control."
-
-
Expose the data control in the resource catalog by selecting the check box in the Available column.
For more information, see Section 20.5.3, "Showing and Hiding Assets."
-
Create a task flow,
Page Hits, based on the Blank task flow style.For the detailed steps, see Section 27.3.3, "Creating a Task Flow to Visualize Data."
-
Edit the task flow and from the inline resource catalog, add the PageStats data control accessor as a graph with the following options:
-
Select the Bar graph type.
-
On the Placement page, select X Axis for the SPACENAME and PAGENAME data columns and Bars for COUNT_1_.
-
Accept the default values on all other pages of the wizard.
For the detailed steps, see Section 27.3.5.4, "Presenting Data as a Graph."
The resulting graph is shown in Figure C-1.
Figure C-1 Bar Graph Displaying Page Hits
Description of ''Figure C-1 Bar Graph Displaying Page Hits''
-
C.1.2 Using a Parameterized Task Flow to Display a Graph of Page Hits in a Portal
In the previous example, you saw how to view page hits in your WebCenter Portal application. This example describes a similar scenario, but with the ability to display page hits for a specific portal only. In this case, a parameter form is included with the visualization of the data control. The parameter form enables users to specify a portal name and display statistics for that portal in the graph.
To create the data control:
-
Create a SQL data control,
PageHits, using theActivitiesDSconnection. Specify the following SQL querySELECT * FROM (SELECT page.name_ pageName, space.name_ spaceName, COUNT(1) hits FROM asdim_users u, asdim_wc_pages_0 page, asdim_wc_applica_0 app, asdim_wc_groupsp_0 space, asfact_wc_pagevie_0 fact WHERE fact.page_ = page.id AND fact.userid = u.id AND fact.application_ = app.id AND fact.groupspace_ = space.id AND fact.occurred BETWEEN(SYSDATE-6) AND (SYSDATE+1) AND app.name_ = 'webcenter' AND u.userid <> 'anonymous' AND upper(space.name_) LIKE upper(:portalname) AND space.name_ IS NOT NULL AND page.name_ IS NOT NULL AND space.id IS NOT NULL AND page.id IS NOT NULL AND fact.page_ IS NOT NULL AND page.resourceid_ IS NOT NULL GROUP BY page.name_, space.name_ ORDER BY hits DESC) WHERE rownum <= 5 ORDER BY rownum -
Set the bind variables as follows:
-
portalname -
Home Portal
For the detailed steps, see Section 27.2.2.1, "Creating a SQL Data Control."
-
-
Test the query and view the data retrieved from the data source, as shown in Figure C-2.
Figure C-2 SQL Data Control Query Test Result
Description of ''Figure C-2 SQL Data Control Query Test Result''
-
Expose the data control in the resource catalog by selecting the check box in the Available column.
For more information, see Section 20.5.3, "Showing and Hiding Assets."
-
Create a task flow,
Top Five Page Hits for a Portal, based on the Blank task flow style.For the detailed steps, see Section 27.3.3, "Creating a Task Flow to Visualize Data."
-
Edit the task flow and from the inline resource catalog, add the PageHits data control accessor as a graph with the following options:
-
Select the Bar graph type.
-
On the Placement page, select X Axis for the PAGENAME and SPACENAME data columns and Bars for HITS.
-
On the Visualization Parameter page, select the check box next to the portalname parameter.
-
Accept the default values on all other pages of the wizard.
For the detailed steps, see Section 27.3.5.4, "Presenting Data as a Graph."
The graph is displayed showing data for the Home portal (the portal chosen as the default for the
portalnamebind variable when the data control was created).
-
-
Specify a different portal name in the portalname field and click Refresh. The graph displays data specific to that portal (Figure C-3).
Figure C-3 Bar Graph Displaying Page Hits for a Given Portal
Description of ''Figure C-3 Bar Graph Displaying Page Hits for a Given Portal''
C.1.3 Creating a Graph to View Portal Site Traffic Data
This example explains how to retrieve the site traffic data from analytics and display it as a pie graph.
To create a graph to view portal site traffic data:
-
Create a SQL data control,
PortalStats, using theActivitiesDSconnection. Specify the following SQL query:SELECT 'Portals' Name, count(1) Hits FROM asfact_wc_groupsp_0 fact , asdim_wc_groupsp_0 space , asdim_wc_applica_0 app WHERE space.id = fact.groupspace_ and app.id = fact.application_ and fact.occurred between to_date(:startdate, :dateformat) and to_date(:enddate, :dateformat) and app.name_ = :appname and space.personal_ = :ispersonal UNION ALL SELECT 'Pages' Name, count(1) Hits FROM asfact_wc_pagevie_0 fact , asdim_wc_pages_0 page , asdim_wc_applica_0 app WHERE page.id = fact.page_ and app.id = fact.application_ and fact.occurred between to_date(:startdate, :dateformat) and to_date(:enddate, :dateformat) and app.name_ = :appname and page.personal_ = :ispersonal UNION ALL SELECT 'Portlets' Name, count(1) Hits FROM asfact_wc_portlet_0 fact , asdim_wc_applica_0 app WHERE app.id = fact.application_ and fact.occurred between to_date(:startdate, :dateformat) and to_date(:enddate, :dateformat) and app.name_ = :appname UNION ALL SELECT 'Logins' Name, count(1) Hits FROM asfact_wc_logins_0 fact , asdim_wc_applica_0 app WHERE app.id = fact.application_ and fact.occurred between to_date(:startdate, :dateformat) and to_date(:enddate, :dateformat) and app.name_ = :appname UNION ALL SELECT 'Searches' Name, count(1) Hits FROM asfact_wc_searche_0 fact , asdim_wc_applica_0 app WHERE app.id = fact.application_ and fact.occurred between to_date(:startdate, :dateformat) and to_date(:enddate, :dateformat) and app.name_ = :appname UNION ALL SELECT 'Wikis' Name, count(1) Hits FROM asfact_wc_doclib__0 fact , asdim_wc_documen_0 doc , asdim_wc_applica_0 app WHERE app.id = fact.application_ and fact.document_ = doc.id and fact.occurred between to_date(:startdate, :dateformat) and to_date(:enddate, :dateformat) and app.name_ = :appname and doc.objecttype_ like '%WIKI%' UNION ALL SELECT 'Blogs' Name, count(1) Hits FROM asfact_wc_doclib__0 fact , asdim_wc_documen_0 doc , asdim_wc_applica_0 app WHERE app.id = fact.application_ and fact.document_ = doc.id and fact.occurred between to_date(:startdate, :dateformat) and to_date(:enddate, :dateformat) and app.name_ = :appname and doc.objecttype_ like '%BLOG%' UNION ALL SELECT 'Documents' Name, count(1) Hits FROM asfact_wc_doclib__0 fact , asdim_wc_documen_0 doc , asdim_wc_applica_0 app WHERE app.id = fact.application_ and fact.document_ = doc.id and fact.occurred between to_date(:startdate, :dateformat) and to_date(:enddate, :dateformat) and app.name_ = :appname and doc.objecttype_ like '%DOCUMENT%' UNION ALL SELECT 'Discussions' Name, count(1) Hits FROM asfact_wc_discuss_1 fact , asdim_wc_applica_0 app WHERE app.id = fact.application_ and fact.occurred between to_date(:startdate, :dateformat) and to_date(:enddate, :dateformat) and app.name_ = :appname
-
Set the bind variables as follows:
-
startdate -
01/01/2013 -
dateformat -
MM/DD/YYYY -
enddate -
01/01/2014 -
appname -
webcenter -
ispersonal -
1
For the detailed steps, see Section 27.2.2.1, "Creating a SQL Data Control."
-
-
Expose the data control in the resource catalog by selecting the check box in the Available column.
For more information, see Section 20.5.3, "Showing and Hiding Assets."
-
Create a task flow,
Portal Traffic, based on the Blank task flow style.For the detailed steps, see Section 27.3.3, "Creating a Task Flow to Visualize Data."
-
Edit the task flow and from the inline resource catalog, add the PortalStats data control accessor as a graph with the following options:
-
Select the Pie graph type.
-
On the Placement page, select Slices for the NAME data column and Pie for HITS.
-
Accept the default values on all other pages of the wizard.
For the detailed steps, see Section 27.3.5.4, "Presenting Data as a Graph."
The graph is displayed as shown in Figure C-4.
Figure C-4 Graph Displaying Portal Traffic Statistics
Description of ''Figure C-4 Graph Displaying Portal Traffic Statistics''
-
C.1.4 Presenting Data with Two Task Flows in a Master-Detail Relationship
This example describes how to wire two task flows in a master-detail relationship so that a selection in one task flow results in an action on the second one.
This section includes the following topics:
-
Section C.1.4.1, "Creating the Master Data Control and Task Flow"
-
Section C.1.4.2, "Creating the Details Data Control and Task Flow"
After performing the above configurations, if you click a user name in the master table, the details are displayed in a popup window.
C.1.4.1 Creating the Master Data Control and Task Flow
The master task flow displays a table with the top five page views for a given portal during the last seven days.
To create the task flow:
-
Create a SQL data control,
TopFiveDocViewsForSelectedPortal, using theActivitiesDSconnection. Specify the following SQL query:select * from (select u.id id , u.userid userid, count(fact.userid) pageviews from asdim_users u , asfact_wc_pagevie_0 fact,asdim_wc_applica_0 app where fact.userid=u.id and u.userid <> 'anonymous' and fact.application_ = app.id and app.name_ = 'webcenter' and fact.occurred BETWEEN (SYSDATE-7) and ( SYSDATE+1) group by u.id,u.userid order by pageviews desc ) where rownum<11
For the detailed steps, see Section 27.2.2.1, "Creating a SQL Data Control."
This query returns the top five page hits for a given portal for the last seven days.
-
Expose the data control in the resource catalog by selecting the check box in the Available column.
For more information, see Section 20.5.3, "Showing and Hiding Assets."
-
Create a task flow,
Top 10 Visitor Page Hits, based on the Blank task flow style.For the detailed steps, see Section 27.3.3, "Creating a Task Flow to Visualize Data."
-
Edit the task flow and from the inline resource catalog, add the TopFiveDocViewsForSelectedPortal data control accessor as a table with the following options:
-
Select the Read-only Table table type.
-
On the Columns page, select the USERID data column. From the Display As drop-down list, select Hyperlink, and in the URL field, enter
http://www.oracle.com. Select the Open in New Window check box (Figure C-5). -
Accept the default values on all other pages of the wizard.
Figure C-5 Display Columns as Hyperlinks
Description of ''Figure C-5 Display Columns as Hyperlinks''
The table displays a user-wise listing of the top page hits. The USERID column displays user names as hyperlinks, as shown in Figure C-6.
Figure C-6 Master Task Flow Displaying Top Page Hits
Description of ''Figure C-6 Master Task Flow Displaying Top Page Hits''
-
-
Save and close the task flow.
-
Expose the task flow in the resource catalog by selecting the check box in the Available column.
For more information, see Section 20.5.3, "Showing and Hiding Assets."
C.1.4.2 Creating the Details Data Control and Task Flow
You have seen how to create a master task flow that displays the top page hits in a table, in which the user names are hyperlinked. The next step is to create a details task flow that is displayed on clicking a user name in the master task flow. This example describes how to create a details task flow that displays a graph of all page hits for a given user.
To create the details data control and task flow:
-
Create a SQL data control,
PageHitsForSelectedUser, using theActivitiesDSconnection. Specify the following SQL query:SELECT page.name_ pageName, space.name_ spaceName, COUNT(1) hits FROM asdim_users u, asdim_wc_pages_0 page, asdim_wc_applica_0 app, asdim_wc_groupsp_0 space, asfact_wc_pagevie_0 fact WHERE fact.page_ = page.id AND fact.userid = u.id AND u.userid=(:userid) AND fact.application_ = app.id AND fact.groupspace_ = space.id AND fact.occurred BETWEEN (SYSDATE-7) and SYSDATE and app.name_ = 'webcenter' AND u.userid <> 'anonymous' AND space.name_ IS NOT NULL AND page.name_ IS NOT NULL AND space.id IS NOT NULL AND page.id IS NOT NULL AND fact.page_ IS NOT NULL AND page.resourceid_ IS NOT NULL GROUP BY page.name_, space.name_ -
Set the bind variables as follows:
-
userid -
weblogic
For the detailed steps, see Section 27.2.2.1, "Creating a SQL Data Control."
-
-
Expose the data control in the resource catalog by selecting the check box in the Available column.
For more information, see Section 20.5.3, "Showing and Hiding Assets."
-
Create a task flow,
Page Hits for Selected User, based on the Blank task flow style.For the detailed steps, see Section 27.3.3, "Creating a Task Flow to Visualize Data."
-
Edit the task flow and from the inline resource catalog, add the PageHitsForSelectedUser data control accessor as a graph with the following options:
-
Select the Bar graph type.
-
On the Placement page, select X Axis for the SPACENAME and PAGENAME data columns and Bars for HITS.
-
On the Visualization Parameter page, enter the following Default Value for the userid parameter:
#{pageFlowScope.userid} -
Accept the default values on all other pages of the wizard.
Note that no data is displayed in the graph because the value of the
useridbind variable has not yet been set to a specific value. -
-
Create a task flow parameter,
userid, and from the Storage drop-down list, select pageFlowScope to set the value to#{pageFlowScope.userid}, as shown in Figure C-7.Figure C-7 Parameter Defined on the Details Task Flow
Description of ''Figure C-7 Parameter Defined on the Details Task Flow''
-
Save and close the task flow.
-
Expose the task flow in the resource catalog by selecting the check box in the Available column.
For more information, see Section 20.5.3, "Showing and Hiding Assets."
C.1.4.3 Wiring the Master and Details Task Flows
This example describes how to wire the master and details task flows so that a user can click a user name in the master task flow to pop up the details task flow displaying the page hits graph for that user.
To wire the master and details task flows:
-
Edit the source of the master task flow, Top 10 Visitor Page Hits.
For more information, see Section 20.4.2, "Editing the Source Code of an Asset."
-
In the Edit Source dialog, click the Fragment tab and paste the following code below
<af:panelGroupLayout id="pgl1">to reference the details task flow in a popup:<af:popup id="popup1" launcherVar="source" eventContext="launcher" contentDelivery="lazyUncached"> <af:dialog> <af:region xmlns:af="http://xmlns.oracle.com/adf/faces/rich" id="oc_449838760region1" value="#{bindings.popTaskflow.regionModel}"/> </af:dialog> <af:setPropertyListener from="#{source.attributes.userid}" to="#{viewScope.userid}" type="popupFetch"/> </af:popup> -
Find the
<goLink>code segment and replace it with the following so that the USERID column displays command links that invoke a popup dialog:<af:commandLink text="#{row.bindings.USERID.inputValue}" id="userLink"> <af:clientAttribute name="userid" value="#{row.bindings.USERID.inputValue}"/> <af:showPopupBehavior popupId="::popup1" alignId="userLink" align="afterEnd"/> </af:commandLink> -
Click the Page Definition tab, and add a reference to the details task flow. Paste the following code within the
<executable>tag and below the<iterator>tag:<taskFlow id="popTaskflow" taskFlowId="details_taskflow_definition_path#blanktaskflow" xmlns="http://xmlns.oracle.com/adf/controller/binding" Refresh="ifNeeded"> <parameters> <parameter id="userid" value="#{viewScope.userid}"/> </parameters> </taskFlow>where
details_taskflow_definition_pathis the path to the PageHitsForSelectedUser task flow in your instance, for example,/oracle/webcenter/siteresources/scopedMD/s8bba98ff_4cbb_40b8_beee_296c916a23ed/taskFlow/gsr34e6278e_9e9a_45eb_bbbf_31aa5ae34381/taskflow-definition.xml.You can get this path by selecting the PageHitsForSelectedUser task flow and choosing View Properties from the Actions menu. The Metadata File attribute provides the complete path to the task flow.
-
To test the master-detail relationship, preview the Top 10 Visitor Page Hits task flow. When you click a user name link, for example weblogic, the page hits graph for that user is displayed in a popup window, as shown in Figure C-8.
Figure C-8 Master-Detail Relationship Between Two Task Flows
Description of ''Figure C-8 Master-Detail Relationship Between Two Task Flows''
C.2 Displaying Employee Data from SQL Data Control
The following examples describe how to display data retrieved from an employee database and customize the data visualization by performing a few simple configurations. They describe how to add the EmpDetails data control as a table to the Employee Details task flow and perform different customizations on the table, such as showing or hiding columns and sorting rows. It includes the following sections:
-
Section C.2.1, "Creating the SQL Data Control and Consuming it in a Task Flow"
-
Section C.2.2, "Adding a Parameter Form to a Data Visualization"
-
Section C.2.3, "Binding Task Flow Parameters to Data Control Parameters"
C.2.1 Creating the SQL Data Control and Consuming it in a Task Flow
Perform the following tasks to create a data control for the employee database:
-
Create a connection to the employee database. For the detailed steps, see the "Creating a JDBC Data Source" section in Configuring and Managing JDBC Data Sources for Oracle WebLogic Server.
-
Create a SQL data control,
EmpDetails, using this database connection. Specify the following SQL query:select ename, empno, mgr, deptno from emp where job in (:jobId) order by empno asc
For the detailed steps, see Section 27.2.2.1, "Creating a SQL Data Control."
This query returns records for all employees whose designation matches the value of
jobId. The records are sorted by employee number. -
Set the bind variables as follows:
-
jobId -
SALESMAN
For the detailed steps, see Section 27.2.2.1, "Creating a SQL Data Control."
-
-
Expose the data control in the resource catalog by selecting the check box in the Available column.
For more information, see Section 20.5.3, "Showing and Hiding Assets."
-
Create a task flow,
Employee Details, based on the Blank task flow style.For the detailed steps, see Section 27.3.3, "Creating a Task Flow to Visualize Data."
-
Edit the task flow and from the inline resource catalog, add the EmpDetails data control accessor as a table with the following options:
-
Select the Read-only Table table type.
-
On the Type page, select Row Selection, Filtering, and Sorting.
-
On the Items page, move MGR to the Available Items list so that it is not displayed in the table. Leave ENAME, EMPNO, and DEPTNO in the Selected Items list.
-
Accept the default values on all other pages of the wizard.
For the detailed steps, see Section 27.3.5.2, "Presenting Data as a Table."
The table displays with an empty field at the top of each column, as shown in Figure C-9. You can use those fields to specify filter criteria for the columns.
Figure C-9 Table in the Employee Details Task Flow
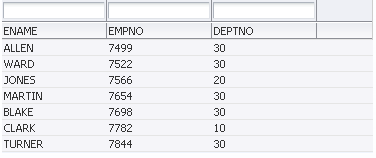
Description of ''Figure C-9 Table in the Employee Details Task Flow''
-
C.2.2 Adding a Parameter Form to a Data Visualization
You can add a parameter form to a data visualization to provide an input field where users can specify a value. This value is passed to a data control accessor parameter so that the accessor displays data based on the user input.
To add a parameter form to a data visualization:
-
Create a task flow,
Employee Details with Parameter Form, based on the Blank task flow style.For the detailed steps, see Section 27.3.3, "Creating a Task Flow to Visualize Data."
-
Edit the task flow and from the inline resource catalog, add the EmpDetails data control accessor as a table with the following options:
-
Select the Read-only Table table type.
-
On the Type page, select Row Selection, Filtering, and Sorting.
-
On the Items page, move MGR to the Available Items list so that it is not displayed in the table. Leave ENAME, EMPNO, and DEPTNO in the Selected Items list.
-
On the Visualization Parameter page, select the check box next to the jobId parameter.
-
Accept the default values on all other pages of the wizard.
You can now specify a value in the jobId input text field to view the corresponding records in the table.
-
C.2.3 Binding Task Flow Parameters to Data Control Parameters
Perform the following steps to bind a task flow parameter to the data control parameter:
-
Edit the Employee Details task flow.
-
Create a task flow parameter,
designation, and from the Storage drop-down list, select pageFlowScope to set the value to#{pageFlowScope.designation}. -
Edit the table. In the Component Properties dialog, click the Data tab.
Tip:
Make sure you are editing the properties of the table and not the surrounding layout component. If necessary switch to Structure view, right-click the table and choose Edit from the context menu. -
Set the Default Value of the jobId parameter to the storage value of the task flow parameter,
#{pageFlowScope.designation}.This uses the
designationtask flow parameter to drive the data displayed in the table by setting the value of thejobIdbind variable to be the same as the value specified for thedesignationparameter.For the detailed steps, see Section 27.3.6.3, "Binding a Data Control Parameter to a Task Flow Parameter."
-
Create a page and add the Employee Details task flow to the page.
For the detailed steps, see Section 27.3.9, "Consuming a Task Flow in a Page."
-
Edit the Employee Details task flow on the page, and on the Parameters tab, specify a designation to view corresponding details in the table.
C.2.4 Showing a Hidden Column in the Table
In your SQL query, you specified that the data control must retrieve the columns ename, empno, deptno, and mgr. However, you chose to display only the ename, empno, and deptno columns. In this case, the data control retrieves data from all four data columns, but displays only three. You can render the fourth column in the table by editing the table's source code.
To show a hidden column in a table:
-
Edit the source of the Employee Details task flow.
For more information, see Section 20.4.2, "Editing the Source Code of an Asset."
-
In the Edit Source dialog, click the Fragments tab, and locate the code for the hidden column. It would be similar to the code in the following example:
<column sortProperty="MGR" filterable="true" sortable="true" headerText="#{bindings.accessor_gsrf2d136f7_d907_481d_ad3a_eb2b9dbe7c35.hints.MGR.label}" id="column4" rendered="false"> <af:inputText value="#{row.bindings.MGR.inputValue}" label="#{bindings.accessor_gsrf2d136f7_d907_481d_ad3a_eb2b9dbe7c35.hints.MGR.label}" required="#{bindings.accessor_gsrf2d136f7_d907_481d_ad3a_eb2b9dbe7c35.hints.MGR.mandatory}" columns="#{bindings.accessor_gsrf2d136f7_d907_481d_ad3a_eb2b9dbe7c35.hints.MGR.displayWidth}" maximumLength="#{bindings.accessor_gsrf2d136f7_d907_481d_ad3a_eb2b9dbe7c35.hints.MGR.precision}" shortDesc="#{bindings.accessor_gsrf2d136f7_d907_481d_ad3a_eb2b9dbe7c35.hints.MGR.tooltip}" id="inputText4"> <f:validator binding="#{row.bindings.MGR.validator}"/> <af:convertNumber groupingUsed="false" pattern="#{bindings.accessor_gsrf2d136f7_d907_481d_ad3a_eb2b9dbe7c35.hints.MGR.format}" id="convertNumber3"/> </af:inputText> </column> -
Set the
renderedattribute totrue.The table now displays all four columns, as shown in Figure C-10.
Figure C-10 Table Displaying Four Columns
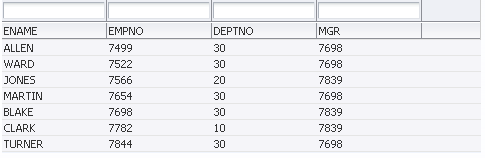
Description of ''Figure C-10 Table Displaying Four Columns''
Similarly, you can hide a visible column by setting its rendered attribute to false.
C.3 Presenting Data from the WebCenter Portal MDS Repository
A WebCenter Portal application is seeded with the following repository connections:
-
WebCenterDS -
mds-owsm -
mds-SpacesDS -
ActivitiesDS
You can create data controls for any of these connections and consume them in task flows. This example describes how to create a data control to connect to the WebCenter Portal repository and display details about the portals and pages in the application and so on.
To present data from the WebCenter Portal MDS repository:
-
Create a SQL data control,
WebCenterPages, using the mds-SpacesDS connection. Specify the following SQL query:select 'Home Portal Pages' metric, count(*) value from mds_paths where path_type = 'DOCUMENT' and path_name like '%.jspx' and path_high_cn is null and path_fullname like '%/user/%' union select 'Business Role Pages' metric, count(*) value from mds_paths where path_type = 'DOCUMENT' and path_name like '%.jspx' and path_high_cn is null and path_fullname like '%/businessRolePages/%' union select 'Portal Template Pages' metric, count(*) value from mds_paths where path_type = 'DOCUMENT' and path_name like '%.jspx' and path_high_cn is null and path_fullname like '%/spacetemplate/%' union select 'Portal Pages' metric, count(*) value from mds_paths where path_type = 'DOCUMENT' and path_name like '%.jspx' and path_high_cn is null and (path_fullname not like '%/user/%' and path_fullname not like '%/businessRolePages/%' and path_fullname not like '%/spacetemplate/%')
This query retrieves page-related data from the WebCenter Portal data source and a count of each page type, as shown in Figure C-11.
Figure C-11 Data Control with Page Information from the WebCenter Portal Repository
Description of ''Figure C-11 Data Control with Page Information from the WebCenter Portal Repository''
This type of information can be represented either in a table or a graph. This example adds the data control as a graph.
-
Expose the data control in the resource catalog by selecting the check box in the Available column.
For more information, see Section 20.5.3, "Showing and Hiding Assets."
-
Create a task flow,
Page Metrics, based on the Blank task flow style.For the detailed steps, see Section 27.3.3, "Creating a Task Flow to Visualize Data."
-
Edit the task flow and from the inline resource catalog, add the WebCenterPages data control accessor as a graph with the following options:
-
Select the Pie graph type.
-
On the Placement page, select Slices for the METRIC data columns and Pie for VALUE.
-
Accept the default values on all other pages of the wizard.
For the detailed steps, see Section 27.3.5.4, "Presenting Data as a Graph."
The graph is displayed as shown in Figure C-12.
Figure C-12 Page Metrics Displayed as a Pie Graph
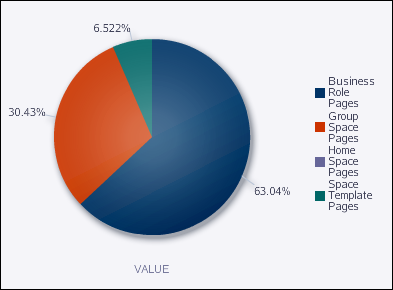
Description of ''Figure C-12 Page Metrics Displayed as a Pie Graph''
-
C.4 Presenting Data from a WebCenter Portal Web Service Data Source
You can create a data control to the WebCenter Portal web service and retrieve information about the application and portals, for example, list the portals in the instance. However, you must first prepare WebCenter Portal to expose web services.
Before you begin with the following examples, you must configure WS-Security for WebCenter Portal. For the detailed steps, see the "Configuring WS-Security" chapter in Administering Oracle WebCenter Portal. If you do not configure WS-Security, an error occurs when retrieving data from the data source.
This section describes the following use cases:
C.4.1 Listing the Portals in WebCenter Portal
This example describes how to use the WebCenter Portal web service to display a list of portals. The portal names are displayed as hyperlinks so that users can click a link to view the selected portal.
To list the portals in WebCenter Portal:
-
Create a web service data control,
ListPortals, (Figure C-13) using a WSDL URL with the appropriate machine name and port number, for example:http://myserver.example.com:8888/webcenter/SpacesWebService?WSDL
For the detailed steps, see Section 27.2.2.2, "Creating a Web Service Data Control."
Figure C-13 WebCenter Portal Web Service Data Control
Description of ''Figure C-13 WebCenter Portal Web Service Data Control''
-
Click Show Methods to view the methods provided by the web service.
-
From the Methods list, select getGroupSpaces.
-
In the Oracle Web Service Manager Security Policies section, apply the following additional policy:
oracle/wss11_saml_token_with_message_protection_client_policy
Tip:
You must click Next before you can create the data control. -
Expose the data control in the resource catalog by selecting the check box in the Available column.
For more information, see Section 20.5.3, "Showing and Hiding Assets."
-
Create a task flow,
Portals, based on the Blank task flow style.For the detailed steps, see Section 27.3.3, "Creating a Task Flow to Visualize Data."
-
Edit the task flow and from the inline resource catalog, add the Return attribute of the getGroupSpaces method of the ListPortals data control as a table with the following options:
-
Select the Read-only Table table type.
-
On the Columns page (Figure C-14), select the item column. From the Display As drop-down list, select Hyperlink, and in the URL field, enter the URL to which the portal name must be appended, for example:
/spaces/#{row.item}Select the Open in New Window check box.
-
Accept the default values on all other pages of the wizard.
For the detailed steps, see Section 27.3.5.2, "Presenting Data as a Table."
Figure C-14 Hyperlink Option on the Columns Page of the Create Table Dialog
Description of ''Figure C-14 Hyperlink Option on the Columns Page of the Create Table Dialog''
The table is displayed as shown in Figure C-15
Figure C-15 Task Flow Displaying a List of Portals
Description of ''Figure C-15 Task Flow Displaying a List of Portals''
-
C.4.2 Using a Form to Rename a Portal
This example describes how to use the WebCenter Portal web service to create a form that can be used to rename a given portal.
To use a form to rename a portal:
-
Create a web service data control,
RenamePortal, using a WSDL URL with the appropriate machine name and port number, for example:http://myserver.example.com:8888/webcenter/SpacesWebService?WSDL
For the detailed steps, see Section 27.2.2.2, "Creating a Web Service Data Control."
-
Click Show Methods to view the methods provided by the web service.
-
From the Methods list, select renameGroupSpace.
-
In the Oracle Web Service Manager Security Policies section, apply the following additional policy:
oracle/wss11_saml_token_with_message_protection_client_policy
Tip:
You must click Next before you can create the data control. -
Expose the data control in the resource catalog by selecting the check box in the Available column.
For more information, see Section 20.5.3, "Showing and Hiding Assets."
-
Create a task flow,
Rename Portal, based on the Blank task flow style.For the detailed steps, see Section 27.3.3, "Creating a Task Flow to Visualize Data."
-
Edit the task flow and from the inline resource catalog, add the renameGroupSpace method of the RenamePortal data control as an ADF Button.
-
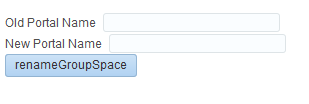
Add the arg1 and arg0 attributes as ADF Input Text w/Label.
This step adds two input text fields, where users can specify the old portal name and new portal name, and a button for applying the change.
-
Save and close the task flow.
-
Change the labels for the input text fields:
-
Select the task flow. From the Actions menu, select Edit Source and then click the Fragment tab.
-
Replace the
labelvalue for the firstinputTextcomponent (#{bindings.arg0.hints.label}) toOld Portal Name. -
Replace the
labelvalue for the secondinputTextcomponent (#{bindings.arg1.hints.label}) toNew Portal Name. -
Click Save and Close.
The task flow now appears as shown in Figure C-16.
Figure C-16 Task Flow to Change a Portal Name
Description of ''Figure C-16 Task Flow to Change a Portal Name''
-
-
Expose the task flow in the resource catalog by selecting the check box in the Available column.
For more information, see Section 20.5.3, "Showing and Hiding Assets."
You can now add this task flow to any page and provide the capability to change portal names.
C.5 Building and Using a Custom Task Flow Style with Predefined Columns
This example describes how to create a custom task flow style and use that style to create a task flow. The custom style is designed to list the top five page hits in a portal in a layout similar to the WebCenter Portal Activity Stream layout. An input text field enables users to specify a portal name to view page hits for that portal.
This section includes the following topics:
C.5.1 Building the Custom Task Flow Style
As WebCenter Portal does not provide a Create option for task flow styles, the only way to build a new task flow style is by copying an existing task flow style and replacing its source code.
To build the custom task flow style:
-
Create a copy of the Blank task flow style and name it
PageHitsStyle.For the detailed steps, see Section 20.5.4, "Copying an Asset."
-
Edit the source of PageHitsStyle and replace the code on the Fragment tab with the following:
<?xml version='1.0' encoding='UTF-8'?>
<jsp:root xmlns:jsp="http://java.sun.com/JSP/Page" version="2.1"
          xmlns:pe="http://xmlns.oracle.com/adf/pageeditor"
          xmlns:cust="http://xmlns.oracle.com/adf/faces/customizable"
          xmlns:f="http://java.sun.com/jsf/core"
          xmlns:af="http://xmlns.oracle.com/adf/faces/rich">
  <af:panelGroupLayout id="pgl1">
    <af:panelGroupLayout id="pg2" layout="horizontal" halign="center"
                         inlineStyle="padding-bottom:5px;">
      <af:inputText id="ip1" value="#{pageFlowScope.bindVarId}" label="Portal Name"
                    shortDesc="Enter A Portal Name, by default it's all portals"/>
      <af:commandButton text="#{dataComposerBundle.MASHUP_STYLES_GO}" id="cb1"/>
    </af:panelGroupLayout>
    <cust:panelCustomizable id="pc1">
      <table border="0" width="100%">
        <af:iterator id="i1" value="#{dataPresenter.dummyData.collectionModel}" var="row">
        <tr class="PortletText1">
          <td width="12px">
            <af:image id="img1" source="/adf/webcenter/star_sm_ena.png"/>
          </td>
          <td>
            <af:outputText id="otCol1" value="#{empty row.USERNAME ? '#{row.USERNAME}' : row.USERNAME}"
                           inlineStyle="color:#333333; font-size:12px; font-weight:bold;"/>
            <af:spacer id="spacer1" width="5px"/>
            <af:outputText id="otCol2" value="viewed" inlineStyle="color:#333333; font-size:12px;"/>
            <af:spacer id="spacer2" width="5px"/>
            <af:goLink id="gl1" destination="{doc path prefix}#{empty row.DOWNLOAD_URL ? '#{row.DOWNLOAD_URL}' : row.DOWNLOAD_URL}"
                       targetFrame="_blank" text="#{empty row.DOCNAME ? '#{row.DOCNAME}' : row.DOCNAME}"/>
          </td>
        </tr>
        <tr>
          <td/>
          <td>
            <af:outputText id="otCol3" value="#{empty row.HITS? '#{row.HITS}' : row.HITS}"
                           inlineStyle="color:#666666; font-size:12px;"/>
            <af:spacer id="spacer3" width="5px"/>
            <af:outputText id="otCol4" value="TIMES" inlineStyle="color:#666666; font-size:12px;"/>
            <af:spacer id="spacer4" width="5px"/>
            <af:outputText id="otCol5" value="in the last 7 days" inlineStyle="color:#333333; font-size:12px;"/>
          </td>
        </tr>
        <tr>
          <td/>
          <td>
            <af:outputText id="otCol6" value="Last Visit at " inlineStyle="color:#333333; font-size:12px;"/>
            <af:outputText id="otCol7" value="#{empty row.LASTVIEWED ? '#{row.LASTVIEWED}' : row.LASTVIEWED}"
                           inlineStyle="color:#666666; font-size:12px;">
            <af:convertDateTime type="both"/>
            </af:outputText>
          </td>
        </tr>
        </af:iterator>
      </table>
    </cust:panelCustomizable>
  </af:panelGroupLayout>
</jsp:root>
where:
#{pageFlowScope.bindVarId}is a reference that provides the input portal name#{dataPresenter.dummyData.collectionModel}is a dummy reference that gets replaced when you use the task flow style#{row.COLUMN}are placeholders that will reference data from data controls when the task flow style is used{doc path prefix}is the prefix to be used for the document URL. To find the prefix for a document path, select a document on the Documents page and click Get a Link from the View menu. The first part of the Download URL (ending inpath) is the prefix to be used. For example:http://www.example.com:8889/webcenter/content/conn/example-ucm/path
If you preview the task flow style, it displays as shown in Figure C-17.
Figure C-17 Preview of the Custom Task Flow Style
Description of ''Figure C-17 Preview of the Custom Task Flow Style''
-
Expose the task flow style by selecting the check box in the Available column.
For more information, see Section 20.5.3, "Showing and Hiding Assets."
You can use this task flow style to build task flows that display page hits.
C.5.2 Creating a Task Flow Based on the Custom Style
This example describes how to use the PageHits task flow style to create a task flow that displays page hits in an Activity Stream layout. To illustrate this, you must create a SQL data control using the ActivitiesDS database connection, then consume the data control in a task flow based on the PageHits task flow style. However, to display the data from the data control in an Activity Stream layout instead of the typical table or graph layout, you must perform the following tasks:
-
Create a SQL data control.
-
Create a task flow based on the new
PageHitstask flow style. -
Add the data control as a table.
-
Copy the data control's accessor ID from the table's properties.
-
Hide the table.
-
Wire the input text field in the task flow to the data control using the accessor ID.
To create a task flow based on the custom style:
-
Create a SQL data control,
TopFiveViewedDocumentsinaGivenPortal, using the ActivitiesDS connection. Specify the following query:SELECT * FROM (SELECT users.userid username, doc.name_ docname,doc.path_ download_url, count(1) hits,max(fact.occurred) lastviewed FROM asfact_wc_doclib__0 fact , asdim_wc_documen_0 doc , asdim_wc_applica_0 app,asdim_wc_groupsp_0 space , asdim_users users WHERE app.id = fact.application_ AND app.name_ = 'webcenter' AND fact.occurred BETWEEN (SYSDATE-7) AND SYSDATE AND fact.document_ = doc.id AND doc.name_ is not null AND doc.id is not null AND fact.document_ is not null AND doc.resourceid_ is not null AND fact.GROUPSPACE_ = space.id AND upper(space.name_) LIKE upper(:portalname) AND space.name_ IS NOT NULL AND fact.userid=users.id GROUP BY users.userid, doc.name_,doc.path_ ORDER BY hits DESC) WHERE rownum <= 5 ORDER BY rownum
-
Set the bind variables as follows:
-
portalname -
Home Portal
For the detailed steps, see Section 27.2.2.1, "Creating a SQL Data Control."
-
-
Expose the data control in the resource catalog by selecting the check box in the Available column.
For more information, see Section 20.5.3, "Showing and Hiding Assets."
-
Create a task flow,
Top Five Viewed Documents in a Given Portal, using the PageHits task flow style, as shown in Figure C-18.Figure C-18 Create New Task Flow Dialog with PageHits Style
Description of ''Figure C-18 Create New Task Flow Dialog with PageHits Style''
-
Edit the task flow and from the inline resource catalog, add the TopFiveViewedDocumentsinaGivenPortal data control accessor as a table with the following options:
-
Select the Read-only Table table type.
-
On the Visualization Parameter page, enter the following Default Value for the portalname parameter:
#{pageFlowScope.bindVarId} -
Accept the default values on all other pages of the wizard.
For the detailed steps, see Section 27.3.5.2, "Presenting Data as a Table."
-
-
To get the accessor ID:
-
Switch to Structure view of the task flow, right-click the table component, and choose Edit.
-
In the Component Properties dialog, copy the value of the Value attribute. This is the accessor ID for the data control. The value may be similar to the following:
#{bindings.accessor_gsraffebf20_b500_4880f_bf92_a9d33922a0a7.collectionModel
-
-
Select the showDetailFrame component wrapping the table and choose Hide Component on the context menu.
-
Right-click the iterator component, and choose Edit.
-
Replace the value in the Value field with the accessor ID you copied from the table's properties.
You now have a task flow with the Activity Stream-like seeded layout.
-
Save and close the task flow.
-
Expose the task flow in the resource catalog by selecting the check box in the Available column.
For more information, see Section 20.5.3, "Showing and Hiding Assets."
-
Consume the task flow in a page. It appears as shown in Figure C-19.
Figure C-19 Page Displaying Top Five Page Hits in a Portal
Description of ''Figure C-19 Page Displaying Top Five Page Hits in a Portal''
C.6 Building and Using a Custom Task Flow Style with Date Fields
This example describes how to create a custom task flow style with fields to specify a date range and a content area to display a visualization of data for the specified date range. Figure C-20 shows a task flow created using such a task flow style. The example also describes how to create a task flow using the custom style.
This section includes the following topics:
Figure C-20 Task Flow Using Custom Task Flow Style with Date Fields
Description of ''Figure C-20 Task Flow Using Custom Task Flow Style with Date Fields''
C.6.1 Building the Custom Task Flow Style
As WebCenter Portal does not provide a Create option for task flow styles, the only way to build a new task flow style is by creating a copy of an existing task flow style and replacing its source code.
To build the custom task flow style:
-
Create a copy of the Blank task flow style and name it
Input Dates.For the detailed steps, see Section 20.5.4, "Copying an Asset."
-
Edit the source of Input Dates and replace the code on the Fragment tab with the following:
<?xml version='1.0' encoding='UTF-8'?>
<jsp:root xmlns:jsp="http://java.sun.com/JSP/Page" version="2.1"
          xmlns:pe="http://xmlns.oracle.com/adf/pageeditor"
          xmlns:cust="http://xmlns.oracle.com/adf/faces/customizable"
          xmlns:f="http://java.sun.com/jsf/core"
          xmlns:af="http://xmlns.oracle.com/adf/faces/rich">
  <af:panelGroupLayout id="pgl">
    <af:panelGroupLayout id="pg2" layout="horizontal" halign="center" inlineStyle="padding-bottom:5px;">
      <af:panelFormLayout id="pfl1" partialTriggers="ipl" inlineStyle="padding-bottom:5px;">
        <af:inputDate id="ip1" value="#{pageFlowScope.bindVarId1}" label="Start Date" autoSubmit="true"/>
        <af:inputDate id="ip2" value="#{pageFlowScope.bindVarId2}" label="End Date"/>
        <af:commandButton text="#{dataComposerBundle.MASHUP_STYLES_GO}" id="cb1"/>
      </af:panelFormLayout>
    </af:panelGroupLayout>
    <cust:panelCustomizable id="pc1" halign="center"/>
  </af:panelGroupLayout>
</jsp:root>
The
inputDatecomponents provide the two date fields, and thepanelCustomizableprovides the content area. When previewed, the task flow style appears as shown in Figure C-21.Figure C-21 Preview of Custom Style with Date Fields
Description of ''Figure C-21 Preview of Custom Style with Date Fields''
-
Expose the task flow style by selecting the check box in the Available column.
For more information, see Section 20.5.3, "Showing and Hiding Assets."
You can use this task flow style to build a task flow and populate the content area with a visualization of your choice.
C.6.2 Creating a Task Flow Based on the Custom Style
This example describes how to use the Input Dates task flow style to create a task flow that displays a graph of the page hits for a specified date range. To illustrate this, you must create a SQL data control using the ActivitiesDS database connection, then consume the data control in a task flow based on the Input Dates task flow style.
To use the custom task flow style:
-
Create a SQL data control,
Page Usage Between Two Dates, using theActivitiesDSconnection. Specify the following SQL query:SELECT page.name_ pageName, space.name_ spaceName, COUNT(1) hits FROM asdim_users u, asdim_wc_pages_0 page, asdim_wc_applica_0 app, asdim_wc_groupsp_0 space, asfact_wc_pagevie_0 fact WHERE app.name_ = 'webcenter' AND fact.page_ = page.id AND fact.userid = u.id AND fact.application_ = app.id AND fact.groupspace_ = space.id AND fact.occurred BETWEEN to_timestamp_tz(to_char(:startdate), :dateformat) AND to_timestamp_tz(to_char(:enddate), :dateformat) AND space.name_ IS NOT NULL AND page.name_ IS NOT NULL AND space.id IS NOT NULL AND page.id IS NOT NULL AND fact.page_ IS NOT NULL AND page.resourceid_ IS NOT NULL GROUP BY page.name_, space.name_
-
Set the bind variables as follows:
-
startdate -
01/01/2013 -
dateformat -
MM/DD/YYYY -
enddate -
01/01/2014
-
-
Expose the data control in the resource catalog by selecting the check box in the Available column.
For more information, see Section 20.5.3, "Showing and Hiding Assets."
-
Create a task flow,
Page Usage Between Two Dates, using the Input Dates task flow style, as shown in Figure C-22.Figure C-22 Input Dates Task Flow Style in the Create New Task Flow Dialog
Description of ''Figure C-22 Input Dates Task Flow Style in the Create New Task Flow Dialog''
-
Edit the task flow and add the Page Usage Between Two Dates data control accessor as a graph with the following options:
-
Select the Bar graph type.
-
On the Placement page, select X Axis for the PAGENAME and SPACENAME data columns, and Bars for HITS.
-
Accept the default values on all other pages of the wizard.
-
-
The graph displays data for the default dates. Change the Start Date and End Date then click Go to display different data (Figure C-23).
Figure C-23 Task Flow Showing Graph for Specified Date Range
Description of ''Figure C-23 Task Flow Showing Graph for Specified Date Range''
C.7 Presenting Data in a Master-Detail Relationship that Contains a Google Maps Task Flow
This example describes how to display two task flows wired in a master-detail relationship so that a selection in the master task flow results in an update to the Google Map address in the details task flow, as shown in Figure C-24.
Figure C-24 Task Flow Displaying a Table and Google Map
Description of ''Figure C-24 Task Flow Displaying a Table and Google Map''
The steps to build such a task flow include:
-
Creating a SQL data control to retrieve static data for the purpose of the demo.
-
Creating a master task flow that consumes this data control as a static table.
-
Adding hyperlinks in the user names column in the table.
-
Creating a details task flow to integrate the latest Google Maps API Version 3.
-
Wiring the master and detail task flows so that clicking a record in the master table results in a location change in the Google Map.
This section includes the following topics:
C.7.1 Creating the Data Control
For the purpose of this example, create a data control to get address data using select * from dual statements. You can use any existing data source connection to create the data control. In real time, you must replace it with the required SQL data source connection. To create the data control:
-
Create a SQL data control,
addresses, using any available database connection, and specify the following query:SELECT 'Steve' Buddy, 'Palo Alto' City, 'CA' State FROM dual UNION SELECT 'Doris' Buddy, 'Belmont' City, 'CA' State FROM dual UNION SELECT 'John' Buddy, 'New York' City, 'NY' State FROM dual UNION SELECT 'Lily' Buddy, 'Boston' City, 'MA' State FROM dual
-
Expose the data control in the resource catalog by selecting the check box in the Available column.
For more information, see Section 20.5.3, "Showing and Hiding Assets."
C.7.2 Creating the Details Task Flow
This example describes how to create a details task flow that will display the Google map.
To create the details task flow:
-
Create a task flow,
Basic Maps, based on the Blank task flow style. -
Edit the source code of the task flow.
For more information, see Section 20.4.2, "Editing the Source Code of an Asset."
-
In the Edit Source dialog, replace the code on the Fragment tab with the following:
<?xml version='1.0' encoding='UTF-8'?>
<jsp:root xmlns:jsp="http://java.sun.com/JSP/Page" version="2.1"
          xmlns:pe="http://xmlns.oracle.com/adf/pageeditor"
          xmlns:cust="http://xmlns.oracle.com/adf/faces/customizable"
          xmlns:f="http://java.sun.com/jsf/core"
          xmlns:af="http://xmlns.oracle.com/adf/faces/rich"
          xmlns:trh="http://myfaces.apache.org/trinidad/html">
  <af:resource type="javascript" source="http://maps.google.com/maps/api/js?sensor=true"/>
  <af:resource type="javascript">
  var geocoder;
  var map;
function initialize(){
  geocoder = new google.maps.Geocoder();
  var latlng = new google.maps.LatLng(37.529526, -122.263969);
  var myOptions = {
      zoom: 3,
      center: latlng,
      mapTypeId: google.maps.MapTypeId.ROADMAP
    };
  map = new google.maps.Map(document.getElementById("map_canvas"),myOptions);
}
function navigate(event) {
initialize();
var city= event.getSource().getProperty('city')+"";
var state= event.getSource().getProperty('state')+"";
var address;
if(city== "undefined"||state== "undefined"||city== "NULL"||state== "NULL"){
address="CA, USA";
} else {
map.setZoom(8);
address=city+" "+state+" USA";
}
  geocoder.geocode( { 'address': address}, function(results, status)
{
 if (status == google.maps.GeocoderStatus.OK) {
     map.setCenter(results[0].geometry.location);
     var marker = new google.maps.Marker({
        map: map,
        position: results[0].geometry.location
        });
      }
else {
        alert("Geocode was not successful for the following reason: " + status);
      }
    });
}
</af:resource>
  <af:panelGroupLayout id="pgl1" layout="horizontal">
    <cust:panelCustomizable id="pc1" layout="scroll">
      <af:group id="g1">
        <div id="map_canvas" style="width: 600px; height: 600px"/>
      </af:group>
      <af:inlineFrame source="">
        <af:clientListener type="inlineFrameLoad" method="navigate"/>
        <af:clientAttribute name="city" value="#{empty pageFlowScope.city? '' : pageFlowScope.city}"/>
        <af:clientAttribute name="state" value="#{empty pageFlowScope.state ? '' : pageFlowScope.state}"/>
      </af:inlineFrame>
    </cust:panelCustomizable>
  </af:panelGroupLayout>
</jsp:root>
The code in bold,
<af:inline>, calls thenavigateGoogle Map javascript method each time the page is loaded, and it parses twopageFlowScopeparameters to thenavigatemethod to update the address on the map. -
Click Save and Close.
-
Edit the task flow and click Task Flow Properties.
-
Create two string task flow parameters, as shown in Table C-1 and Figure C-25:
Table C-1 Task Flow Parameters for Basic Maps Task Flow
Name Type Storage citystring#{pageFlowScope.city}statestring#{pageFlowScope.state}Figure C-25 New Parameters on the Basic Maps Task Flow
Description of ''Figure C-25 New Parameters on the Basic Maps Task Flow''
-
Expose the task flow in the resource catalog by selecting the check box in the Available column.
For more information, see Section 20.5.3, "Showing and Hiding Assets."
C.7.3 Creating the Master Task Flow
This example describes how to create the master task flow to consume the addresses data control as a table and the Basic Maps task flow.To create the master task flow:
-
Create a task flow,
Address on Google Maps, based on the Blank task flow style. -
Edit the task flow and add the
Basic Mapstask flow, as shown in Figure C-26.Figure C-26 Basic Maps Task Flow in the resource catalog
Description of ''Figure C-26 Basic Maps Task Flow in the resource catalog''
-
Add the
addressesdata control accessor as a Read-only Table with Row Selection enabled.The master task flow displays the addresses table on top and the map below it, as shown in Figure C-27.
Figure C-27 Master-Detail Task Flow with Table and Google Map
Description of ''Figure C-27 Master-Detail Task Flow with Table and Google Map''
C.7.4 Wiring the Master and Details Task Flows
This example describes how to wire the master and details task flows so that a user can click a name in the table to show the corresponding location in the map.To wire the master and details task flows:
-
Edit the master task flow,
Address on Google Maps, and edit the properties of the Basic Maps task flow (Figure C-28).Figure C-28 The Edit Icon for the Basic Maps Task Flow
Description of ''Figure C-28 The Edit Icon for the Basic Maps Task Flow''
Tip:
If you cannot see the Edit icon for the Basic Maps task flow, try hiding the inline resource catalog. -
In the Component Properties dialog, modify the values for the two task flow parameters, City and State, as follows:
City:
#{empty dataComposerViewContext.dataSelection.CITY ? 'NULL' : dataComposerViewContext.dataSelection.CITY}State:
#{empty dataComposerViewContext.dataSelection.STATE ? 'NULL' : dataComposerViewContext.dataSelection.STATE}Figure C-29 Basic Map Task Flow Properties
Description of ''Figure C-29 Basic Map Task Flow Properties''
-
To hide the header on the map, click the Display Options tab and deselect the Display Header check box.
-
Click OK to save your changes.
The map displays the location corresponding to the currently selected name in the table.
-
Click Save and Close to exit edit mode.
The task flow displays as shown in Figure C-30.
Figure C-30 Master Task Flow Wired to Google Map
Description of ''Figure C-30 Master Task Flow Wired to Google Map''
-
Optionally, you can change the layout of the task flow so that the table displays to the left of the map. To refine the layout of the master task flow:
-
Edit the source of the master task flow,
Address on Google Maps, and on the Fragment tab, replace the following lines:<af:panelGroupLayout id="pgl1"> <cust:panelCustomizable id="pc1">
with
<af:panelGroupLayout id="pgl1" layout="horizontal" valign="top">
   <cust:panelCustomizable id="pc1" layout="vertical" valign="top">
-
Move the closing
</cust:panelCustomizable>tag so that it is between the twoshowDetailFrametags, as follows:</showDetailFrame> </cust:panelCustomizable> <showDetailFrame>
-
To disable default selection in the table, remove the
selectedRowKeysattribute on the<table>tag. -
To ensure that the map stretches when required, change the
columnStretchingattribute tolast.
-
-
To test the master-detail task flow further, create a page and add the
Address on Google Mapstask flow to it.Edit the task flow on the page and set the Stretch Content option to
auto.Note:
To ensure that the page reflects your recent changes, you may need to directly use the URL to open the page afresh, rather than clicking the Refresh button.The task flow displays as shown in Figure C-31.
Figure C-31 Page Displaying Master-Detail Task Flow
Description of ''Figure C-31 Page Displaying Master-Detail Task Flow''
Select a row in the table. The map displays the location corresponding to the city and state in the selected row.