3 Creating and Applying Filters for Visualizing Data
This topic describes how you can use filters to find and focus on the data you want to explore.
Topics:
Typical Workflow for Creating and Applying Filters
Here are the common tasks for creating and applying filters to projects, visualizations, and canvases.
| Task | Description | More Information |
|---|---|---|
| Choose the appropriate filter type | Filter types (Range, Top / Bottom N filter, List, Date, and Expression) are specific to either a project, visualization, or canvas. | |
| Create filters on projects and visualizations | Create filters on a project or visualization to limit the data displayed and focus on a specific section or category. | |
| Build and use expression filters | You can build and use expression filters to define more complex filters using SQL expressions. | Building Expression Filters |
| Set visualization interaction properties | Define how you want visualizations to affect each other. | How Visualizations and Filters Interact |
About Filters and Filter Types
Filters reduce the amount of data shown in visualizations, canvases, and projects.
The Range, List, Date, and Expression filter types are specific to either a visualization, canvas, or project. Filter types are automatically determined based on the data elements you choose as filters.
-
Range filters: Generated for data elements that are number data types and that have an aggregation rule set to something other than none. Range filters are applied to data elements that are measures, and that limit data to a range of contiguous values, such as revenue of $100,000 to $500,000. Or you can create a range filter that excludes (as opposed to includes) a contiguous range of values. Such exclusive filters limit data to noncontiguous ranges (for example, revenue less than $100,000 or greater than $500,000). See Applying Range Filters.
-
List filters: Applied to data elements that are text data types and number data types that aren’t aggregatable. See Applying List Filters.
-
Date filters: Use calendar controls to adjust time or date selections. You can either select a single contiguous range of dates, or you can use a date range filter to exclude dates within the specified range. See Applying Date Filters.
-
Expression filters: Let you define more complex filters using SQL expressions. See Building Expression Filters.
How Visualizations and Filters Interact
There are several ways that filters can interact with visualizations in a project. For example, filters might interact differently with visualizations depending on the number of data sets, whether the data sets are joined, and what the filters are applied to.
Topics:
How Data Sets Interact with Filters
Various factors affect the interaction of data sets and filters in projects:
-
The number of data sets within a project.
-
The data sets that are joined (connected) or not-joined (for a project with multiple data sets).
-
The data elements (columns) that are matched between joined data sets.
You can use the Data Diagram in the Prepare canvas of a project to:
-
See joined and not-joined data sets.
-
Join or connect multiple data sets by matching the data elements in the data sets.
-
Disconnect the data sets by removing matched data elements.
How the Number of Data Sets Interact with Filters in a Project
You can add filters to the filter bar or to individual visualizations in a project.
| Number of Project Data Sets | Filter Interaction |
|---|---|
| Single Data Set |
|
| Multiple Data Sets |
|
You can use the Limit Values By options to remove or limit how the filters in the filter bar restrict each other.
Synchronizing Visualizations in a Project
You use the Synchronize Visualizations setting to specify how the visualizations on your canvas interact. By default, visualizations are linked for automatic synchronization. You can deselect Synchronize Visualizations to unlink your visualizations and turn automatic synchronization off.
When Synchronize Visualizations is on (selected), then all filters on the filter bar and actions that create filters (such as Drill) apply to:
-
All the visualizations in a project with a single data set.
-
All the visualizations of joined data sets with multiple data sets.
If a data element from a data set is specified as a filter but isn't matched with the joined data sets, then the filter only applies to the visualization of the data set that it was specified for.
Note:
-
When you hover the mouse pointer over a visualization to see the filters applied to the visualization, any filter that isn't applied to the visualization is grayed out.
-
Any visualization-level filters are applied only to the visualization.
-
When Synchronize Visualizations is off (deselected), then analytic actions such as Drill affect the visualization to which you applied the action.
The analytic actions such as Drill affect only the visualization to which you applied the action.
About Automatically Applied Filters
By default, the filters in the filter bar and filter drop target are automatically applied. However, you can turn this behavior off if you want to manually apply the filters.
When the Auto-Apply Filters is selected in the filter bar menu, the selections you make in the filter bar or filter drop target are immediately applied to the visualizations. When Auto-Apply Filters is off or deselected, the selections you make in the filter bar or filter drop target aren’t applied to the canvas until you click the Apply button in the list filter panel.
Creating Filters on a Project
You can add filters to limit the data that’s displayed in the visualizations on the canvases in your project.
If your project contains multiple data sets and some aren’t joined, then there are restrictions for how you can use filters. Any visualization that doesn't use the data element of the filter is grayed out. See How Visualizations and Filters Interact.
Instead of or in addition to adding filters to the project or to an individual canvas, you can add filters to an individual visualization. See Creating Filters on a Visualization.
-
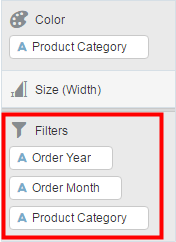
Click + Add Filter, and select a data element. Alternatively, drag and drop a data element from the Data Elements pane to the filter bar.
You can't specify data elements of a data set as a filter of other data sets, if the two data sets aren’t joined. See How Visualizations and Filters Interact.
-
Set the filter values. How you set the values depends upon the data type that you’re filtering.
-
Apply a range filter to filter on columns such as Cost or Quantity Ordered. See Applying Range Filters.
-
Apply a list filter to filter on columns such as Product Category or Product Name. See Applying List Filters.
-
Apply a date filter to filters on columns such as Ship Date or Order Date. See Applying Date Filters.
-
-
(Optional) Click the filter bar menu or right-click on the filter bar and select Add Expression Filter. See Building Expression Filters.
-
(Optional) Click the filter’s Menu and hover the mouse pointer over the Limit Value By option to specify how the filter interacts with the other filters in the filter bar. Note the following:
-
By default, the Auto option causes the filter to limit other related filters in the filter bar.
For example, if you have filters for Product Category and Product Name, and if you set the Product Category filter to Furniture and Office Supplies, then the options in the Product Name filter value pick list is limited to the product names of furniture and office supplies. You can select None to turn this limit functionality off.
-
You can specify any individual filter in the filter bar that you don’t want to limit.
For example, if you have filters for Product Category, Product Sub Category, and Product Name, and in the Limit Value By option for the Product Category filter you click Product Sub Category, then the product subcategory filter shows all values and not a list of values limited by what you select for Product Category. However, the values shown for Product Name is limited to what you select for Product Category.
-
-
(Optional) Click the filter bar menu or right-click on the filter bar, select Auto-Apply Filters, then click Off to turn off the automatic apply. When you turn off the automatic apply, then each filter’s selection displays an Apply button that you must click to apply the filter to the visualizations on the canvas.
-
Click the filter bar menu or right-click on the filter bar, and select Pin to All canvases of a filter to apply a filter to all canvases in the project.
Creating Filters on a Visualization
You can add filters to limit the data that’s displayed in a specific visualization on the canvas.
If a project contains multiple data sets and some aren't joined, then there are restrictions for how you can use filters. Any visualization that doesn't use the data element of the filter is grayed out. See How Visualizations and Filters Interact.
Visualization filters can be automatically created by selecting Drill on the visualization’s Menu when the Synchronize Visualizations option in the project’s Canvas Settings menu is turned off.
Instead of or in addition to adding filters to an individual visualization, you can add filters to the project or to an individual canvas. See Creating Filters on a Project. Any filters included on the canvas are applied before the filters that you add to an individual visualization.
Moving Filter Panels
You can move filter panels from the filter bar to a different spot on the canvas.
When you expand filters in the filter bar, it can block your view of the visualization that you’re filtering. Moving the panels makes it easy to specify filter values without having to collapse and reopen the filter selector.
-
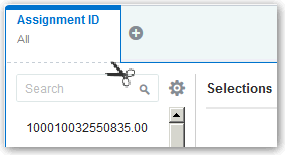
To detach a filter panel from the filter bar, place the cursor at the top of the filter panel until it changes to a scissors icon, then click it to detach the panel and drag it to another location on the canvas.

Description of the illustration GUID-F706A8DE-CCEE-40EE-8116-9107ECED4FC8-default.gif -
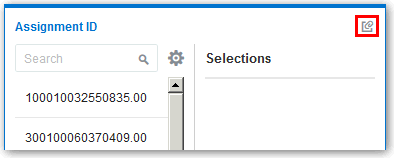
To reattach the panel to the filter bar, click the reattach panel icon.

Description of the illustration GUID-8E84D261-4A59-4DBF-B2F2-DA4BBC65C29B-default.gif
Applying Range Filters
You use Range filters for data elements that are number data types and that have an aggregation rule set to something other than none.
Applying Top or Bottom N Filters
You use the Top / Bottom N filter to filter a measure to a subset of its largest (or smallest) values.
- To apply the Top / Bottom N filter to the canvas and all visualizations in the project:
- In the Visualize canvas, display the Filter Panel.
- Display the filter menu.
- Click the Filter Type menu option, and select Top / Bottom N.
- To apply the Top / Bottom N filter to a specific visualization in the project and update the filtered data on the canvas:
- In the Visualize canvas, display the Explore Panel.
- Click the filter in the Explore Panel and display the filter menu.
- Click the Filter Type menu option, and select Top / Bottom N.
- To change which filter method is applied, Top or Bottom, in the Top / Bottom N list, click the Method value.
- To display a particular number of top or bottom rows, in the Top / Bottom N list, click in the Count field and enter the number.
- To change which columns to group by, in the Top / Bottom N list, click in the By field, or to display the available columns that you can select from, click Plus (+).
- To deselect any member from the list of attributes, in the Attributes list, click the member that you want to deselect.
- To add a member to the list of attributes, in the Attributes list, click any nonselected member.
- Click outside of the filter to close the Filter Panel.
Applying List Filters
List filters are applied to text and non-aggregatable numbers. After you add a list filter, you can change the selected members that it includes and excludes.
Applying Date Filters
Date filters use calendar controls to adjust time or date selections. You can select a single contiguous range of dates, or use a date range filter to exclude dates within the specified range.
Building Expression Filters
Using expression filters, you can define more complex filters using SQL expressions. Expression filters can reference zero or more data elements.
For example, you can create the expression filter "Sample Sales"."Base Facts"."Revenue" < "Sample Sales"."Base Facts"."Target Revenue". After applying the filter, you see the items that didn’t achieve their target revenue.
You build expressions using the Expression Builder. You can drag and drop data elements to the Expression Builder and then choose operators to apply. Expressions are validated for you before you apply them. See About Composing Expressions.
- In the Expression Filter panel, compose an expression.
- In the Label field, give the expression a name.
- Click Validate to check if the syntax is correct.
- When the expression filter is valid, then click Apply. The expression is applied to the visualizations on the canvas.
