| Modifying Charts |
 back
|
1
2
3
4
5
6
7
8
9
|
next back
|
1
2
3
4
5
6
7
8
9
|
next
|
|
|
Charts and chart groups are displayed in the Chart Display
window. In this window, you can click a toolbar button to
select a different chart format, such as pie, bar, strip
(line), or table, or to change the orientation of bar
charts.
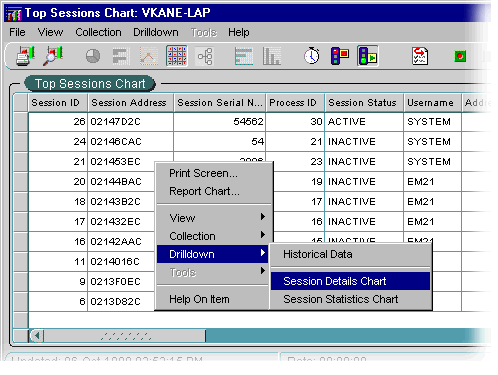
You can also place the cursor above any data point to see its value, and, on some predefined charts, can right-click to drill down to one or more related charts. |

|