Debugging at the Machine-Instruction Level
The debugger provides windows that let you debug your project at the machine-instruction level.
Right-click the Quote_1 project and choose Debug.
In the Output window, type a customer name in response to the prompt.
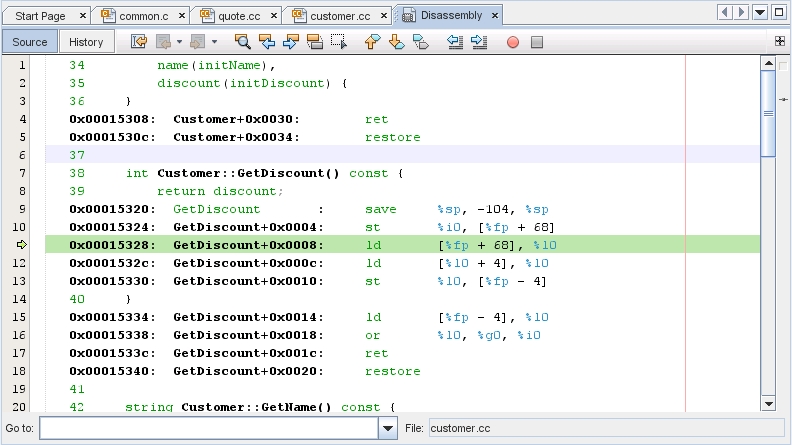
When the program pauses at the breakpoint on the GetDiscount function, choose Window > Debugging > Disassembly to open the Disassembly window as in the Editor window. The green program counter arrow appears on top of the breakpoint icon at the instruction on which the program is paused.

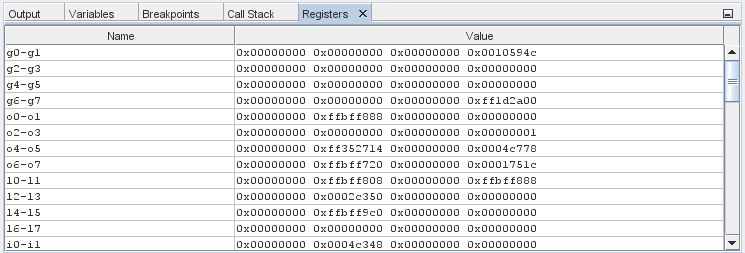
Choose Window > Debugging > Registers to open the Registers window, which displays the contents of the registers.

Choose Window > Debugging > Memory to open the Memory window, which displays the contents of memory currently used by your project At the bottom of the window, you can specify a memory address to browse, change the length of the memory browse, or change the format for memory information.
