Profiling a Project with the Run Monitor Profiling Tools
The Run Monitor profiling information is collected using Oracle Developer Studio performance analysis tools and the underlying operating system. The Run Monitor tools graphically show information and have buttons that you can click for more information about problem areas in your code. This section will set up a profiling demo project, enable the Profile tools in the project's properties, and examine the Run Monitor profiling tools results.
Setting Up the Profiling Project
This tutorial will use the ProfilingDemo sample project. To create this demo:
-
Choose File > New Project (Ctrl+Shift+N).
-
In the New Project wizard, expand the Samples node and select the C/C++ category.
-
Select the Profiling Demo project. Click Next and then click Finish.
To configure the project and enable profiling:
-
Right-click the ProfilingDemo_1 project node in the Projects tab, and select Properties.
-
Select the Build node in the Categories panel, and make sure the Tool Collection is set to Oracle Developer Studio.
-
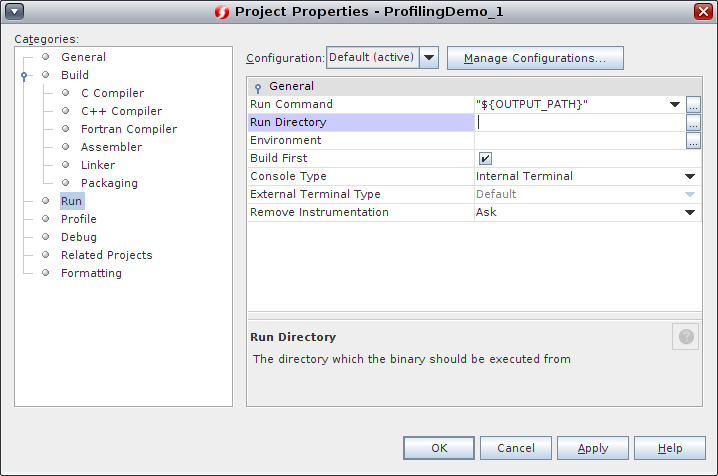
Select the Run node in the Categories panel, and make sure the Console Type is set to Internal Terminal. This enables you to see the program output in the IDE's Output window instead of an external terminal window.
-
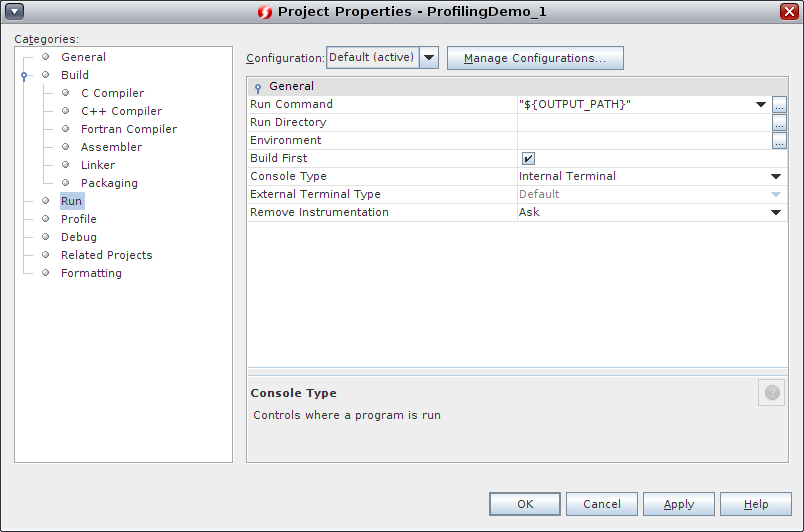
Select the Profile node in the Categories panel. Notice that the Show profiling indicators during run option is checked. You can check this option in any of your projects to show the Run Monitor Tools tab.
-
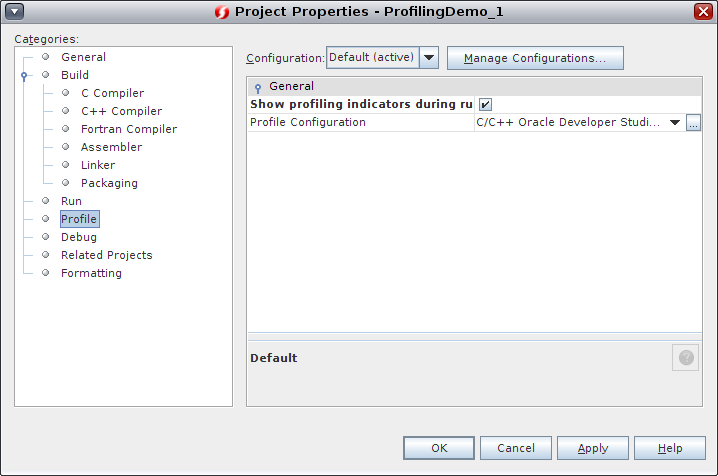
Select C/C++ Oracle Developer Studio Standard in Profile Configuration. Click the ... button next to the Profile Configuration list.
-
Notice the tools selected for the C/C++ Oracle Developer Studio Standard are Thread Usage, Memory Usage, and CPU Usage.
Note - If you select CC++ Simple (indicators only) or C/C++ Simple Oracle Solaris (indicators only), then only the indicators in the Run Monitor window will display. Clicking the details buttons in each indicator window will give the following message: Detailed information is not available in the current profile configuration. To see details, select a different Profile Configuration in your project properties and run the project again. -
Click OK in the Project Properties dialog box.
Building and Running the ProfilingDemo_1 Project
To build and run ProfilingDemo_1:
-
Right click the ProfilingDemo_1 project node and select Build.
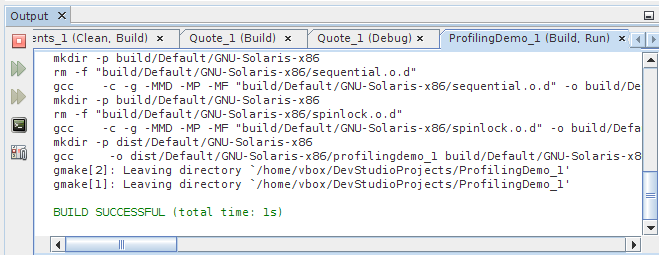
The Output window shows the results of the build.
-
Right-click the ProfilingDemo_1 project node and select Run. The Run Monitor window opens to display indicators with dynamic graphs for CPU Usage, Memory Usage, and Thread Usage.
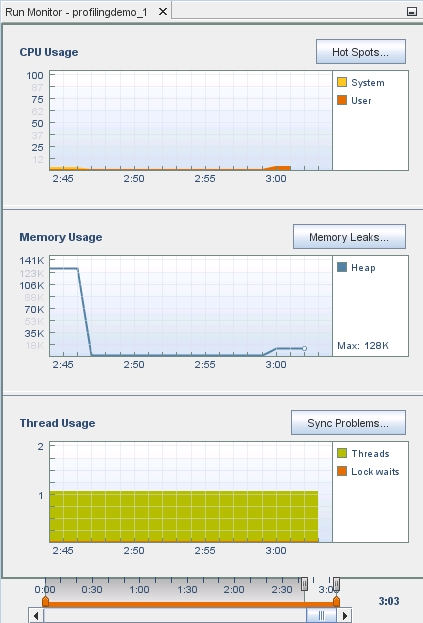
Notice in the Output window, the ProfilingDemo_1 program tells you what it is doing, so you can match it to the data that the IDE is graphically representing in the tools. For example, the program displays how much memory it is allocating, performs calculations, and then frees memory. You can see the graph reflect this activity.
-
Press Enter each time you are requested until the program is finished.
-
Hover your mouse cursor over the indicators to see tooltips explaining what each graph represents. Each indicator includes a button for more detailed information, which will be explored in later sections.
Using the Indicator Controls
At the bottom of the Run Monitor window, there are sliders for controlling your view of the graphs: View slider, Details slider, and Time slider. The controls are also used for filtering data. The following image labels the controls.

-
Place your mouse cursor over the end points of the sliders for information about the sliders.
-
Click and hold the mouse button on the Time slider, the horizontal scroll bar at the bottom. All the graphs slide in unison so you can see CPU, memory, and threads at any given time and to see the relationships between them.
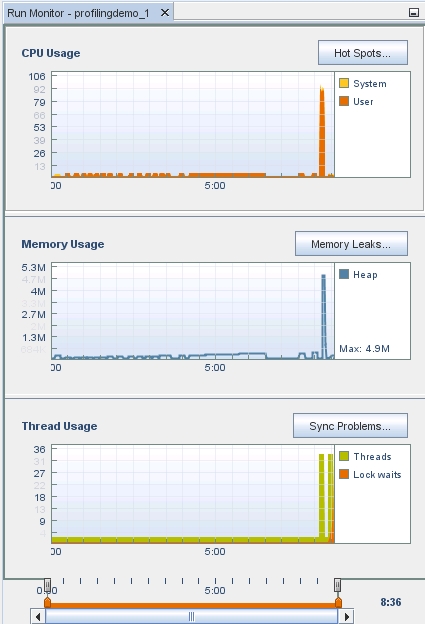
Drag the time slider from left to right to see the complete run.
-
Move your mouse to the view slider, the controls that overlay the time units. The view slider controls the part of the run time displayed in the indicator.
-
Click and drag the handles of the start point of the view slider to the beginning of the run. The indicators show the entire run. The effect is similar to zooming out. Notice that the time scroll bar is maximized when you select the complete run time, since you are already looking at all the data.
-
Drag the view slider's start point to where the PTHREAD_MUTEX_DEMO starts. As you drag the handle, the indicators zoom in to focus on this area. Notice that the scroll bar can again be used to scroll the run time.
-
Place your mouse cursor over the end points of the orange-colored details slider for a description of how to use the slider. The details slider controls enable you to select a portion of the runtime for examining the detailed information.
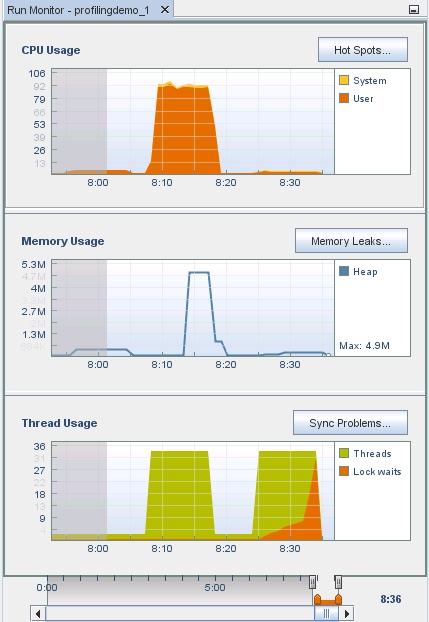
Drag the details slider's start point handle past the view slider's start point. Notice that the indicators grey out the area in from the of the detail slider's start point. This gives a highlighting effect to the graph between the start and end points. When you click an indicator's detail button, the details tab shows the data for the area highlighted.
-
Drag the start point of the details slider back to the beginning so you can see all the data.
Note - You can slide either the starting handle or ending point handle for the view slider and the details slider, so you can view and get details at any time of your run.
Exploring CPU Usage
The CPU Usage graph shows the percentage of the total CPU time used by your application during its run.
-
Click the CPU Usage Hot Spots... button to display details about the CPU Time.
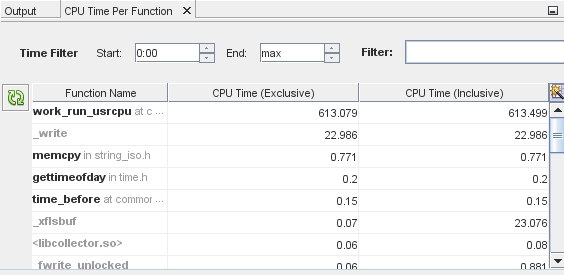
The CPU Time Per Function window opens to display the functions of the program, along with the CPU time used by each function. The functions are listed in order of CPU time used, with the function that used the most time listed first. If the program is still running, the time initially displayed is the time consumed at the moment you clicked the graph.
-
Click the Function Name column head to sort the functions alphabetically.
Notice the difference between the two columns of CPU Time. CPU Time (Inclusive) shows the total CPU time spent form the time the function is entered until the time it is exited, including the time of all other functions that are called by the listed function. CPU Time (Exclusive) shows the time used only by the specific function, not including any functions that it calls.
-
Click the CPU Time (Inclusive) column head to place the most time-consuming functions back at the top.
Notice that in our example, the work_run_usrcpu() function has 613.079 CPU Time (Exclusive) versus a 613.499 CPU Time (Inclusive). This means that a small amount of the CPU time was actually used by other functions that it calls, but the work_run_usrcpu() function itself used most of the time.
-
Some of the functions are listed in bold. You can go to the source file that calls these functions. Double-click the work_run_usrcpu() function.
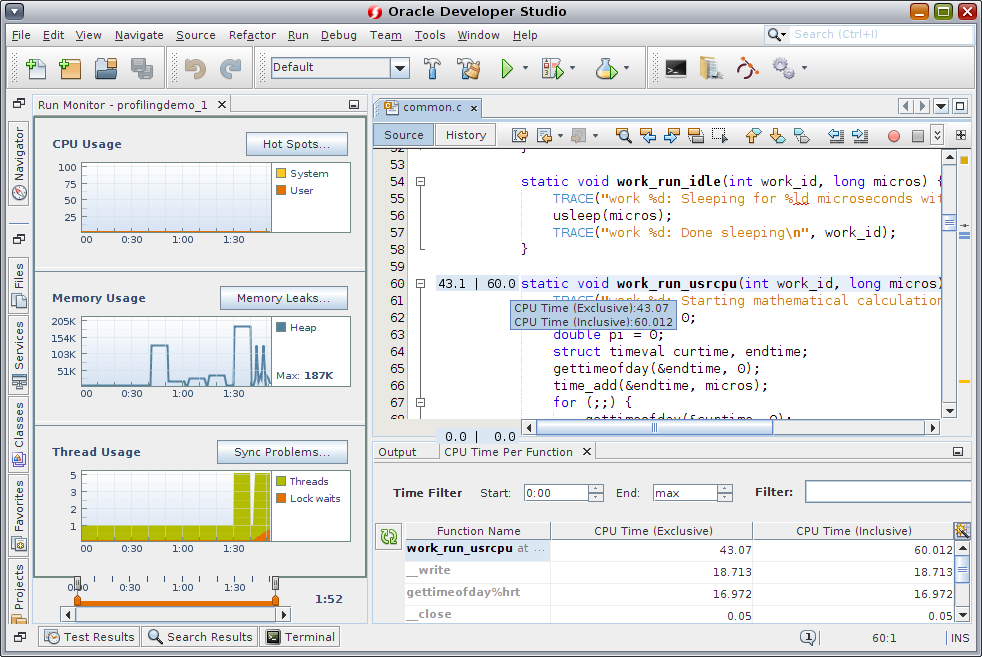
The common.c file opens, with the cursor resting on the work_run_usrcpu() function, line 60. Some numbers are displayed in the left margin for this line.
-
Place your cursor over the numbers in the left margin. The numbers are the same metrics for exclusive and inclusive CPU time for the functions displayed in the CPU Time Per Function window. The metrics are rounded to the nearest tenth, but the unrounded value pops up when you hover the mouse over them. Metrics for CPU-consuming lines such as the for() loop that does calculations within the work_run_usrcpu() function are also shown in the common.c source file.
-
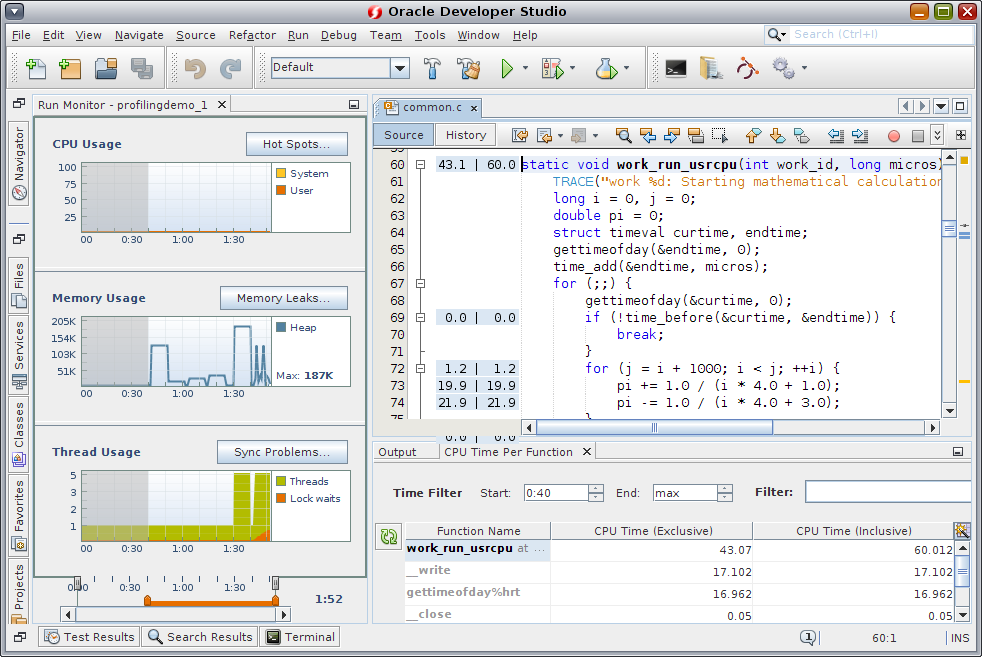
In the CPU Time Per Function window, change the Time Filter start time to 0:40 by either typing the time and pressing Enter, or using the arrows to scroll through the seconds. The graphic indicators change just as they did when you moved the handles on the data filtering control. If you drag the handles, the Time Filter settings in the CPU Time Per Function window are updated to match. More importantly, the data shown for the functions in the table is updated to reflect the filter so only the CPU time used during that time period is shown.
-
You can also filter for data that meet a certain metric. Right-click on the CPU Time (Exclusive) metrics for work_run_usrcpu(). In our example, right-click the 43.07 in the CPU Time Per Function window. Select Show only where > CPU Time (Exclusive) == 43.07. All the rows are filtered away, and only the row whose exclusive CPU time is equal to 43.07 is displayed.
Exploring Memory Usage
The Memory Usage indicator shows how your project's memory heap changes over its runtime. You can use it to identify memory leaks, which are points in your program where memory that is no longer needed fails to be released. Memory leaks can lead to increased memory consumption in your program. If a program with a memory leak runs long enough, it can eventually run out of usable memory.
-
Slide the time slider in the Run Monitor to the left and right to see how the memory heap increases and decreases over time. There should be four spikes that occur in ProfilingDemo_1. The first two occur during the Sequential Demo, the third occurs during the Parallel Demo, and the last occurs during the Pthread Mutex Demo.
-
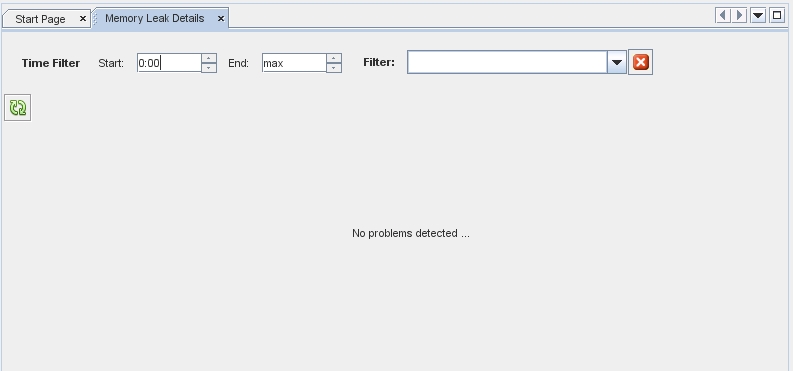
Click the Memory Leaks button to display the Memory Leak Details window. This shows details about which functions exhibit memory leaks. Only functions that are producing memory leaks are listed in the table. If your program is running when you click the button, the leak locations shown are those that exist at the moment you clicked the button. More leaks may occur as time goes on, so you should click the Refresh button. If no memory leaks are detected by the end of the run, the Memory Leak Details tab indicates that no memory leaks were found.
-
You can change the Start and End times to filter the data, or use the orange colored details slider in the Run Monitor window, same as in the Exploring CPU Usage section. There are no memory leaks in this example.
-
Double-click a function and the corresponding file opens at the line where the memory leak occurs in the function. The memory leak metrics are displayed in the left margin in the source editor.
-
Mouse over them to display the details as we did with the CPU Usage metrics.
-
Right-click the metrics in the table to filter the data in the table. This data filtering in the table is possible with all the profiling tools.
Exploring Thread Usage
The Thread Usage indicator shows the number of threads in use by your program, and any moments where a thread has to wait to get a lock in order to proceed with its task. This data is useful for multithreaded applications, which must perform thread synchronization in order to avoid expensive wait times.
-
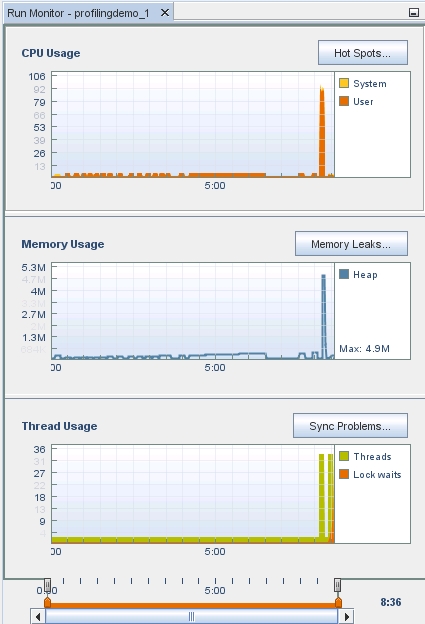
The Thread Usage indicator shows the number of threads running during a project's run time. Slide the time slider back to the beginning and notice the number of threads is 1 until the Parallel Demo starts. In the following image, this is at 8:07, with a jump of 1 to 32 threads.
-
Move the view slider endpoint handle to where the Parallel Demo just starts.

Notice that in the CPU Usage and Memory Usage indicators for the same time period has the single thread performing some activity that uses CPU time and memory. This corresponds to the Sequential Demo portion, in which the main thread writes to a file and then performs some calculations sequentially. CPU and memory usage both decrease when the program waits for the user to press Enter and the number of threads remains at 1.
-
Slide the time slider to the right until you see the two points where the threads increase in number.
The increase in threads at 8:07 corresponds to the Parallel Demo portion of the project running. The main threads starts additional threads to the work of writing to a file and performing calculations in parallel. Notice the increase in memory usage and CPU usage, but the two tasks are completed in much less time.
-
The number of threads returns to 1 after the Parallel Demo threads finish, and the main thread waits for you to press Enter. The thread count increases again as the Pthread Mutex Demo portion of the program runs.
Notice that a lock waits appears, shown in orange, during the Pthread Mutex Demo portion. The Pthread Mutex Demo uses mutual exclusion locks to prevent overlapping access to certain functions by multiple threads, which causes the threads to wait to obtain a lock.
Click the Sync Problems button to display details about thread locks in your project. The Thread Synchronization Details window opens and lists functions that had to wait to obtain a mutex lock. Also displayed are metrics for the number of milliseconds that the function spent waiting and the number of times the function had to wait for a lock. This example had no sync problems.
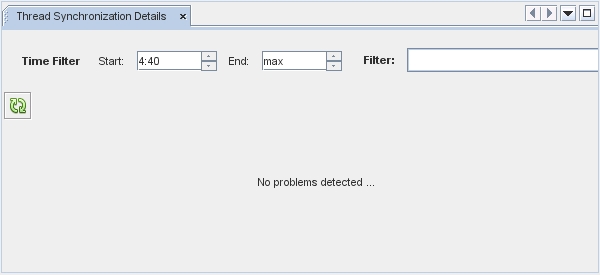
If you click the Sync Problems button while the program is running, you might need to click the refresh button
 to update the display with the latest thread lock
information.
 -
Click the Wait Time column to sort the functions in order of time spent waiting.
-
Click the Lock Waits column to sort the functions by the number of times a thread was waiting in the functions.
-
Double-click a function to open the source file in the editor where the function responsible for locking a memory location. The metrics for Wait Time and Lock Waits are displayed in the left column f the source file. Place your mouse over the metrics to see the details, which matches what is shown in the Thread Synchronization Details window.
-
Right-click on the metrics and deselect Show Profiler Metrics. The metrics are no longer displayed in the source editor for any of the profiling tools. To display the metrics again, choose View in the IDE menu bar and select Show Profiler Metrics.