| Oracle® Retail Demand Forecasting User Guide for the RPAS Fusion Client Release 16.0 E91109-03 |
|

 Previous |
 Next |
| Oracle® Retail Demand Forecasting User Guide for the RPAS Fusion Client Release 16.0 E91109-03 |
|
Previous |
Next |
The Interactive Forecasting task is a forecast simulation tool that allows you to make changes to forecast parameters and see the results without having to wait for the batch run. In this workbook, you can edit various forecast parameters including sales history and forecast method. A new forecast is produced based on the changed parameters. In addition to forecasts, the Interactive Forecasting workbook can also generate fit in historical region and the system picked model if an ES forecast method is used.
Interactive Forecasting assumes that the historical data is contained in the measure posxlxb. All forecasts generated by interactive forecasting are based on this data.
Performance may be improved by utilizing a mask measure. Interactive forecasting uses the measures mask<forecast level>xb; for example mask01xb. Here, <forecast level> corresponds to the forecast level chosen in the wizard when opening the Interactive Forecasting workbook. The mask is a boolean measure. Only cells with the value True are included in the forecast. This is useful when desiring to focus on only a few product/locations.
The Interactive Forecast method is intended to be a quick way to view results produced by different forecast methods. It allows you to gauge, in a qualitative way, the suitability of a particular forecast method for a given set of sales history data. Even though it uses the exact same forecast methods as the full forecast, only the parameters listed previously will affect the results. No other user-input values are used. Users wishing to vary a larger number of parameters are encouraged to use the regular forecast functionality.
|
Note: The Interactive Forecast workbook calls the same Forecast Special expression that the Batch Forecast calls.Interactive Forecast for group levels (example level 13) should be run, only after the corresponding Batch Forecast is run since a required measure is populated during the batch run. |
To build the Interactive Forecasting workbook, perform these steps:
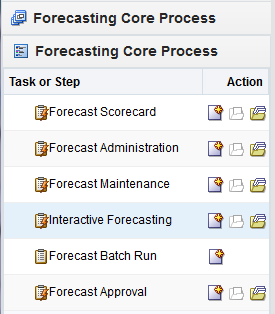
Click the New Workbook icon in the Interactive Forecasting task in the Forecasting Core Process activity.
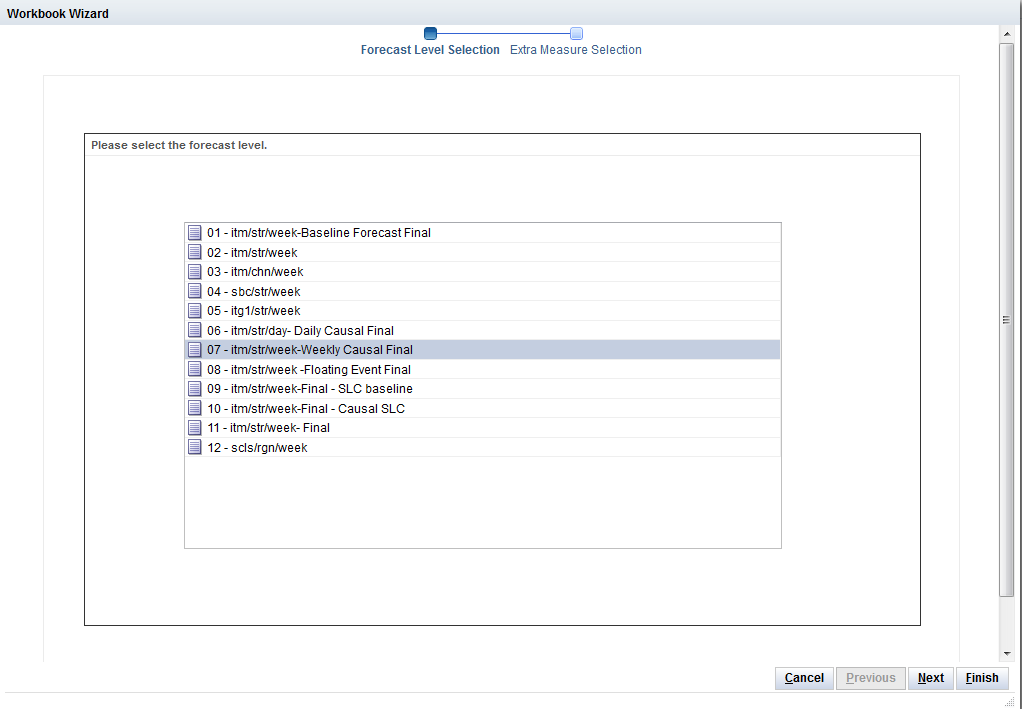
The Workbook wizard opens. Select the forecast level that you want to evaluate and click Next.
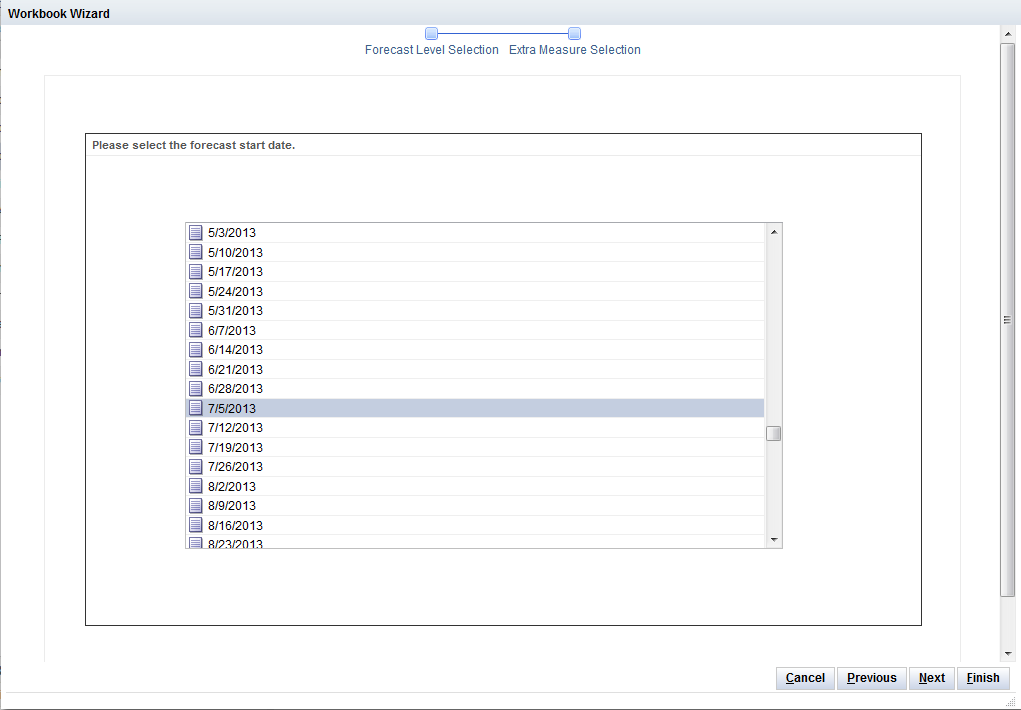
Select the forecast start date you wish to review and click Next:
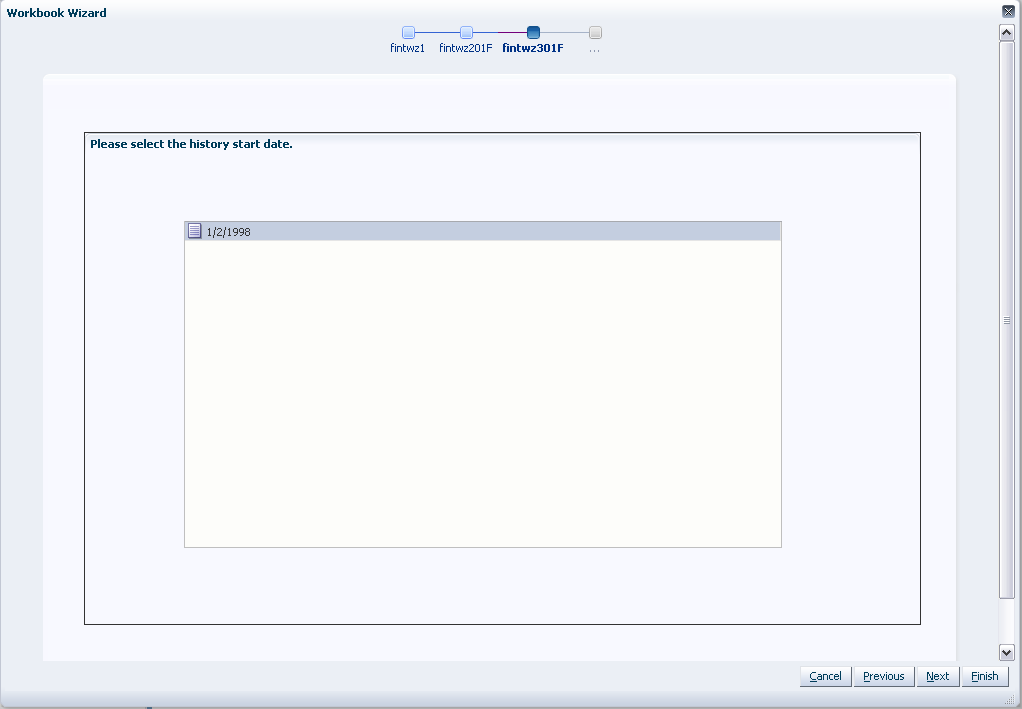
Select the history start date and click Next.
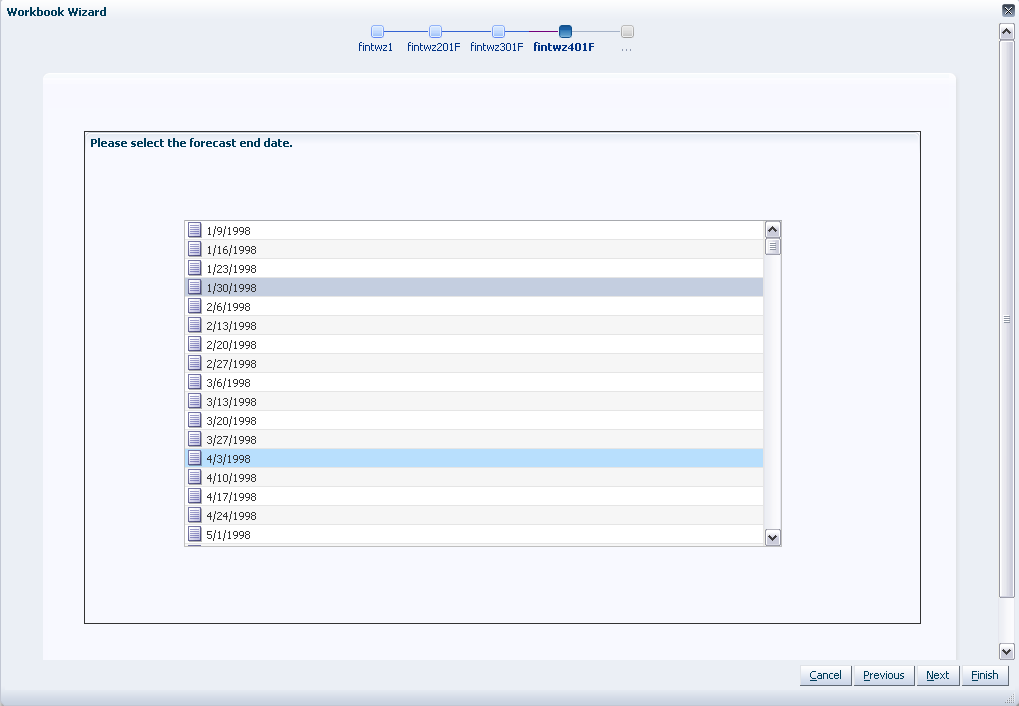
Select the end date for the forecast and click Next.
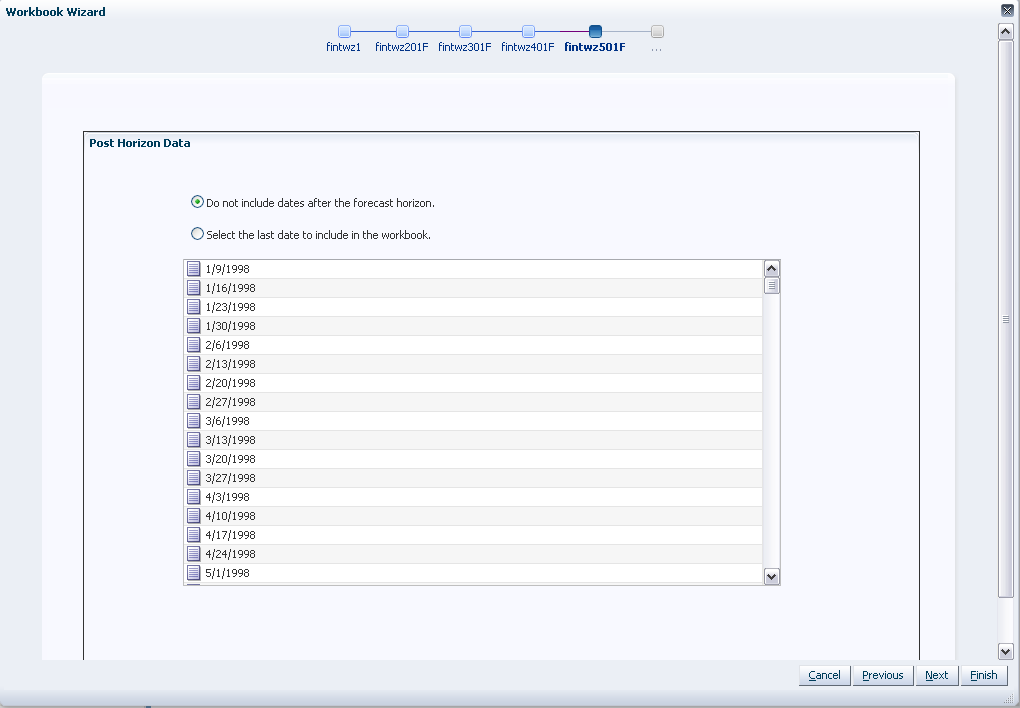
Select the end date for the forecast horizon and click Next.
Choose one of the following options:
Specify future time periods beyond the forecast horizon to include in your workbook.
Select Do not include dates after the horizon if no future dates are to be included in the workbook.
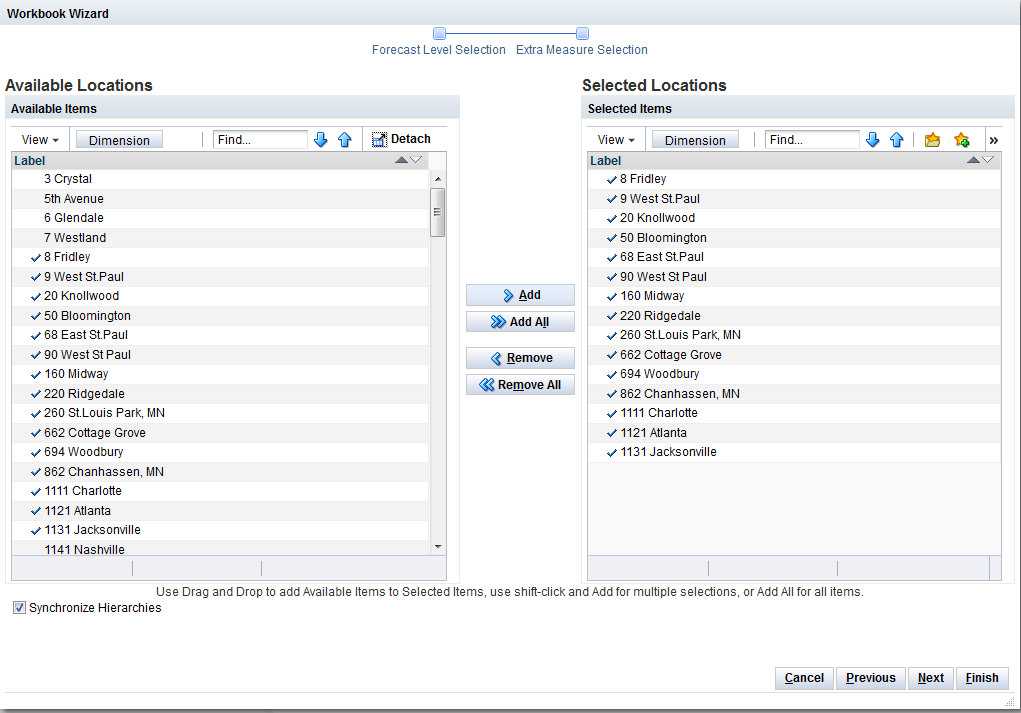
Select the specific locations that you want to view and click Next.
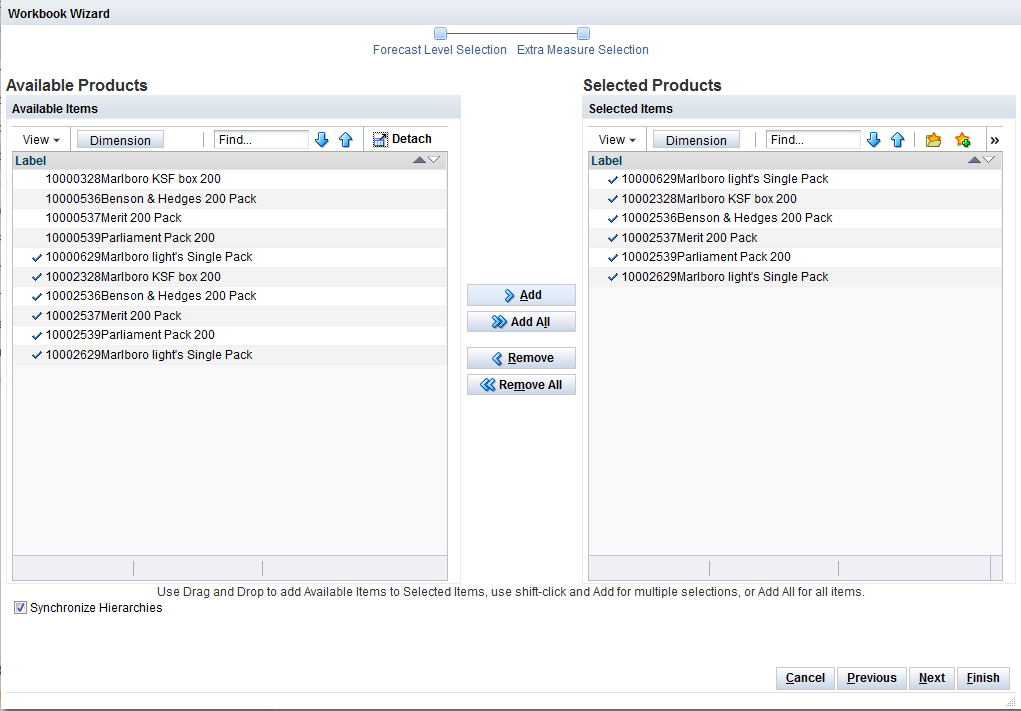
Select the products and click Next.
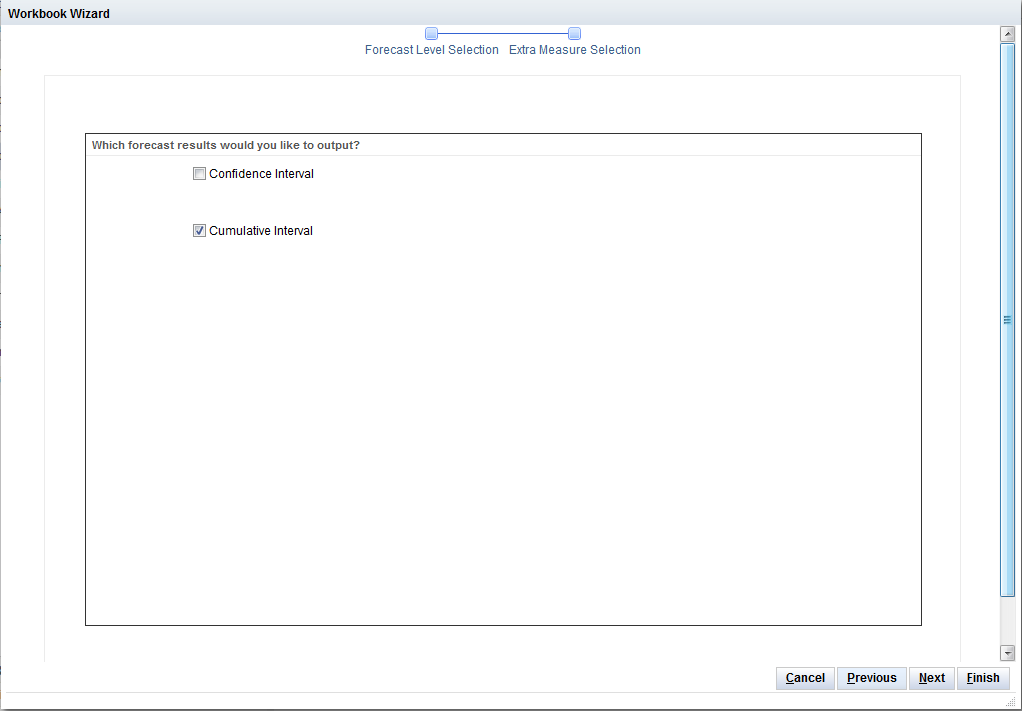
Select the forecast results to view and click Next.
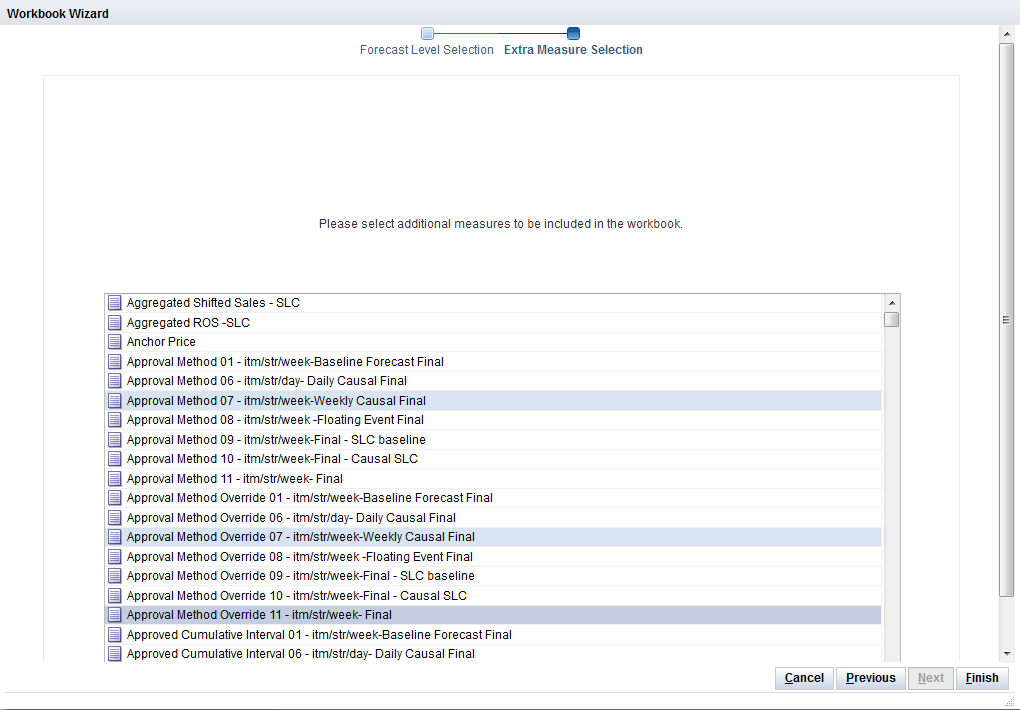
Select any additional measures to include and click Finish.
The Interactive Forecasting workbook is built.
Once the wizard is completed, the forecast is generated based on your selections in the wizard and the Default Forecast Method set for the specified forecast level in the Forecast Administration Workbook.
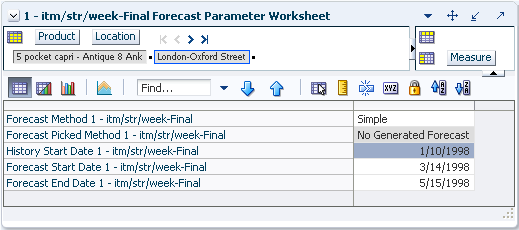
The Forecasting Parameter view is based on the intersection of the Product and Location dimensions for the select forecast level.
The Forecasting Parameter view contains the following measures. Of these measures, all but System picked model are editable. Changes can be made to the editable parameters, that is, History Start Date, Forecast Method, Forecast Start Date, and Forecast End Date, to regenerate a forecast of the time series.
The Forecasting Parameter view contains the following measures:
Forecast Method
A list from which you can select the method used to generate the forecast. The workbook defaults to the method selected in the Forecast Administration Workbook for the specified level if the method is supported by Interactive Forecasting. Otherwise, it defaults to No Forecast.
|
Note: The Forecast Method list does not include Causal, Bayesian, Components, Copy, LoadPlan, or Profile-based forecast methods. |
Forecast Picked Method
This is the method that was used to generate the forecast for the given product/location combination. This field is useful when combined methods are requested (for example, ES methods). Then this field displays the actual method the system picked from the combined methods. In case stand-alone methods are chosen, generally this field is the same as the method chosen in Forecast Administration or Forecast Maintenance. However, if the requested method is unable to produce a good fit, the system defaults to a simpler method, and that method is displayed here.
History Start Date
This is the starting date for historical sales data. For example, if your system start date is January 1, 2003, but you only want to use historical sales data from the beginning of 2011, you need to set your History Start Date to January 1, 2011. Only history after this date is used for generating the forecast. The default is the system start date unless otherwise specified. If sales data is collected weekly, RDF generates forecasts only using data from sales periods after the one containing the history start date.
It is also important to note that the system ignores leading zeros that begin at the history start date. For example, if your history start date is January 1, 2011, and an item/location does not have sales history until February 1, 2011, the system considers the starting point in that item/location's history to be the first data point where there is a non-zero sales value.
Forecast Start Date
This is first date of the forecast horizon. The default is the start date selected in the wizard.
Forecast End Date
This is the last date of the forecast horizon. The default is the end date selected in the wizard.
Interactive Forecasting assumes that the historical data are contained in the measure posxlxb. All forecasts generated by interactive forecasting are based on these data.
Performance may be improved by utilizing a mask measure. Interactive forecasting uses the measures mask<forecast level>xb; for example mask01xb. Here, <forecast level> corresponds to the forecast level chosen in the wizard when opening the Interactive Forecasting workbook. The mask is a boolean measure. Only cells with the value True are included in the forecast. This is useful when desiring to focus on only a few product/locations.
The Interactive Forecast method is intended to be a quick way to view results produced by different forecast methods. It allows the user to gauge, in a qualitative way, the suitability of a particular forecast method for a given set of sales history data. Even though it uses the exact same forecast methods as the full forecast, only the parameters listed previously will affect the results. No other user-input values are used. Users wishing to vary a larger number of parameters are encouraged to use the regular forecast functionality.
Also, the Winters Method has a pre-established minimum history of 104 periods.
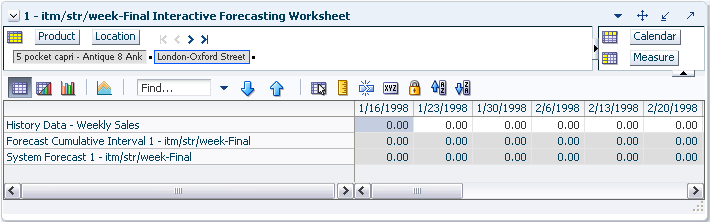
The Interactive Forecasting view is based on the intersection of the Product, Location, and Calendar dimensions for the forecast level selected in the wizard process. The Interactive Forecasting view contains the History Data and the System Forecast. Of these measures, only History Data is editable.
The Interactive Forecasting view contains the following measures:
History Data
This is the historical sales data set in the Forecast Administration Workbook. This field is editable so you can change out-of-character sales if needed. For example, if your battery sales went up during a major power outage, you can lower the sales data back to a more normal level so the unusually high sales adversely affects your forecast. However these changes are for simulation purposes only and cannot be committed.
System Forecast
The quantity that the system predicts is required for the product, location, and calendar combination displayed. Changes to History Data, History Start Date, Forecast Start Date, Forecast End Date, and Forecast Method causes the System Forecast to re-calculate when Calculate is selected from the toolbar.