| Oracle® Retail Back Office User Guide Release 14.1 E54470-01 |
|


 Previous |
 Next |
The Reports tab enables you to view, export, and print reports. The reports provide summaries of store activity and performance. The report output can be tailored based on ad hoc report settings. Reports viewed frequently can be added to a list of Favorite Reports. Favorite reports can be scheduled on a repeating basis.
For more information, see the following sections:
From the Reports tab, you can access summary reports on the status of sales and financial data collected through Oracle Retail Point-of-Service.
The Transaction Post Processor is a task available under the Data Management tab. It takes the transactions coming in through the POSLog and summarizes the transaction data so that the data can be used for reports. The task should be run on a repeating basis so that the latest available transaction data in the POSLog is included. For information on running the Transaction Post Processor, see "Importing Data" in Chapter 7.
Under the Reports tab, a report is accessed by choosing the appropriate subtab and left navigation link. Table 3-1 lists the available reports. For a description of each report, see "Descriptions of Available Reports".
The action buttons in a report screen provide you with a variety of options specific to that screen. Table 3-2 lists the action buttons and describes what they do.
Table 3-2 Report Buttons
| Button | Function |
|---|---|
|
Add |
Adds a report schedule. |
|
Add to Favorites |
Adds a report to My Favorite Reports. |
|
Adhoc |
Enables you to select criteria for viewing a report. |
|
Done |
When viewing an ad hoc report, returns you to the displayed report screen where the Adhoc button was selected. |
|
Export |
Exports a report to an external file. |
|
|
Prints a report. |
|
Remove |
Removes a favorite report. |
|
Save |
Saves a report schedule definition. |
|
Schedule Report(s) |
Adds reports to a report schedule. |
|
View |
Displays a report based on the ad hoc report settings selected. |
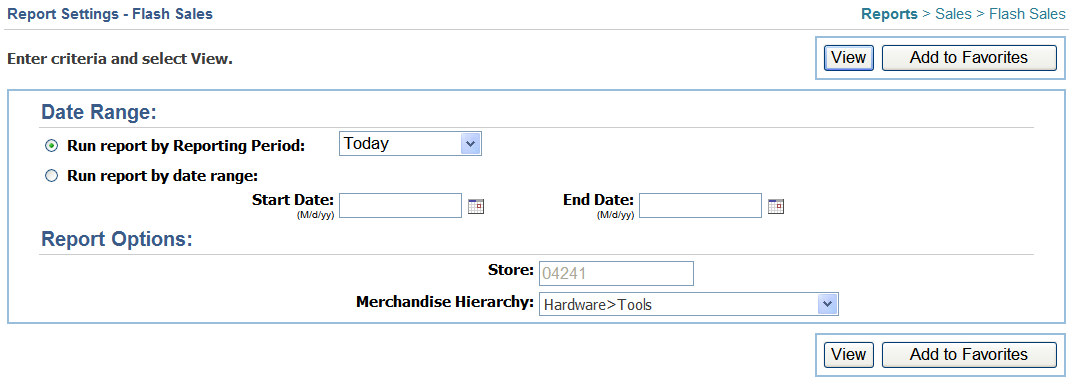
The Report Settings screen is used to tailor the report content. The start and end dates covered by the report and the report information that is included can be chosen.
The start and end dates for the report are chosen by selecting a reporting period or entering start and end dates. The following reporting periods can be selected from a menu:
Today
Week to Date
Month to Date
Year to Date
Previous Day
Previous Week
Previous Month
Previous Year
Report information sets which data is included in the ad hoc report. A store number can be entered and other options can be selected from menus. Each report with ad hoc capability has a subset of the following options enabled for selection:
Store
Merchandise Hierarchy
Cashier
Register
Time Increment
A report information option may include the selection of All and None. None selects a summary of the data. For example, if you select All for Register, one row of data for each register is displayed in the report. If you select None, only one row is displayed with the data totalled for all registers.
For an example of a report settings screen, see "Viewing a Report". To see the list of settings available for each report, see "Descriptions of Available Reports".
If you select a hyperlink within the report data, the drill down report is displayed with data for the selected hyperlink. For example, in a report that shows the store, you can drill down to see data for a specific merchandise hierarchy group. In most instances, the columns do not change when the drill down report is displayed. Drill down reports do not have the ad hoc capability.
Unavailable data in a report is handled in the following ways:
If no data is available for a report, "No Data Available" is displayed.
If specific data in a report is not available, dashes are displayed.
The header portion of a report contains the following information:
Title of the report
The business start and end dates covered by the report or the current date for those reports which cover only the current business day
The system date and time when the report was generated
Additional information is also included in the report when applicable:
Store number, register number, and till number
Name of the cashier responsible for the data covered in the report
Report settings selected
You can view, export, and print reports. You can also save reports as favorite reports.
You can view any of the reports listed under the Reports tab. You can also select criteria for the report content.
To view a report:
Click the Reports tab.
Click the subtab of the report category you want to view.
Click a specific left navigation link to display that report.
To see data for a different reporting period, select a report period from the menu.
To select criteria for the report content, click Adhoc. The Report Settings screen is displayed.
Changes to criteria can be made by entering new information into the fields or choosing different options from the menus.
To display the ad hoc report, click View.
To add the report to your favorites, click Add to Favorites. The report is added to the My Favorite Reports list. See "Viewing Favorite Reports".
When you are done viewing the report, click Done.
The Export Report screen is used to export a displayed report. Exporting a report creates a new external file of the report that can be viewed outside of Oracle Retail Back Office.
To export a report:
Click Export. The Export Report screen is displayed.
Change the name of the exported file.
Select an output format from the menu. Table 3-3 describes the available formats.
| Format Type | Definition |
|---|---|
|
HTML |
A file with HTML tags that can be viewed as a web page. |
|
|
Portable Document Format, a read-only file that can be read using Adobe Reader. |
|
RTF |
Rich text format, viewable in an application such as Microsoft Word. |
|
XLS |
Tabular format file that can be read using Microsoft Excel. Note: This exported file is not created in Microsoft Excel binary format, but in HTML format. |
To export the report, click Save. When you are done exporting the report, click Done.
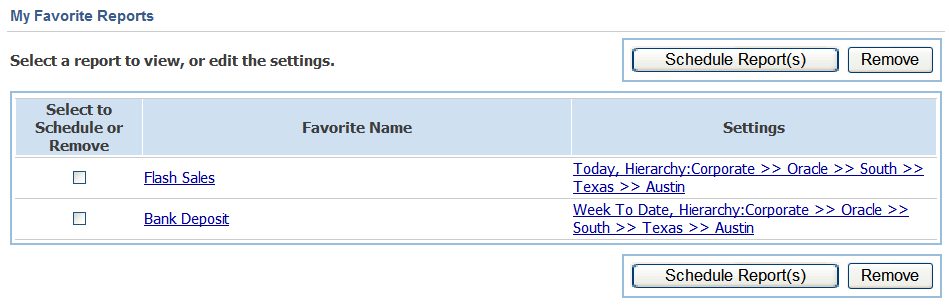
Reports can be saved for easy access. These reports are saved under My Favorite Reports. The list of favorites is created by choosing the Add to Favorites button when viewing a report. You can schedule or view favorite reports, or remove the reports from the favorites list.
On the My Favorite Reports screen, you can view your favorite reports:
Click the Reports main tab.
Click the My Favorite Reports subtab. The My Favorite Reports screen is displayed.
Table 3-4 describes the information shown for each favorite report.
Table 3-4 My Favorite Reports Columns
| Column | Description |
|---|---|
|
Select to Schedule or Remove |
A selected checked box indicates the report is selected to be added to a report schedule or removed from this list. |
|
Favorite Name |
Name assigned to the report. |
|
Settings |
Report period and hierarchy chosen for the report. |
To display a report, click the link for the report in the Favorite Name column.
To add a report to a schedule, select the check box in the Select to Schedule or Remove column and click Schedule Report(s). The Report Schedule Definition screen is displayed. See "Report Schedules".
On the Favorite Report screen, you can edit the settings for a favorite report. To edit the report settings:
Click the My Favorite Reports subtab.
Click the settings link across from the report name. The Favorite Report screen is displayed.
You can change the name of the favorite report and the date range. When you have made your changes, click Save.
On the My Favorite Reports screen, you can remove any of the reports. To remove reports:
Click the My Favorite Reports subtab.
Select the check boxes in the Select to Schedule or Remove column next to the reports to remove.
Click Remove. The reports are removed from the schedule.
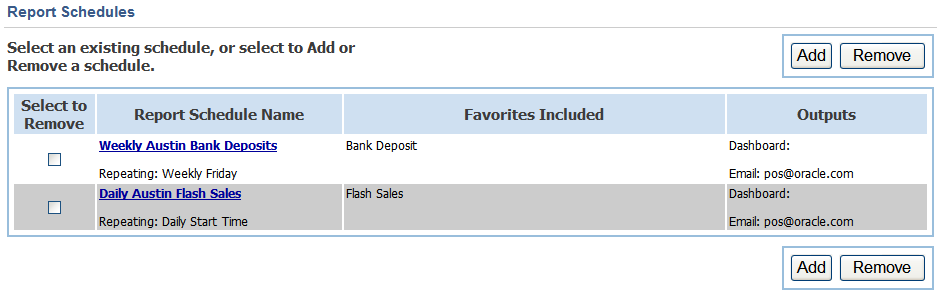
The Report Schedules screen displays a list of the define report schedules and enables you to add and remove report schedules.
A report schedule is used to execute favorite reports on a repeating basis. A report must be defined as a favorite report before it can be added to a report schedule.
To work with scheduled reports:
Click the Report Schedules subtab. The Report Schedules screen is displayed.
Table 3-5 Report Schedules Columns
| Column | Description |
|---|---|
|
Select to Schedule or Remove |
A selected checked box indicates the report schedule has been selected to be scheduled or removed. |
|
Report Schedule Name |
The name of the report schedule and the run date and time. |
|
Favorites Included |
List of favorite reports included in the report schedule. |
|
Outputs |
List of recipients and the type of output received when the report schedule executes. |
To edit an existing report schedule, click the name of the report schedule. The Report Schedule Definition screen is displayed. See "Defining the Report Schedule".
To add a new report schedule, click Add. The Report Schedule Definition screen is displayed. See "Defining the Report Schedule".
To remove a report schedule, select the check box for the Report Schedule in the Select to Remove column. Click Remove.
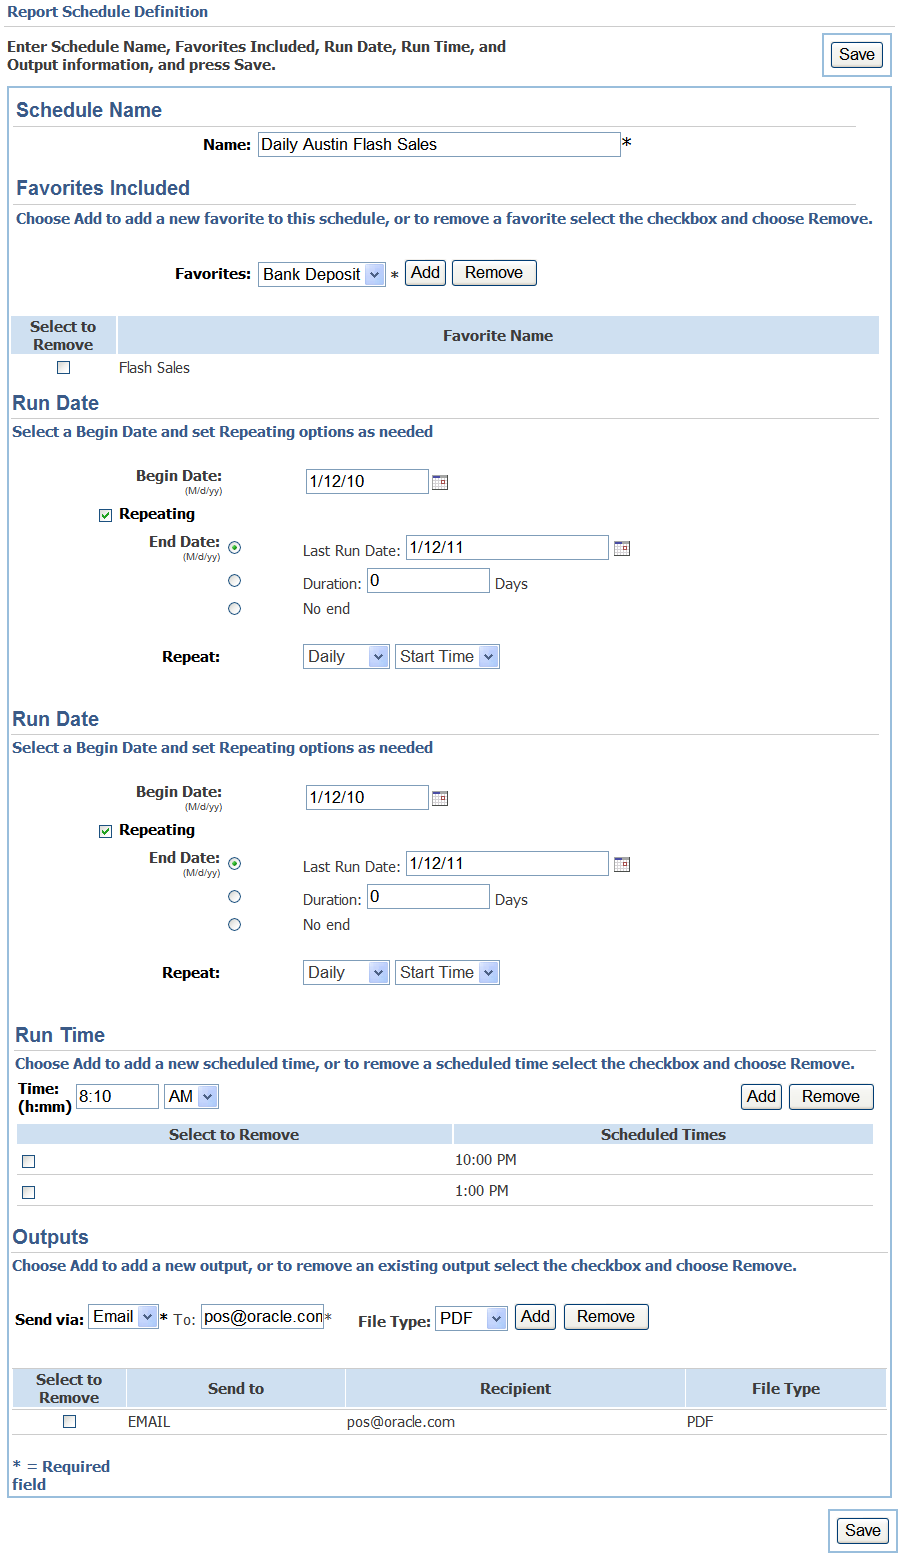
On the Report Schedule Definition screen, you select the settings for a report schedule.
To set the report schedule:
Enter the schedule name.
To add a new favorite report to the schedule, select a report from the Favorites menu and click Add. To remove a report from the schedule, select the check box in the Select to Remove column and click Remove.
Choose the run date and time.
Enter the begin date.
If you want to run the report on a repeating basis, click Repeating. Choose the end date and how often you want the report to be executed.
Enter the run time. If you choose the report to be executed daily at an interval, enter the interval. For example, to execute the report every 30 minutes, enter 00:30. Otherwise, enter a time between 00:00 and 23:59 when you want the report to run. Click Add. The time is added to the list. Multiple times can be chosen. If you want to remove a time from the list, select the check box in the Select to Remove column for the time and click Remove.
To send reports to an e-mail account, choose Email from the menu. Enter the e-mail address and choose the file type. Click Add.
Click Save. The report schedule is saved.
On the Report Schedules screen, you can remove any of the report schedules. To remove report schedules:
Click the Report Schedules subtab. The Report Schedules screen is displayed. See "Report Schedules".
Select the check boxes in the Select to Remove column next to the report schedules you wish to remove.
To remove the selected schedules, click Remove.
These following types of reports are available through the Reports tab:
Sales reports present data on store sales. To access the reports, select the Sales subtab. The following reports are available by selecting a left navigation link:
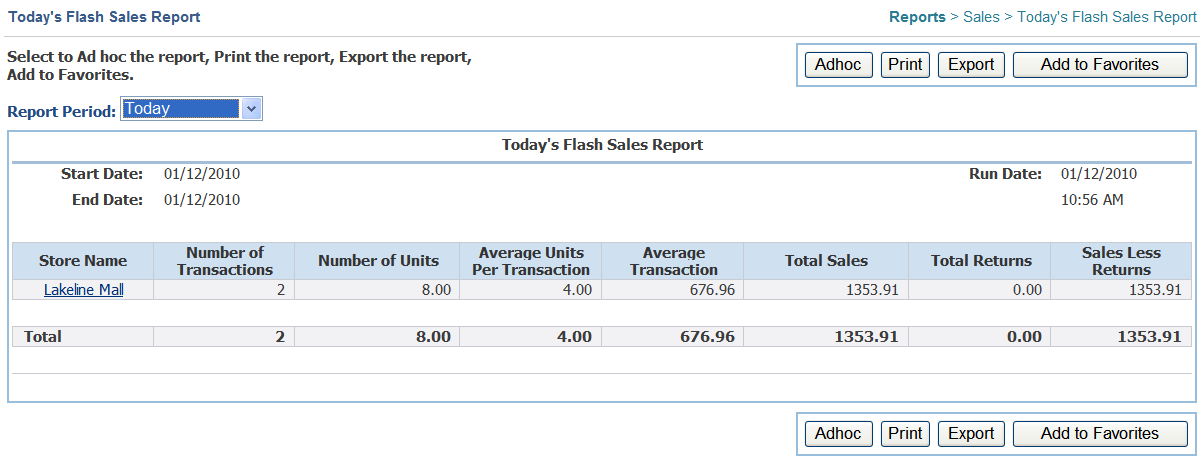
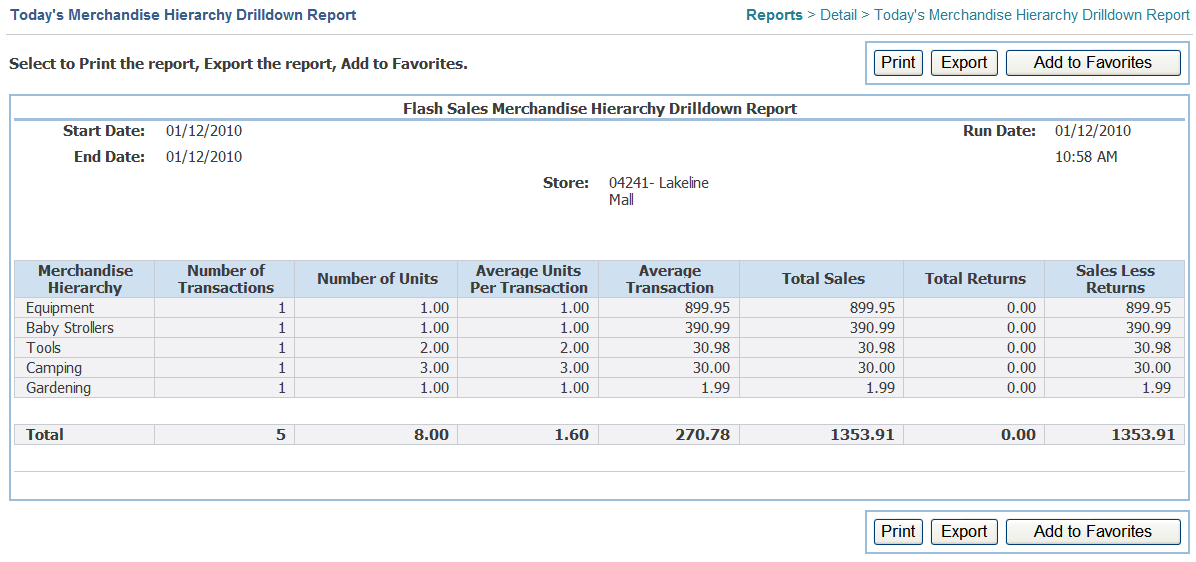
The Flash Sales report displays information regarding store sales performance.
Table 3-6 describes the columns in flash sales reports.
Table 3-6 Flash Sales Report Columns
| Column | Description |
|---|---|
|
Store Name |
Identifier of the store whose flash sales are shown. |
|
Merchandise Hierarchy |
Level in the merchandise hierarchy whose flash sales are shown. |
|
Number of Transactions |
Total of the sales transactions sold plus the picked up layaway transactions plus the completed order transactions minus any post-void transactions. |
|
Number of Units |
Total of the sale units sold plus the picked up layaway units plus the completed order units minus any post-void units. |
|
Average Units Per Transaction |
Number of Units divided by the Number of Transactions. |
|
Average Transaction |
Total Sales divided by the Number of Transactions. |
|
Total Sales |
Total of the taxable sales plus the non-taxable sales. Taxable Sales equals the total of taxable items sold minus voids (tax not included). Includes the extended price of the item when a layaway or order is picked up. Non-taxable Sales equals the nontaxable items sold minus voids. Includes the extended price of the item when a layaway or order is picked up. |
|
Total Returns |
Total of the non-taxable returns plus the taxable returns minus tax. |
|
Sales Less Returns |
Total Sales minus Total Returns. |
Non-merchandise items, gift card sales, and gift card reloads are not included in the reports. Sales are reflected at the kit component level.
The order of the rows in any of the Flash Sales reports is based on the Sales Less Returns column. The entries are listed in descending order starting with the highest amount. For example, if the report shows the merchandise hierarchy, the list starts with the merchandise hierarchy group with the highest sales less returns amount. This makes it easy to identify the groups producing the most sales.
The following ad hoc criteria is available for this report:
Reporting period or date range
Store
Merchandise hierarchy (All, None, or merchandise hierarchy level)
Selecting a store name link in the Flash Sales report displays the specific sales performance for the merchandise hierarchy groups with sales activity for that store.
For a description of the columns in this report, see Table 3-6.
The Sales Summary by Register report shows a summary of store sales by register for the current store. Register sales are based on gross sales and do not include sales tax.
Table 3-7 describes the columns in this report.
Table 3-7 Sales Summary by Register Report Columns
| Column | Description |
|---|---|
|
Register |
Register whose sales are shown. |
|
Number of Transactions |
Total of the sales transactions sold plus the picked up layaway transactions plus the completed order transactions minus any post-void transactions. |
|
Number of Units |
Total of the sale units sold plus the picked up layaway units plus the completed order units minus any post-void units. |
|
Average Units Per Transaction |
Number of Units divided by the Number of Transactions. |
|
Average Transaction |
Total Sales divided by the Number of Transactions. |
|
Total Sales |
Total of the taxable sales plus the non-taxable sales. Taxable Sales equals the total of taxable items sold minus voids (tax not included). Includes the extended price of the item when a layaway or order is picked up. Non-taxable Sales equals the nontaxable items sold minus voids. Includes the extended price of the item when a layaway or order is picked up. |
|
Total Returns |
Total of the non-taxable returns plus the taxable returns minus tax. |
|
Sales Less Returns |
Total Sales minus Total Returns. |
Non-merchandise items, gift card sales, and gift card reloads are not included in the reports. Sales are reflected at the kit component level.
The order of the rows in any of the Flash Sales reports and the Sales Summary by Register report is based on the Sales Less Returns column. The entries are listed in descending order starting with the highest amount.
The following ad hoc criteria is available for this report:
Reporting period or date range
Store
Register (All or register number)
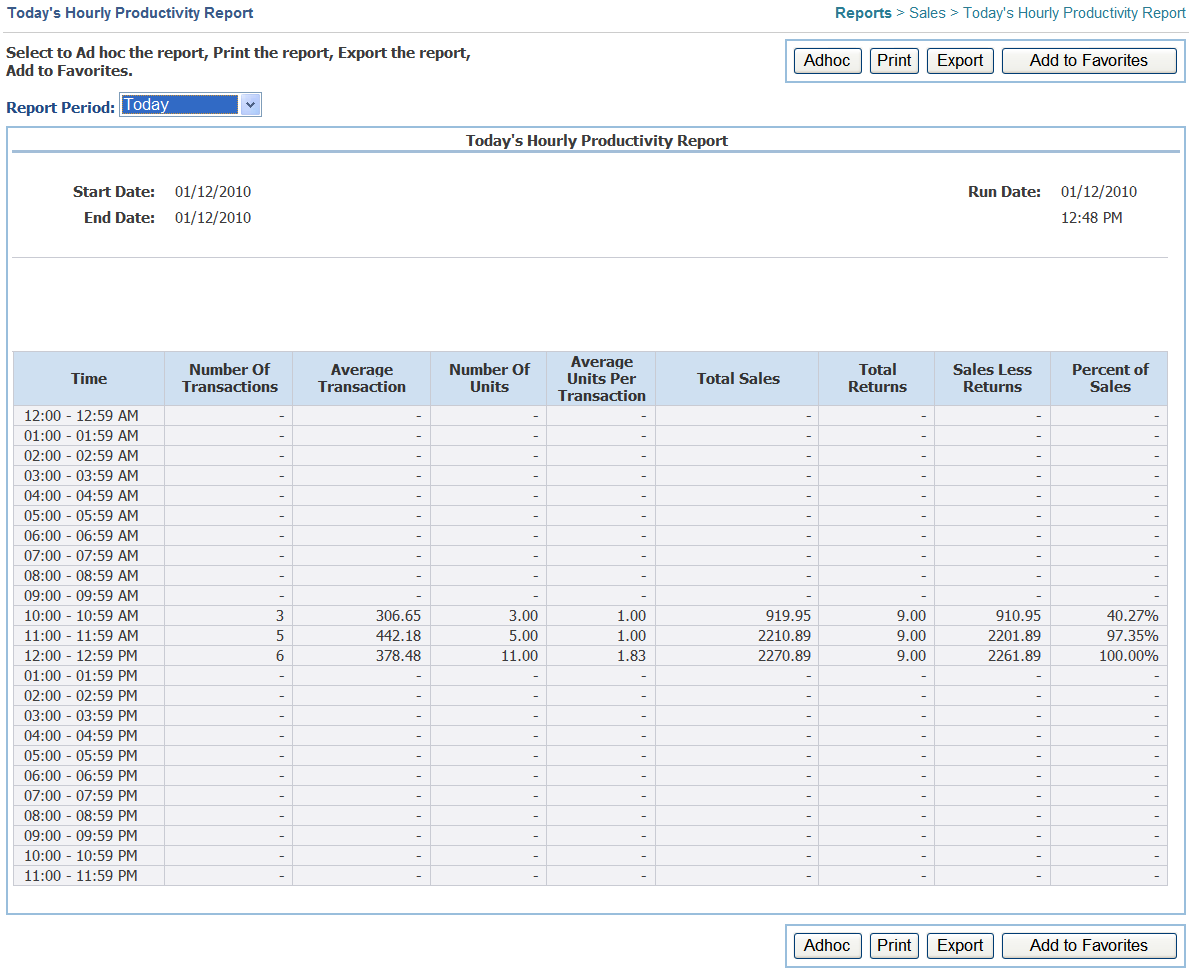
The Hourly Productivity report shows flash sales broken down by time increments, such as hours. Each row, or time increment, shows the cumulative total of each column since the start of the reporting period. To calculate the sale's performance for a specific time increment such as an hour, you need to manually subtract the hour's sales information from the next hour's sales information.
Table 3-8 describes the columns in this report.
Table 3-8 Hourly Productivity Report Columns
| Column | Description |
|---|---|
|
Time |
Time period for which sales are shown. |
|
Number of Transactions |
Total of the sales transactions sold plus the picked up layaway transactions plus the completed order transactions minus any post-void transactions. |
|
Number of Units |
Total of the sale units sold plus the picked up layaway units plus the completed order units minus any post-void units. |
|
Average Units Per Transaction |
Number of Units divided by the Number of Transactions. |
|
Average Transaction |
Total Sales divided by the Number of Transactions. |
|
Total Sales |
Total of the taxable sales plus the non-taxable sales. Taxable Sales equals the total of taxable items sold minus voids (tax not included). Includes the extended price of the item when a layaway or order is picked up. Non-taxable Sales equals the nontaxable items sold minus voids. Includes the extended price of the item when a layaway or order is picked up. |
|
Total Returns |
Total of the non-taxable returns plus the taxable returns minus tax. |
|
Sales Less Returns |
Total Sales minus Total Returns. |
|
Percent of Sales |
Sales less Returns for the time period divided by total Sales Less Returns for the business day. |
Non-merchandise items, gift card sales, and gift card reloads are not included in the reports. Sales are reflected at the kit component level.
|
Note: The default report displays every hour increment of the calendar day from 12:00 AM to 11:59 PM for all cashiers and all registers. Whenever a retailer has business hours other than the default 12:00 AM to 11:59 PM, the ad hoc report should be used. |
The following ad hoc criteria is available for this report:
Reporting period or date range (Year to Date and Previous Year are not available for this report)
Store
Time increment of 15, 30, or 60 minutes
Register (All or register number)
Cashier (All or cashier name)
If you select a reporting period other than Today, the time increments reflect productivity across the selected reporting period. For example, if you select the Month to Date reporting period, sales information for the month up through the current date is displayed broken out by the time increment. This enables you to identify special characteristics about the sales time periods across the reporting period.
Financial reports cover financial information. To access the reports, select the Financial subtab. The following reports are available by selecting a left navigation link:
Throughout the course of a day, a retailer may need to deposit funds in a bank in order to reduce the amount of cash kept in the store. To track these deposits quickly and easily, the Bank Deposit Report is used.
The information about a deposit is entered in Back Office. The order of the deposits shown in the report is based on the creation date and time and starts with the most recent deposit for a given time period.
Table 3-9 describes the columns in the report.
Table 3-9 Bank Deposit Report Columns
| Column | Description |
|---|---|
|
Creation Date |
The date on which the deposit was made. |
|
Creation Time |
The time the deposit was made. |
|
Cashier |
The first and last name of the cashier who made the deposit. |
|
Deposit Amount |
The total amount of the deposit for the tender type.
|
|
Total Deposit Amount |
The sum of all the deposit amounts. |
|
Bank |
The name of the bank where the deposit was made. |
|
Deposit Number |
The number assigned by the bank for this deposit. |
The following ad hoc criteria is available for this report:
Reporting period or date range
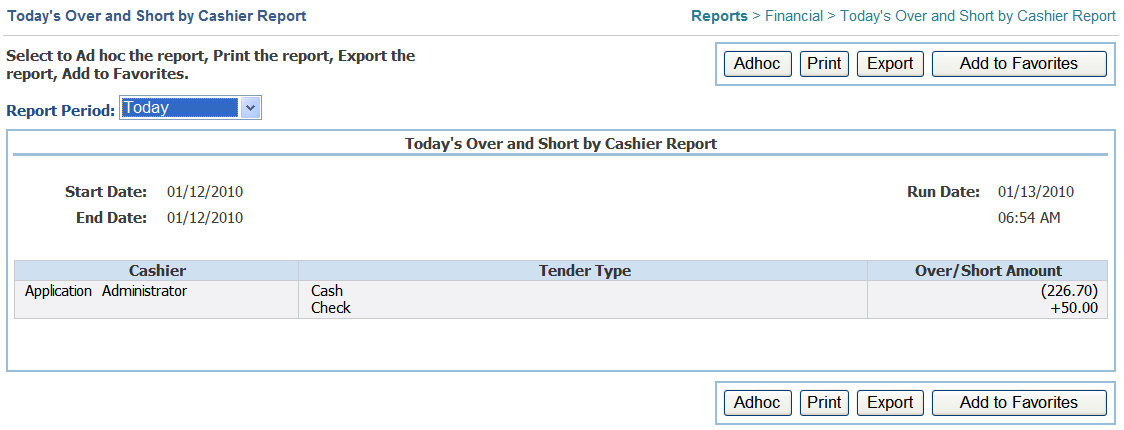
The Over and Short by Cashier Report is a record of reconciliations which resulted in a tender count over or under the expected amount. The main purpose for the report is to detect fraudulent behavior.
This report is useful for retailers who have a business practice of cashier responsibility. In some stores, a cashier is assigned a till with a certain amount of money. The till must have an appropriate amount of money in it at the end of the cashier's shift. This report enables the retailer to view the exact amounts the cashier is over or short on the assigned till for a given time period.
This list of cashiers shown in the report is listed alphabetically by name.
|
Note: The Accountability parameter in the Point-of-Service Reconciliation parameter group must be set to "Cashier". Otherwise, this report displays the "No Data Available" message. |
Table 3-10 describes the columns in the report.
Table 3-10 Over and Short by Cashier Report Columns
| Column | Description |
|---|---|
|
Cashier |
The first and last name of the cashier who was responsible for the count. |
|
Tender Type |
The type of tender in the register. The tenders are displayed in the same order as defined in the Tenders to Count at Till Reconcile parameter. See the Oracle Retail POS Suite Configuration Guide for information on parameters. |
|
Over/Short Amount |
The amount the register is over or short. If the amount is over, a plus sign (+) is displayed next to the value. If the amount is under, the amount is enclosed in parentheses. |
The following ad hoc criteria is available for this report:
Reporting period or date range
Store
Cashier (All or cashier name)
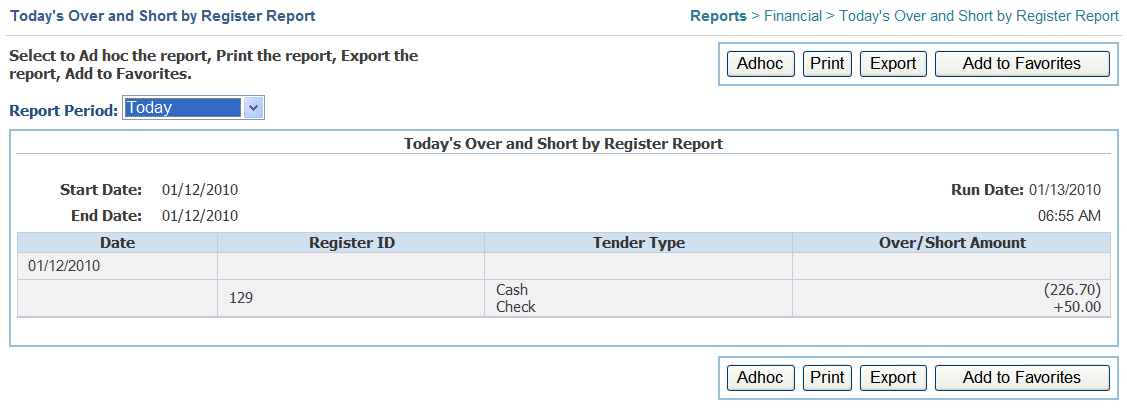
The Over and Short by Register Report is a record of the reconciliation for a register.
The report provides a set of data that can be compared with the expected tender amount in the Point-of-Service. Typically, this report works in conjunction with the Over and Short by Cashier Report. If the retailer sees a persistent inconsistency in the Over and Short by Register Report, the retailer can access the Over and Short by Cashier Report and compare the register and the cashier who have worked on that register. The main purpose of this report is to detect fraudulent behavior.
This report is useful for retailers who have a business practice of register accountability. In some stores, several different employees may use the same register. The Over and Short by register report enables the retailer to view the exact amounts any registers are over or short for a given time period.
Registers are displayed in the report whether the registers are open or closed. The registers are listed in order by register ID.
|
Note: The Accountability parameter in the Point-of-Service Reconciliation parameter group must be set to "Register". Otherwise, this report displays the "No Data Available" message. |
Table 3-11 describes the columns in the report.
Table 3-11 Over and Short by Register Report Columns
| Column | Description |
|---|---|
|
Date |
The date on which the over or short occurred. |
|
Register ID |
The identifier of the register where the over or short occurred. |
|
Tender Type |
The type of tender in the register. The tenders are displayed in the same order as defined in the Tenders to Count at Till Reconcile parameter. See the Oracle Retail POS Suite Configuration Guide for information on parameters. |
|
Over/Short Amount |
The amount the register is over or short. If the amount is over, a plus sign (+) is displayed next to the value. If the amount is under, the amount is enclosed in parentheses. |
The following ad hoc criteria is available for this report:
Reporting period or date range
Store
Register (All or register number)
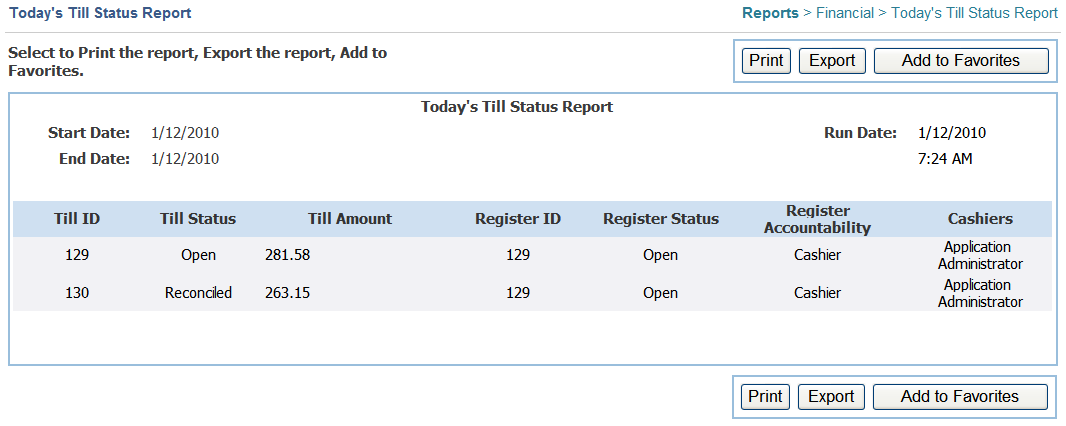
The Till Status report provides information on the status of the Point-of-Service tills. This report can only be displayed for the current business day.
Viewing the status of tills helps the retailer to keep the appropriate amount of cash in the tills. Retailers generally define a specific amount of cash that should be in the till at all times during the business day. Having the correct amount of cash in the till is important for reducing risk and performing transactions quickly. If too much cash is in the till for an extended period of time, the retailer may be susceptible to loss via theft or fraud. If there is not enough cash in the till, completing transactions in a timely manner can be affected.
The tills are listed in order by till ID.
Table 3-12 describes the columns in the report.
Table 3-12 Till Status Report Columns
| Column | Description |
|---|---|
|
Till ID |
The identifier of the till. |
|
Till Status |
The status can be open, closed, reconciled, or suspended. |
|
Till Amount |
The till amount is calculated by taking the current amount of cash in the till and subtracting the float amount defined at the time the report was run. |
|
Register ID |
The identifier of the register where the till was assigned. |
|
Register Status |
The status can be open, closed, or suspended. |
|
Register Accountability |
Accountability is either register or cashier. Cashier means only one cashier can be assigned to a till. Register means one or more cashiers can be assigned to a till. |
|
Cashiers |
The cashiers who were assigned to the till. |
Exceptions reports provide information on transactions not covered by the sales reports. To access the reports, select the Exceptions subtab. The following reports are available by selecting a left navigation link:
The Suspended Transactions report provides a record of suspended transactions. A cashier may want to suspend a transaction, for example, if a customer has started to check-out, but forgot an item and needs to step away for a moment to obtain it. Suspending the transaction enables the cashier to keep a record of the items already entered, but then begin the transaction for the next customer.
The report is sorted sequentially in descending order by Register, Till, and then Cashier.
Table 3-13 describes the columns in the report.
Table 3-13 Suspended Transactions Report Columns
| Column | Description |
|---|---|
|
Cashier |
The cashier who suspended the transaction. |
|
Register |
The identifier of the register where the transaction was suspended. |
|
Till |
The identifier of the till assigned to the register. |
|
Amount |
The amount of the transaction when it was suspended. |
|
Reason Code |
The reason why the transaction was suspended. |
|
Transaction ID |
The identifier of the transaction that was suspended. |
|
Total Suspended Transactions |
The total number of suspended transactions that occurred during the current business day. |
The Cancelled and Post Voided Transactions report provides a record of the transactions that have been cancelled or post-voided.
The report is sorted in descending order by Date.
Table 3-14 describes the columns in the report.
Table 3-14 Cancelled and Post Voided Transactions Report Columns
| Column | Description |
|---|---|
|
Date |
The date when the transaction was cancelled or post-voided. |
|
Cashier |
The cashier who cancelled or post-voided the transaction. |
|
Register |
The identifier of the register where the transaction was cancelled or post-voided. |
|
Type |
The type indicates if the transaction was cancelled or post-voided. |
|
Reason Code |
The reason why the transaction was post-voided. |
|
Transaction ID |
The identifier of the transaction that was cancelled or post-voided. |
|
Total Cancels |
The total number of cancelled transactions. |
|
Total Post Voids |
The total number of post-voided transactions. |
The following ad hoc criteria is available for this report:
Reporting period or date range
Store
Register (All or register number)
Cashier (All or cashier name)
The No Sales Transactions report provides a record of when the cash drawer was opened for non-financial transactions, such as making change for a customer or another register. This report can help the retailer detect fraudulent behavior.
The report is sorted in descending order by Date.
Table 3-14 describes the columns in the report.
Table 3-15 No Sales Transactions Report Columns
| Column | Description |
|---|---|
|
Date |
The date when the transaction occurred. |
|
Cashier |
The cashier who performed the transaction. |
|
Register |
The identifier of the register where the transaction occurred. |
|
Type |
This column will always contain No Sales. |
|
Reason Code |
The reason for the transaction. |
|
Transaction ID |
The identifier of the transaction. |
|
Total No Sales |
The total number of no sales transactions. |
The following ad hoc criteria is available for this report:
Reporting period or date range
Store
Register (All or register number)
Cashier (All or cashier name)