User Guide
|
|
Using the Management Console to Monitor Applications
One of the biggest changes in the Management Console compared to the previous release is the addition of the JMX layer and the possibility of using MBeans. This chapter describes how the JMX layer and the MBeans are used to monitor your running Java applications. You will find information on the following subjects:
Architectural Overview
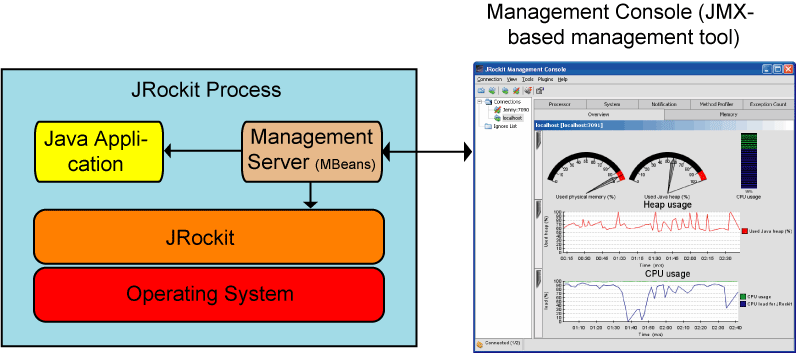
Figure 2-1 shows the architecture of the monitoring and management support. In the this release, JRockit (JVM) is highly instrumented for monitoring and management. The platform instrumentation provides information on performance, resource consumption, and the JVM and logging settings of applications running on the Java platform.
JMX provides a standard way to instrument the Java runtime environment and applications; the JMX Remote API allows that instrumentation to be accessed remotely. The instrumentation is accessible through the JMX managed bean (MBean) interfaces, which are registered in the management server. Applications can also create their own MBeans and register them in the management server, which can serve as a single point for remote access. A JMX-compliant client, such as the BEA JRockit Management Console, can connect to the platform management server and manage the application (as well as the Java platform) using JMX technology.
Figure 2-1 Architecture of the JRockit Monitoring and Management Support
JMX specification
For a complete reference on the JMX standard, please see:
http://java.sun.com/j2se/1.5.0/docs/api/javax/management/package-summary.html
Platform Beans
The Java platform provides a set of platform MBeans for monitoring and managing the Java virtual machine and the logging facility. Table 2-1 describes the MBeans included in this release:
|
Operating system on which the Java virtual machine is running. |
|
JRockit has its own set of MBeans that inherit the functionality of the platform MBeans described in Table 2-1. The correct names of the JRockit specific MBeans follow the same naming convention, except for the jrockit extension; for example, java.lang.management.ThreadMXBean is the same as jrockit.management.ThreadMXBean.
An MBean is a managed object that follows the design patterns conforming to the JMX specification. An MBean can represent a device, an application, or any resource that needs to be managed. The management interface of an MBean comprises a set of readable and/or writable attributes.
Each platform MBean has a set of attributes and operations such as memory usage, thread CPU usage, garbage collection statistics, and so on. Some might also emit notifications. We will explore a few platform MBeans in the following sections.
The Management Console can connect to the Management Server, which in turn allows you to monitor your application and view all the JMX objects. You need to be connected to the management server to view the objects. To start the Management Console, see Starting the BEA JRockit Management Console.
Attributes Described
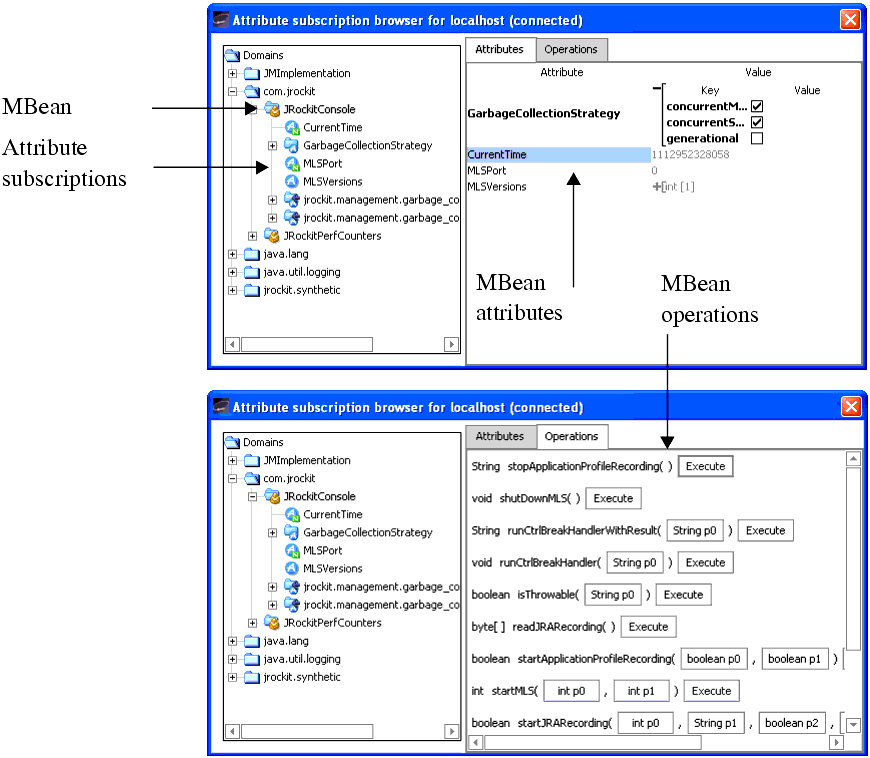
The registered MBeans and their attributes are all listed in the Attribute Subscription Browser (Figure 2-3). Each attribute has its own set of attribute subscriptions that can be used to monitor the different aspects of your application and connection.
Viewing the Attributes
- Make sure you are connected to the management server (see Enable the Management Server) and that you are connected to a JRockit instance (see Connecting to BEA JRockit).
The Attribute subscription browser appears, see Figure 2-2.
Figure 2-2 Attribute Subscription Browser for Local Host
The tree to the left shows all available MBeans and their subscriptions on the management server
Icons Explained
Table 2-2 descibes the available icons in the Attribute subscription browser.
Table 2-2 Descriptions of icons.
Attribute Subscriptions
The registered MBeans are all listed in the Attribute Subscription Browser (Figure 2-3). Each MBean has its own set of attribute subscriptions that can be used to monitor the different aspects of your application and connection. By subscribing to the attributes, you have a powerful way to monitor your application. You can subscribe to the attributes from many places in the Management Console; for example, you can add subscription attributes to the graphs on the Overview tab or you can select the Enable Persistence selection in the Attribute subscription browser.
When you select the Enable Persistence option, the attributes are saved to a .csv file that is stored where you have specified. See Persistence Directory for more information on the persistence file.
Viewing and Editing the Attribute Subscriptions
- Make sure you are connected to the management server (see Enable the Management Server) and that you are connected to a JRockit instance (see Connecting to BEA JRockit).
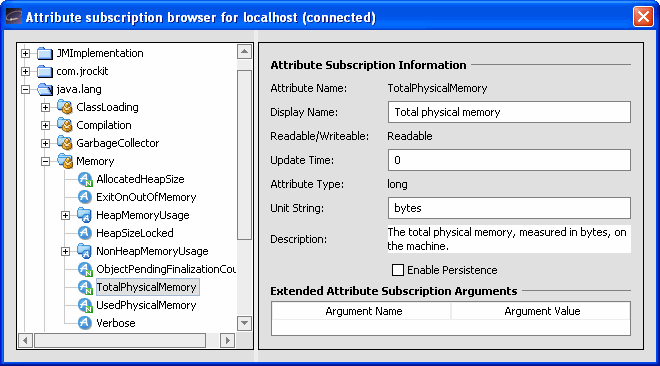
The Attribute subscription browser appears, see Figure 2-3.
Figure 2-3 Attributes Subscription Browser
The tree to the left shows all available MBeans on the management server. These MBeans are organized according to their domains (see Table 2-2 for a description of the icons).
You can change the properties of the attribute subscription under Attribute Subscription Information. This information is saved in your settings file (see Persistence Directory for more information on the settings file).


