

| Download Docs | Site Map | Glossary | |
|
|
|||
| bea.com | products | dev2dev | support | askBEA |
 |
 |
|
|||||||
| e-docs > Liquid Data for WebLogic > Building Queries and Data Views > Starting the Builder and Touring the GUI |
|
Building Queries and Data Views
|
Starting the Builder and Touring the GUI
This section describes how to start the Data View Builder tool in BEA Liquid Data for WebLogicTM. It provides a complete GUI reference and explanation of the tools, data sources, schemas, and task flow for designing, optimizing, and testing a Builder-generated query.
The following topics are covered:
Starting the Data View Builder
To start the Data View Builder, follow these basic steps.
t3://localhost:7001
Data View Builder GUI Tour
The Data View Builder consists of three main views or modes that you can get to by clicking on the associated tabs. Each tab represents a phase in the process of designing and testing a query. Generally, you will use the Design and Test tabs to design and run (test) the query, respectively. Some, but not all, queries will require the use of optimization hints and techniques on the Optimize tab.
The Design tab is where you construct the query by working with source and target schemas to specify source conditions and source-to-target mappings.
The following sections describe the features available on the Design tab.
Overview Picture of Design Tab Components
The following figure and accompanying sections describe the components on the Design tab. (Click the tab to access it.)
Figure 2-2 Design Tab
Note: Although not entirely specific to the Design tab, the menus, horizontal shortcut toolbar and status bar are also covered in detail in this section since this is the first place you encounter them. Although some menu options and toolbar shortcut buttons do stay the same regardless of which tab you are on, there are mode-specific menus and toolbar options for Design, Optimize, and Test tabs which are explained in those topics. 1. Menu Bar for the Design Tab The Menu Bar provides File, Schema, View, and Window menus as detailed in the following table.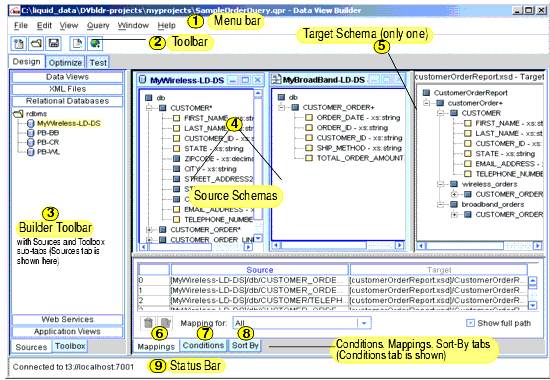
2. Toolbar for the Design Tab The toolbar, located directly below the menus, provides shortcuts to a subset of commonly used actions also available from the menus. Figure 2-3 Toolbar
3. Builder Toolbar The Builder Toolbar includes two subtabs:
Sources Tab
The Sources tab on the Builder Toolbar contains the data sources configured on the Liquid Data Server to which you are connected. Note that a data source type only shows up as a button on the Builder Toolbar if it has been configured in the Server to which you are connecting.
Note: For a detailed introduction to these data sources, see Different Kinds of Data Sources in Overview and Key Concepts.
To open a schema for a data source, click on the data source type (for example Relational Databases) to get a list of configured data sources of that type. Then double-click on the particular data source you want to work with The schema window for that source is displayed in a movable window on the desktop.
Figure 2-4 Builder Toolbar: Sources Tab
Toolbox Tab The Toolbox tab on the Builder Toolbar provides the following tools to use in query construction: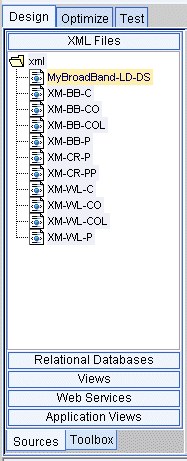
Note: Any custom functions configured in the Liquid Data Server through the WebLogic Server Administration Console will show up on the Builder Toolbar on the Functions panel along with the standard functions provided.
Figure 2-5 Builder Toolbar: Toolbox Tab
Functions Functions are built-in code modules that return a value when they run. The Functions panel provides a library of standard W3C functions compliant with the W3C XQuery 1.0 and XPath 2.0 Functions and Operators specification. (See Figure 2-5 for an example of the Functions panel on the Builder Toolbar Toolbox tab.) In Data View Builder, the Functions are displayed in the Builder Toolbar on the Toolbox tab Functions panel by category names like Aggregate Functions, Boolean Functions, Operator Functions, and so on. To view all the functions in a category or group, expand the group node. You can double click or drag and drop a function object to the desktop where it appears in a tree format showing the number and type of parameters required. A copy of any mapped function saves automatically with the project when you close it. The saved function (with associated parameters) appears in the Components panel when you reopen the project. If you do not map the new function and you terminate the session, Data View Builder discards it and it does not appear in the Components panel. Each function has a specification for required parameters and expected behavior. Some functions cannot be used in the work area, but must appear only on the desktop. For complete information about each function, its parameters, and expected behavior, see Functions Reference. For more detailed information, see the W3C XQuery 1.0 and XPath 2.0 Functions and Operators specification. The Function Editor The functions editor gives you a space to create functions using drag-and-drop and to view existing functions in your project. Figure 2-6 Function Editor
There are two ways to open the Functions Editor:
Figure 2-7 Click Edit Button to Get the Functions Editor
Click Close to close the Functions Editor.
Custom Functions
If you have custom functions configured through the Administration Console, these will show up in the Data View Builder on the Toolbar Functions tree in a custom group. The name of the group is what you specify in the "presentation group" element in the custom functions library definition (.CFLD) file. If no grouping label is specified "Ungrouped". For more information on this, see "Contents of a CFLD File" and "Structure of a CFLD File" in Using Custom Functions in Invoking Queries Programmatically.
Constants
You can use the Constants panel to create function parameters with constant values.
Figure 2-8 Builder Toolbar: Toolbox Tab: Constants
Choose the type of constant based on how you want the data to be considered in the query. Strings are alphanumeric values that typically contain alphabetic letters, special characters, and digits used in non-numeric comparisons. Names, zip codes, phone numbers, and street addresses are typical examples of string values. Numbers can be integers (positive or negative), decimal values, or floating point expressions. The Empty element enables you to force an element to appear in the query. We expect mapped data elements to appear in the query result, but you may wish to see other data elements appear that are not mapped. If you drag and drop the Empty element onto a node, that node will appear in the query result. To include a String, Number, or Empty element constant as a function parameter, follow steps similar to those shown in this example:
xf:starts-with(str1,str2)
The condition appears in the Functions Editor as shown in the following figure.
Figure 2-9 Condition with starts-with Constant in Functions Editor
Close the Functions Editor by clicking the Close button. The new condition you created is also now displayed in the Source column on the Condition tab.
Figure 2-10 Condition with starts-with Constant in Row on Conditions Tab
Note: If you design a query with a constant, and then design another query using a query parameter that specifies exactly the same value, the generated XQuery translation is different even though the functionality in each query is exactly the same.
Query Parameters: Defining
Query parameters can be strings, integers, floating point numbers, boolean expressions, or date and time types. They are variables that you define with no static value. On the Test tab, you can supply a different value each time you run the query (see 4. Query Parameters: Submitted at Query Runtime).
The Query Parameter bar has a text box where you can enter a new parameter value to be stored.
You can invoke these variables when you build conditions. The following table shows examples of supported data type values.
You can also do one of the following:
You can drag and drop a node from an input resource file to an empty row in the work area and then drag and drop a query parameter from the Query Parameter resource tree to specify a condition for the query.
Note: If you design a query with a constant, and then design another query using a query parameter, the generated XQuery translation is different even though the functionality in each query is exactly the same.
Components
The Components panel shows the structure of the current project in Design View. All elements of the query, except the target schema appear in this view of the project, including any data source schemas you are using or functions that you map with parameters.
Figure 2-12 Builder Toolbar: Toolbox Tab: Components
Any component that appears in this panel can be minimized on the desktop by double clicking the appropriate node. Click again and the component reappears on the desktop. The target schema does not appear in the Components panel because you cannot close it while working on the project. When you save a project by name and reopen it, the project components appear in this window, but minimized on the desktop. You can move them to the desktop by double clicking a selected component. When you reopen a saved project, the output schema appears directly on the desktop instead of in the Components tree. You can right-click any parent node and click Edit, Delete, or Rename to complete those tasks. 4. Source Schemas Source schema windows show XML schema representations of the structure of the data in the selected data source. Used to create source conditions and mappings to a target schema. You can have multiple data source schemas open on the desktop as needed. Note: For a detailed description of the special characters used to identify characteristics of schema nodes, see Special Characters: Occurrence Indicators. To open a schema for a data source: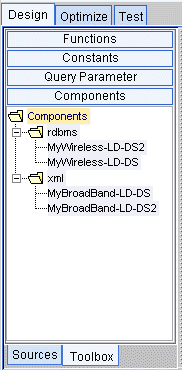
5. Target Schema
The Target Schema window shows the XML schema representation for the structure of the target data (query result).
Only one target schema per project is allowed. If you have a target schema open and decide to choose another, the current target schema is closed and the new one replaces it.
Note: For a detailed description of the special characters used to identify characteristics of schema nodes, see Special Characters: Occurrence Indicators.
To open and set a target schema for a project:
(You can also choose the menu item File—>Set Selected Source Schema as Target Schema to add a source schema selected on the Builder Toolbar as the target schema.)
Figure 2-14 Target Schema
6. Conditions Tab The Conditions tab shows: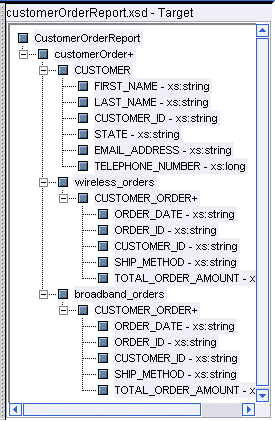
The Conditions area functions both as a tracking and reflection tool, and as a workspace that you can manipulate directly. Whenever you do a drag-and-drop operation that causes an update to Conditions, the Conditions tab is automatically displayed.
Figure 2-15 Conditions Tab on the Design tab
Conditions The Conditions section shows conditions (filters) for source data. As you build up the query by creating drag-and-drop source-to-source node relationships among data source schemas, the implied condition statements are recorded and reflected as joins under the Conditions. Even if you don't drag and drop anything directly into the Conditions tab, you will see the appropriate conditions building up here as a result of your work with the source schemas. (When you drag and drop a source element onto another source element, the equals function is used by default to create a simple join.) Figure 2-16 Conditions Tab in Basic View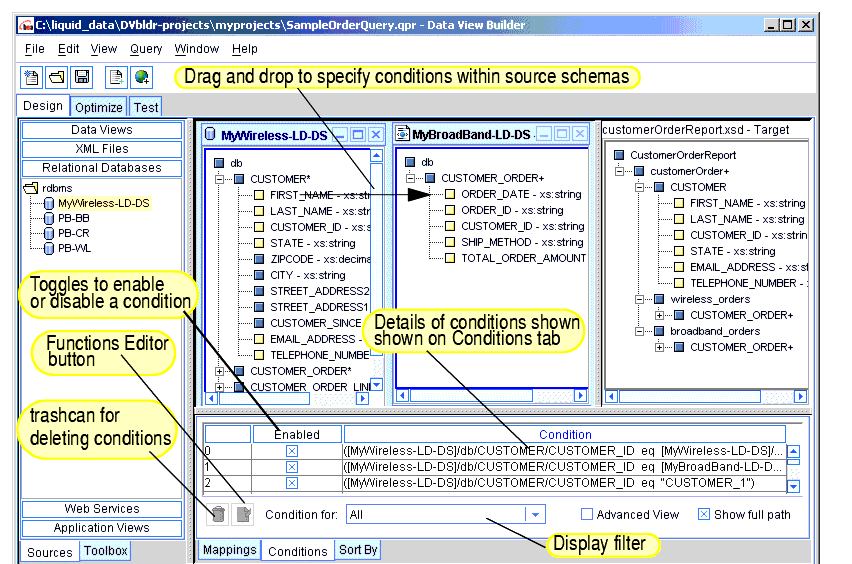
You can also use the Conditions area as a workspace to explicitly drag-and-drop elements of a query statement into the rows under Conditions to build up the query. You can drag-and-drop elements and attributes from source schemas as well as functions, constants, and parameters from the Builder Toolbar "Toolbox" tab directly into the rows under Conditions to craft conditions statements. This tab includes the following features to facilitate working with conditions:
Advanced View for Defining Explicit Scope for Conditions
When you click the "Advanced View" toggle, the Conditions tab displays a column for defining explicit scope for each condition.
Figure 2-17 Conditions Tab in Advanced View Showing Explicit Scope
The Scope area on the Conditions tab shows any explicit narrowing conditions (filters) you define for the target data to refine the query result. In basic mode (with Advanced toggle off) Data View Builder creates queries based on the scope implied by the source conditions you create and the structure of the target schema (implicit scope). Another words, by default the implicit scope is auto-generated by the Data View Builder. The auto-generated, implicit scope should be sufficient for most cases. However, there may be situations in which you want to control scoping explicitly. In these cases, you can switch to the Advanced view. A scope setting affects the placement of a where clause in the XQuery generation. The Data View Builder best guess at implicit scope will satisfy most cases, and you will generally not have to specify scope. For cases where you need to explicitly define scope to force the where clause to the right place in the query or sometimes to force it to be there at all, you can do this directly by dragging the appropriate node in the target schema into a row under Scope. For more information and examples about when and how to set scope, see Understanding Scope in Basic and Advanced Views in Designing Queries. Returning to Basic View (Automated Scope) When you toggle Advanced View off (no X showing next to Advanced View), Data View Builder returns to automatic scoping mode and discards the changes you made in manual mode. The Current Scope text box and the Targets column disappear. 7. Mappings Tab The Mappings tab shows source-to-target mappings that will define the structure of the query result. As you drag-and-drop source elements onto target elements among the schema windows, the Mappings tab records these relationships, which build up the shape the data will take in the query result. For example, dragging and dropping FIRST_NAME and LAST_NAME elements from CUSTOMER in a source schema to the associated CUSTOMER elements in the target schema specifies that in the query result customers will be identified with first and last names as defined. Whenever you do a drag-and-drop operation that causes an update to Mappings, the Mappings tab is automatically displayed. Figure 2-18 Mappings Tab
Deleting a Mapping To delete a mapping, select the row on the Mappings tab that contains the source-to-target mapping you want to delete (selected mapping is highlighted) and click the trashcan. 8. Sort By Tab The Sort By tab specifies how the result should be ordered and a list of candidate nodes that you can order. Figure 2-19 shows the order of a repeatable node segment of the target schema. The drop-down list shows all repeatable data nodes in the target schema marked with an asterisk (*) or a plus sign (+). A repeatable node is the parent of child nodes that can appear in the query result once for every instance of a match. A repeatable node is an ancestor to one or more nodes that will represent unique data returned by the query. The blue arrows move rows up and down. These icons are enabled only when you select a data item that can move up or down. The drop-down list shows the repeatable nodes with subordinate nodes that can be sorted. When you select a repeatable node from the drop-down list, the associated child nodes appear in the Sort By list. Move these child nodes up or down to specify how the result should be sorted. For example, a Customer* element can be sorted first by Last_name and then by First_name by having the Last_name row at the top and the First_name row directly beneath it. An item can be moved if it is assigned an ascending or descending attribute in the source schema. (The database administrator or data architect who creates the source schema specifies this.) Items with ascending or descending attributes can be moved up only if there is another item above, and they can be moved down only if the next item down also has an ascending or descending attribute. Figure 2-19 Sort By Tab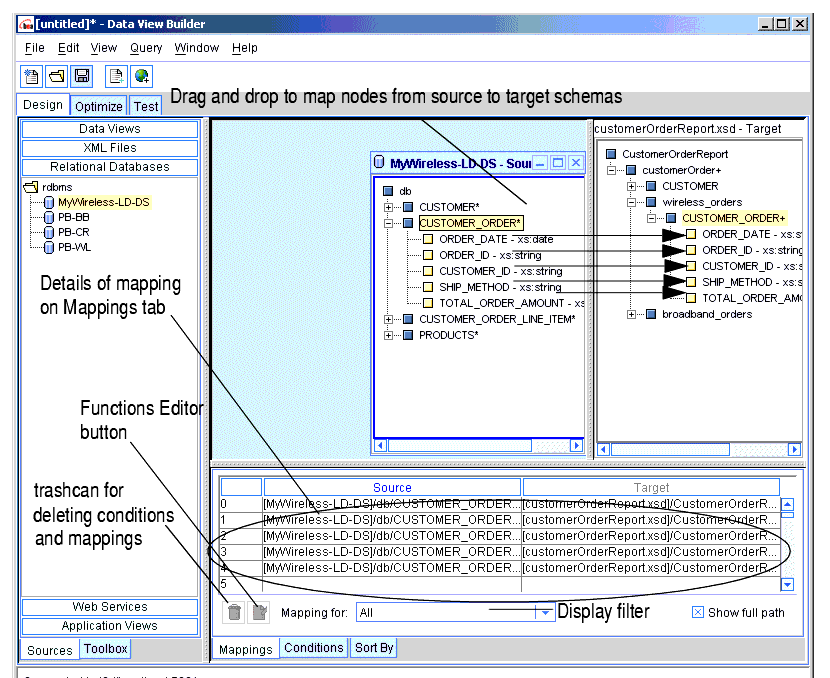
9. Status Bar The Status Bar is a horizontal bar at the bottom of the Data View Builder that provides status information about current actions and processes. Figure 2-20 Status Bar
Optimize Tab The Optimize tab is where you can optionally add more information such as "hints" to data sources to improve query performance. The following sections describe the features available on the Optimize tab.
Overview Picture of Optimize Tab Components
The following figure and accompanying sections describe the components on the Optimize tab. (Click the tab to access it.)
Figure 2-21 Optimize Tab
Note: The Optimize tab contains a subset of the menu options and toolbar buttons available on the Design tab. For a full description of these options, see 1. Menu Bar for the Design Tab and 2. Toolbar for the Design Tab. 1. Source Order Optimization You can re-order source schemas on the top frame on the Optimize tab to improve query performance. To move a schema up or down, select the schema and click the up or down arrow buttons to the right of the list of schemas. When a query uses data from two sources, the Liquid Data Server brings the two data sources into memory and creates an intermediate result (cross-product) using the two sources. If you specify more than two sources, the Liquid Data Server creates a cross-product of the first two sources, then continues to integrate each additional resource, one at a time, in the order that they appear in FOR clauses. The intermediate result grows with each integration, until all sources are accounted for. The size of a source is the number of tuples, or records, used in the query from that source. The size of the intermediate result depends on the input size of the first source multiplied by the input size of the second source and so on. A query is generally more efficient when it minimizes the size of intermediate results. You can re-order source schemas in certain situations to improve performance. For detailed information on how to optimize a query by ordering source schemas, see Optimizing Queries. 2. Join Pair Hints A query hint is a way to supply more information to the Liquid Data Server about the amount of data each source contains when processing a query. The Join Hints frame contains a drop-down list of data source pairs, and a table that shows all the joins for each pair. Only source pairs that have join conditions across them appear in the drop-down list. For each join condition in the table, you can provide a hint about how to join the data most efficiently. For detailed information on how to optimize a query by using optimization hints, see Optimizing Queries. Test Tab The Test tab is where you view the generated XQuery language interpretation of the query elements you developed on the Design and Optimize tabs, and run the query against your data sources to verify the result and evaluate performance. From this view, you can provide different parameters to the query before you run it. The following sections describe the features available on the Test tab.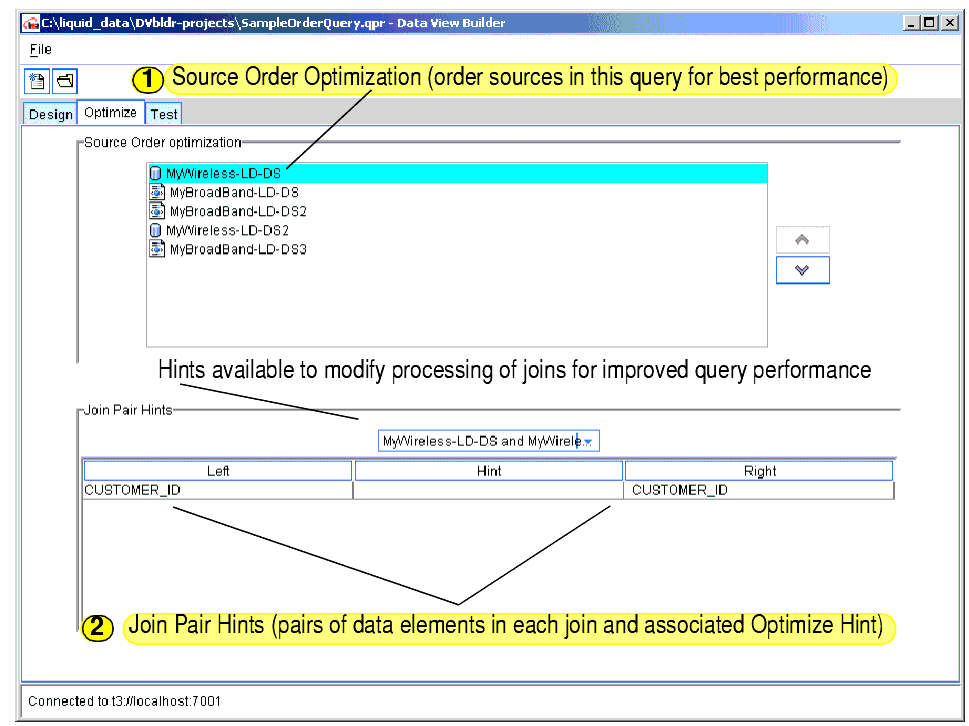
Overview Picture of Test Tab Components
The following figure and accompanying sections describe the components on the Test tab. (Click the tab to access it.)
Figure 2-22 Test Tab
2. Toolbar for the Test Tab The toolbar, located directly below the menus, provides shortcuts to a subset of commonly used actions also available from the menus. Figure 2-23 Toolbar on the Test Tab
3. Builder-Generated XQuery The query you developed on the Design and Optimize tabs is shown in XQuery language in the "Query" window on the upper left panel on the Test tab. Figure 2-24 Builder-Generated XQuery Shown in Query Window
4. Query Parameters: Submitted at Query Runtime You can use the Query Parameters panel to add variable values to a query each time you run it. The list of variables depends on the number of variables you defined as Query Parameters on the Design tab (see Query Parameters: Defining) and which ones appear as one or more function parameters. Figure 2-25 Query Parameters Settings on Test Tab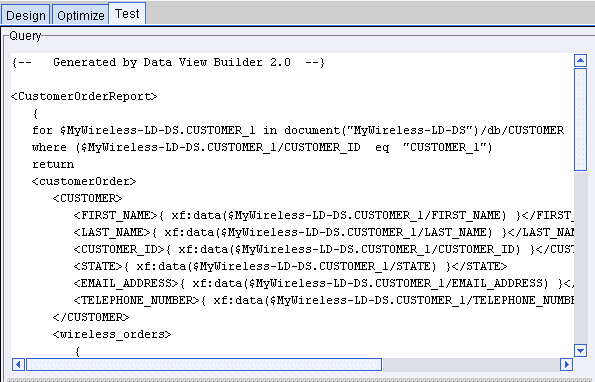
5. Query Results - Large Results If you anticipate a large set of data coming back in the query result, click Large Results (an X in the box indicates this feature is on). The default is off (no X). When this option is on, Liquid Data uses swap files to temporarily store results on disk in order to prevent an out-of-memory error when the query is run. Figure 2-26 Specifying Large Results
6. Run Query To run a query, click the Run Query button on the toolbar in the upper left of the Test tab. (You can also choose the Run Query option from the Query menu.) Figure 2-27 Click the "Run Query" Button to Run the Query
The query is run against your data sources and the result is displayed in the Results panel in XML format.
Stopping a Running Query
You can stop a running query before it has finished processing by clicking the Stop Query Execution button in the toolbar. (You can also choose the Stop Query option from the Query menu.)
Figure 2-28 Click the "Stop Query Execution Button" to Stop a Running Query
7. Result of a Query When you run a query, the result is displayed in the Results window on the Test tab in XML format. Figure 2-29 Query Result is Shown on Test Tab When Query is Run
It is a good practice to save the project file immediately once you have chosen and set up a target schema, and started creating conditions and mappings for a query. Save frequently or after you make a significant change to avoid losing your work. To save the project for the first time.
To save a project choose File—>Save Project or File—>Save Project As from the menus (or click the "Save the project" toolbar button). Data View Builder projects are saved with a .qpr filename extension. (For a complete description of options available for handling projects, see Table 2-1 in 1. Menu Bar for the Design Tab.
To Make a Project Portable, Save Target Schema to Repository
For the project to be portable so that other users can open the project and use it, the target schema must be saved to the Liquid Data server repository on the server where the project will be used.
Saving a Project is Not the Same as Saving a Query
Please keep in mind that "saving a project" is not the same as "saving a query". Saving a project creates a Data View Builder .qpr file that includes the conditions and mappings for source and target schemas used in a particular query. You can re-open any project in the Data View Builder, modify the conditions and mappings on the XML schemas, and re-optimize or re-run the query from within the Builder tool.
However, saving a project does not make the query in that project available as a stored query in Liquid Data. To create a stored query, you need to use the Save Query option on the Test tab. For more information on saving a query, see Saving a Query in Testing Queries.
Special Characters: Occurrence Indicators
The Data View Builder uses a set of special characters (occurrence indicators) to indicate the number of items in a sequence. Occurrence indicators are generally used to specify characteristics for elements or attributes in schemas, but are also found elsewhere in the Builder user interface (UI) where they are needed to specify occurrence characteristics. You can apply these characteristics to elements and attributes of schemas that you build or modify by accessing the right-mouse click pop-up menu on schema nodes.
Next Steps: Building and Testing Sample Queries
If you have not already done so, we suggest working through the steps in Getting Started, which takes you through the basic tasks of configuring some data sources and using the Data View Builder to design a query using the Order Query example from our Avitek Sample. (For more information about the Avitek Sample and other samples, see the Samples introduction page.) Working through the Getting Started (or even reading through the steps related specifically to using the Data View Builder) is an easy, hands-on way to get familiar with working with schema representations of data sources and using the basic query-building tools, task flow, and workspaces in the Data View Builder.
If you have already worked through the Getting Started topic or if you are ready to get started on building some other basic queries, we suggest you skip to the following topics in this document:

|

|

|