| Managing Log Messages |
![]()
![]()
|
|
The following sections describe the functions of the Message Browser:
Working with the Message Browser
Monitoring Incoming Log Messages
Viewing Log Message Definitions
For a description of the log messages, see Log Central Message and Message Definition Formats.
The following sections explain how to use the Message Browser:
Main Components of the Message Browser
Changing the Log Message Layout
To start the Message Browser:
For detailed information about starting the Console, see Introducing the Log Central Console. For the lc_launch command syntax, see Commands.
Figure 3-1 Message Browser
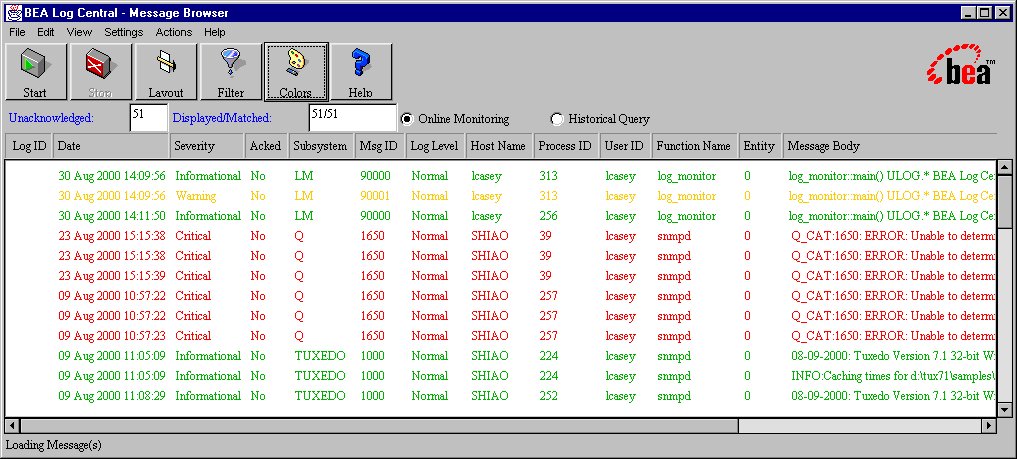
The following table describes the main components of the Message Browser.
|
Component |
Description |
|---|---|
|
Menu bar |
Provides the menus for the Message Browser. For more information, see Message Browser Menus. |
|
Toolbar |
Provides access to frequently used actions. For more information, see Message Browser Toolbar. |
|
Unacknowledged field |
Displays the number of messages in the message pane that have not been acknowledged. The Message Browser displays a value in this field when you perform online monitoring or query the database. |
|
Displayed/Matched field |
When you query the database, this field displays the number of messages that satisfy the filter settings and the number of messages displayed. These numbers differ if the query found more messages than the maximum that can be displayed. To configure the maximum number of messages that can be displayed, use the -n option when you start the Log Central Console. For information about filter settings, see Filtering Log Messages. For information about the -n option, see the description of the lc_launch command in Commands. |
|
Online Monitoring button |
When you click Start, directs the Log Central Console to monitor and display log messages in real time as they arrive at the Central Collector. The Message Browser displays real-time incoming messages that satisfy the filter settings, with the most recent message displayed at the top of the message pane. For information about the filter settings, see Filtering Log Messages. |
|
Historical Query button |
When you click Start, directs the Log Central Console to query the Log Central database. The Message Browser displays messages in the database that satisfy the filter settings, with the most recent message displayed at the top of the message pane. For information about the filter settings, see Filtering Log Messages. |
|
Message pane |
Displays log messages. |
The following table describes the Message Browser toolbar. On the toolbar, all options except Stop and Help are inactive if the Message Browser is receiving real-time incoming messages or querying the database.
|
Button |
Action |
|---|---|
|
|
Retrieves and displays real-time incoming messages or messages that are in the Log Central database, depending on whether you selected Online Monitoring or Historical Query in the Message Browser. The Message Browser displays messages that satisfy the filter settings, with the most recent message displayed at the top of the message pane. For information about the filter settings, see Filtering Log Messages. |
|
|
Stops retrieval of messages. This button is inactive if messages are not being retrieved. |
|
|
Displays the Layout Definition window, in which you specify the message fields to display and the order in which to display them. For information about using the Layout Definition window, see Changing the Log Message Layout. You can also use the Layout Definition command in the Settings menu to display the Layout Definition window. |
|
|
Displays the Filter Settings window, in which you can:
For information about using the Filter Settings window, see Filtering Log Messages. You can also use the Browser Filter command in the Settings menu to display the Filter Settings window. |
|
|
Displays the Message Colors window, which enables you to change the colors for the severity levels. For information about using the Color Settings window, see Changing Severity Colors. You can also use the Message Colors command in the Settings menu to display the Message Colors window. |
|
|
Displays the Log Central Online Help. You can also use the commands in the Help menu to display the Log Central Online Help. |
The following table describes the Message Browser menus.
|
Menu |
Commands |
|---|---|
|
File |
Reports—Generates a report of the messages retrieved from a database query. This option is inactive if the Message Browser is in online monitoring mode. A submenu lets you generate a summary report or a detail report. A summary report groups messages by subsystem and presents the message totals for each severity level and log level. A detail report provides most of the message fields for each message. For more information about generating reports, see Generating Reports. Close—Exits the Message Browser. |
|
Edit |
Delete—Deletes the selected messages. |
|
View |
Message Details—Displays the Message Details window, which displays the message body and message definition for the selected message. |
|
Settings |
Browser Filter—Displays the Filter Settings window, in which you can:
For information about using the Filter Settings window, see Filtering Log Messages. You can also use the Filter button in the toolbar to display the Filter Settings window. Layout Definition—Displays the Layout Definition window, in which you can specify the message fields to display and the order in which to display them. For information about using the Layout Definition window, see Changing the Log Message Layout. You can also use the Layout button in the toolbar to display the Layout Definition window. Message Colors—Displays the Message Colors window, which enables you to change the colors for the severity levels. For information about using the Color Settings window, see Changing Severity Colors. You can also use the Colors button in the toolbar to display the Message Colors window. |
|
Actions |
Start—Retrieves and displays real-time incoming messages or messages that are in the Log Central database, depending on whether you selected Online Monitoring or Historical Query in the Message Browser. The Message Browser displays messages that satisfy the filter settings, with the most recent message displayed at the top of the message pane. For information about the filter settings, see Filtering Log Messages. Stop—Stops the database query or online monitoring. Acknowledge—Acknowledges the selected messages. Clear Acknowledgment—Clears the acknowledgments for the selected messages. |
|
Help |
Displays the Log Central Online Help for various Message Browser help topics. You can also use the Help button in the toolbar to display the Log Central Online Help. |
Changing the Log Message Layout
You can change the fields to display in the Message Browser message pane. You can also change the order in which the fields are displayed.
To change the message layout:
For detailed information about starting the Console, see Introducing the Log Central Console. For the lc_launch command syntax, see Commands.
The Message Browser displays the Layout window.
Figure 3-2 Message Browser Layout Window
Use the Show and Hide buttons to move selections from one list to the other.
The following table shows the default severity colors.
|
Severity |
Default Color |
|---|---|
|
Informational |
Green |
|
Warning |
Yellow |
|
Minor |
Blue |
|
Major |
Magenta |
|
Critical |
Red |
To change the severity colors:
For detailed information about starting the Console, see Introducing the Log Central Console. For the lc_launch command syntax, see Commands.
The Log Central Console displays the Color Settings window.
Figure 3-3 Color Settings Window
If you do not want to map colors to severity levels, select the None button.
To monitor log messages in real time:
For detailed information about starting the Console, see Introducing the Log Central Console. For the lc_launch command syntax, see Commands.
The Log Central Console monitors log messages in real time as they arrive at the Central Collector. The Message Browser displays messages that satisfy the filter settings you defined in the Filter Settings window, with the most recent message displayed at the top of the message pane. For information about the filter settings, see Filtering Log Messages.
To query the Log Central database:
For detailed information about starting the Console, see Introducing the Log Central Console. For the lc_launch command syntax, see Commands.
Queries the Log Central database. The Message Browser displays messages that satisfy the filter settings you defined in the Filter Settings window, with the most recent message displayed at the top of the message pane. For information about the filter settings, see Filtering Log Messages.
The Message Browser enables you to set filter criteria that:
You can also set filters that the data collection agents use. For more information, see Chapter 7, "Creating Filters," in the Log Central Configuration Guide.
To filter messages:
For detailed information about starting the Console, see Introducing the Log Central Console. For the lc_launch command syntax, see Commands.
The Message Browser displays the Filter Settings window.
Figure 3-4 Filter Settings Window

The Filter Settings window displays the current filter settings for online monitoring or database queries. When you select Online Monitoring in the Message Browser and click Start, the Message Browser uses the online monitoring filter settings to display real-time incoming messages. When you select Historical Query in the Message Browser and click Start, the Message Browser uses the database query filter settings to retrieve and display messages that are in the Log Central database.
You can configure up to three sorts, using ascending and descending sort order. To configure a sort:
Include messages that contain any values for this field (Show All).
Include messages that contain values in the Use Include List.
Exclude messages that contain values in the Use Exclude List.
In the example in the preceding figure, Log Central excludes messages for which the Subsystem value is EM, GP, LM, or ORACLE.
To move values from one list to the other, highlight the values and click the appropriate Selected button (Selected < or Selected >).
To move all values from one list to the other, click the appropriate All button (All < or All >).
To delete values from a list, select the values and click Del Selected. To delete all values in both lists, click Delete All.
To add a new value to a list, select the Use Include List or the Use Exclude List, enter the value in the text field above the buttons, and press Enter.
The Log Central Console preserves these message definition editor filter settings until the next time that you modify them as long as you keep the Log Central Console running. Filter settings are lost when you exit the Log Central Console.
To delete messages from the Log Central database:
For detailed information about starting the Console, see Introducing the Log Central Console. For the lc_launch command syntax, see Commands.
If you selected Online Monitoring, the Log Central Console monitors log messages in real time as they arrive at the Central Collector. If you selected Historical Query, the Log Central Console queries the Log Central database.
The Message Browser displays messages that satisfy the filter settings you defined in the Filter Settings window, with the most recent message displayed at the top of the message pane. For information about the filter settings, see Filtering Log Messages.
Note: The option to delete all messages is available only for historical queries. It is not available for real-time incoming messages.
A submenu lets you delete the selected messages or all messages that were returned in the last database query.
Message acknowledgment is a feature that you can use to keep track of system problems that are currently being resolved or actively investigated. The Message Browser displays each message's acknowledgment status (Yes or No) in the Acked column in the Message pane. When you view the messages, you can see which ones are being worked on and which ones are not being handled yet.
Note: The option to acknowledge all messages is available only for historical queries. It is not available for real-time incoming messages.
To acknowledge messages:
For detailed information about starting the Console, see Introducing the Log Central Console. For the lc_launch command syntax, see Commands.
If you selected Online Monitoring, the Log Central Console monitors log messages in real time as they arrive at the Central Collector. If you selected Historical Query, the Log Central Console queries the Log Central database.
The Message Browser displays messages that satisfy the filter settings you defined in the Filter Settings window, with the most recent message displayed at the top of the message pane. For information about the filter settings, see Filtering Log Messages.
A submenu lets you acknowledge the selected messages or all messages that were returned in the last database query.
You might want to remove an acknowledgment if a message was acknowledged when it should not have been, or if a problem that was thought to be resolved is still occurring.
Note: The option to remove acknowledgments for all messages is available only for historical queries. It is not available for real-time incoming messages.
To remove message acknowledgments:
For detailed information about starting the Console, see Introducing the Log Central Console. For the lc_launch command syntax, see Commands.
If you selected Online Monitoring, the Log Central Console monitors log messages in real time as they arrive at the Central Collector. If you selected Historical Query, the Log Central Console queries the Log Central database.
The Message Browser displays messages that satisfy the filter settings you defined in the Filter Settings window, with the most recent message displayed at the top of the message pane. For information about the filter settings, see Filtering Log Messages.
A submenu lets you remove the acknowledgments from the selected messages or all messages that were returned in the last database query.
To view the message definition fields associated with a message:
For detailed information about starting the Console, see Introducing the Log Central Console. For the lc_launch command syntax, see Commands.
If you selected Online Monitoring, the Log Central Console monitors log messages in real time as they arrive at the Central Collector. If you selected Historical Query, the Log Central Console queries the Log Central database.
The Message Browser displays messages that satisfy the filter settings you defined in the Filter Settings window, with the most recent message displayed at the top of the message pane. For information about the filter settings, see Filtering Log Messages.
The Message Browser displays the Message Details window. This window displays the message body and the message definition fields.
To change a message definition, see Changing Message Definitions and Subsystem Descriptions.
![]()
![]()
|
|
| Copyright © 2000 BEA Systems, Inc. All rights reserved.
Required browser: Netscape 4.0 or higher, or Microsoft Internet Explorer 4.0 or higher. |


