Managing WebLogic Integration Solutions
|
|
Process Instance Monitoring
This section provides the information you need to use the Process Instance Monitoring module of the WebLogic Integration Administration Console to:
- View summary statistics that reflect system health.
- View the summary or detailed status for selected instances.
- View an interactive or printable process instance graph.
- Terminate or suspend instances, resume previously suspended instances, or unfreeze frozen instances.
Note: You must be logged in as a member of the Administrators, IntegrationAdministrators, or IntegrationOperators group to make changes to process status. See Default Groups, Roles, and Security Policies.
The information displayed in the Process Monitoring module is based on the tracking data stored in the runtime database. A combination of system-level and process-level properties control the type of data available. To learn more about how tracking data is managed, see Managing Process Tracking Data.
The following topics are provided:
- Overview of the Process Instance Monitoring Module
- Requirements for the Interactive Graph
- Viewing Instance Statistics by Process Type
- Viewing System Health Statistics
- Listing and Locating Process Instances
- Constructing an Advanced Search
- Viewing Process Instance Details
- Viewing an Interactive or Printable Process Instance Graph
- Suspending, Resuming, Terminating, or Unfreezing Process Instances
Overview of the Process Instance Monitoring Module
The following table lists the pages you can access from the Process Instance Monitoring module. The tasks and topics associated with each are provided.
|
For each process type, the average elapsed time and a count of the number of instances in each state (running, suspended, aborted, frozen, terminated, completed, and above SLA) are displayed. |
||
|
Filter the list by URI or display name. Use ? to match any single character or * to match zero or more characters. |
||
|
View a list of process instances. Instance ID, display name, process label, start time, elapse time, and status (running, completed, frozen, aborted, suspended) are displayed. |
||
|
Filter the list by process status (for example, running, frozen, or over SLA), instance ID, or process label. |
||
|
Access the Process Instance Details page for a selected process. |
||
|
Suspending, Resuming, Terminating, or Unfreezing Process Instances |
||
|
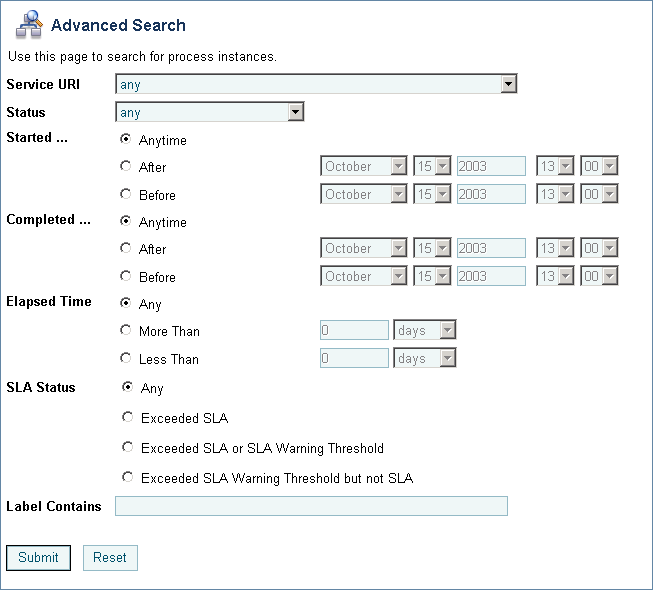
Construct an advanced search using process properties such as status, time started or completed, elapsed time, or SLA status. |
||
|
View general indicators of system health and performance trends by process type, including the process types that are taking the longest to execute, those that have not completed within SLA thresholds, and those that are failing to complete. |
||
|
View process instance properties, including variable values for the running instance, worklist tasks created by or associated with the process, and business messages associated with the process. |
||
|
Suspend, Resume, Terminate, or Unfreeze the process instance. |
Suspending, Resuming, Terminating, or Unfreezing Process Instances |
|
Requirements for the Interactive Graph
To view the interactive process graph, Adobe SVG Viewer must be installed on the client system. If the server is running on Solaris, verify that your operating environment is set up to support this feature. The following section provides the information you need:
- Obtaining the SVG Viewer
- Using Adobe SVG Viewer with Netscape 7.0 on Windows
- Server Operating Environment Requirements for Solaris
Obtaining the SVG Viewer
The interactive process graph requires Adobe SVG Viewer Version 3.0x. You can download the viewer from the Adobe Web site (http://www.adobe.com/svg/viewer/install/main.html).
This viewer is not available for some configurations that WebLogic Platform 8.1 supports. The following table provides viewer availability by browser and operating system. Detailed information about the operating systems and browsers WebLogic Platform supports is provided at the following URL:
http://download.oracle.com/docs/cd/E13196_01/platform/suppconfigs/index.html
Note: If you are running in an English locale (for example, en_US or en_AU), and need to view processes that contain non-latin characters, we recommend that you install the Arial Unicode MS font. To learn more, see http://support.microsoft.com/kb/q287247/
|
Requires a workaround. See Using Adobe SVG Viewer with Netscape 7.0 on Windows. |
||
|
3.0 beta 1 version of viewer available from http://www.adobe.com/svg/viewer/install/main.html |
||
|
3.0 beta 1 version of viewer available from http://www.adobe.com/svg/viewer/install/main.html |
||
Using Adobe SVG Viewer with Netscape 7.0 on Windows
Before viewing an interactive process graph in Netscape 7.0 on Windows, you must install Version 3.0 of the Adobe SVG Viewer as described in the following procedure.
To install the Adobe SVG Viewer with Netscape 7.0:
Server Operating Environment Requirements for Solaris
Like many Java platform applications in the Solaris operating environment, the ability to serve up an Interactive Process Graph is dependent on the presence of one of the following:
- X server and hardware graphics adapter.
- Xvfb "virtual frame buffer" X server, which allows applications to render in the main memory of the computer instead of the hardware graphics adapter.
- Xsun, the X display server.
If the server is in an environment where there is no guarantee of an X server running, you will need to install either Xvfb or Xsun to support client access to interactive process graphs.
For a discussion of the issues and instructions, see "Seeing Up Solaris 7, 8, and 9 Operating Environments for Java Servlet Graphics" at http://developers.sun.com/solaris/articles/solaris_graphics.html
Note: Headless operation doesn't allow the use of Java Foundation Classes (Swing), and therefore does not address the issues.
Viewing Instance Statistics by Process Type
The Process Instance Statistics page lists the display name and average elapsed time for each process type. It also provides a count of the number of instances in each state (running, suspended, aborted, frozen, terminated, completed, and SLA exceeded). The counts are based on tracking data stored in the runtime database and do not include process data that has been purged.
Note: For stateless processes, N/A is displayed in the running instances column. These processes start and end in a single transaction.
To view the process instance statistics:
- Filter by display name or URI. Enter the search target, then click URI or Name. The processes matching the search criteria are displayed.
- Resort the list. Ascending
 and descending
  arrow buttons indicate sortable columns. Click the button to change the sort order.
 - Scroll through the pages. Use the controls in the lower left corner. Go to a page by selecting the page number or by using the arrow buttons to go to the next
 , previous
  , first
  , or last
  page.
page. - To view additional information about the instances of a selected type, select the process display name. To view additional information about the instances of a selected type that are in a specific state, select the number. The Process Instance Summary page displays only those instances that match the selection. See Listing and Locating Process Instances.
Viewing System Health Statistics
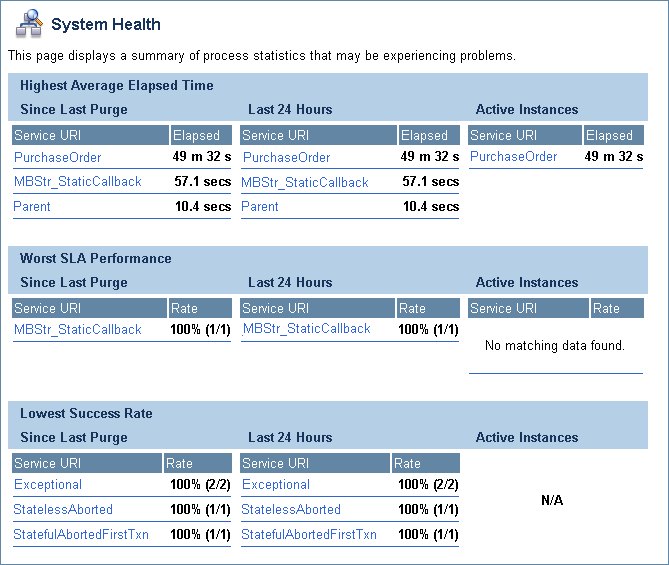
The System Health page provides an overview of system health by identifying processes that may be experiences problems.
The following indicators are displayed:
- Highest Average Elapsed Time
The process name and average elapsed time for processes with the highest average elapsed time are displayed. - Worst SLA Performance
The process name and rate for processes with the worst SLA performance are displayed. Both the percentage of instances that exceeded the SLA, and a ratio of the instances that exceeded SLA to the total number of instances, are displayed in the rate column. - Lowest Success Rate
The process name and rate for processes with the lowest success rate are displayed. Both the percentage of instances that failed, and a ratio of the instances that failed to the total number of instances, are displayed in the rate column.
For each of the above, the data displayed is divided into the following categories:
Each process name displayed on the page is a link to the Process Instance Summary page for the process type.
To view the system health statistics:
Listing and Locating Process Instances
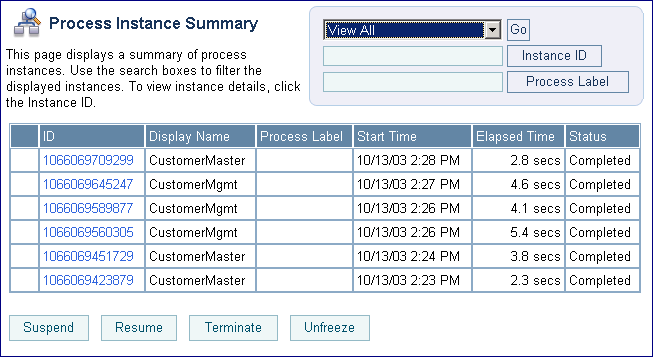
The Process Instance Summary page displays the following information for each process instance. For a more detailed description of the properties, see Viewing Process Instance Details.
Note: The process instances are sorted by start time, most recent first.
|
Process Instance ID. This is a link to the Process Instance Detail page. See Viewing Process Instance Details. |
||
|
Display name assigned to the process. If more than one version of the process is deployed, the version number is appended. |
||
|
Label for the process instance. The label is generated for each instance and typically reflects a value specific to the instance. For example, an order number, customer number, DUNS number, or some other value of use in auditing. To learn more about how the process label is set, see the JpdContext Interface in Building Integration Applications in the WebLogic Workshop help. |
||
|
Time elapsed since instance start. The units reported depend on the duration. |
||
|
The current state of the instance (Running, Completed, Suspended, Terminated, Frozen, Aborted). Note: Because stateless processes start and finish in a single transaction, these processes are never in the running state. |
||
To list and locate process types:
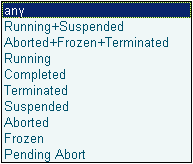
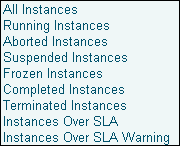
- Select a default filter from the Go drop-down list. The following options are available:
- Filter by instance ID. Enter the required instance ID, then click Instance ID. The instance identified is displayed.
- Filter by Process Label. Enter the search target, then click Process Label. Instances with a label that contains the search target are displayed.
- Scroll through the pages. Use the controls in the lower left corner. Go to a page by selecting the page number or by using the arrow buttons to go to the next
 , previous
  , first
  , or last
  page.
page. - Use the advanced search page. See Constructing an Advanced Search.
Constructing an Advanced Search
The Advanced Search page allows you to construct a complex process instance search.
The following table summarizes the available search criteria.
Viewing Process Instance Details
The Process Instance Detail page allows you to:
- View process properties.
- View an interactive or printable process graph.
- Suspend, Resume, Terminate, or Unfreeze a process instance.
- Navigate to a parent or child process instance.
Note: If No Data is displayed, the process instance details are not available. Either the data is not being captured at the tracking level configured for the process, or the information has been purged. It is possible for an instance ID to be displayed even though the associated instance data has been purged. For example, although the data for an instance may be purged after the instance has completed, the instance ID can remain in the runtime database because it is included as part of the tracking data associated with any parent or child instances that have not yet been purged.
To view process instance details:
- Locate the process. See Listing and Locating Process Instances.
Note: Your browser must meet certain requirements to view the interactive graph. See Requirements for the Interactive Graph. To learn more about the interactive process view, see Viewing an Interactive or Printable Process Instance Graph.
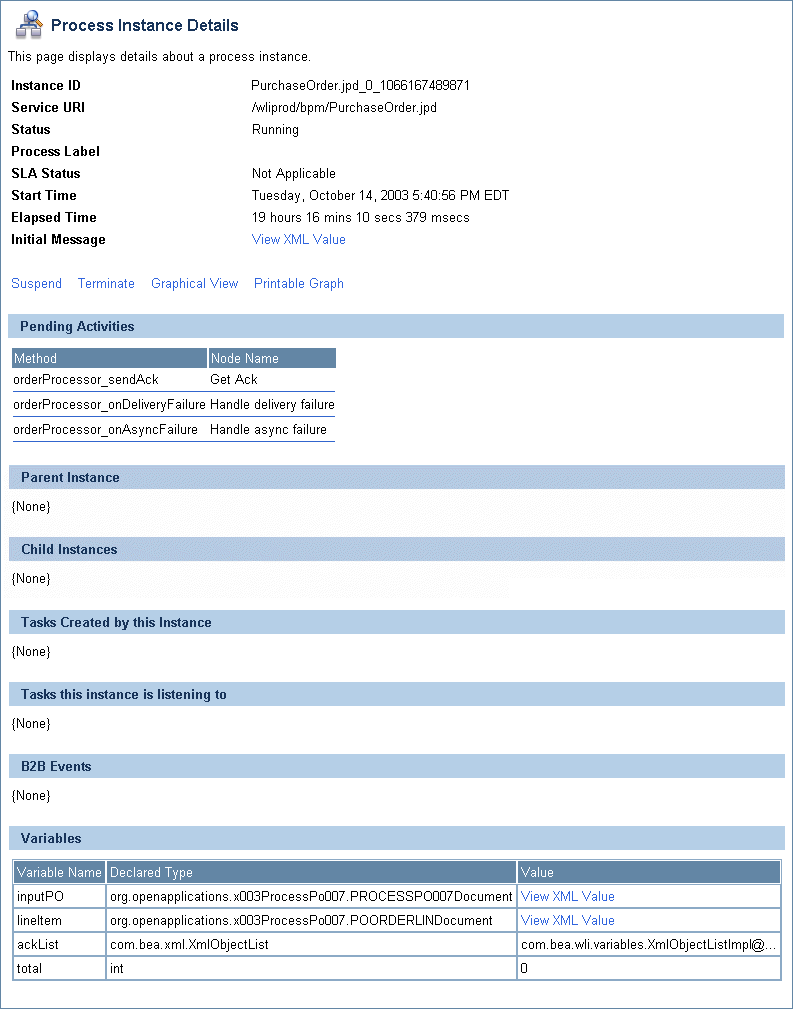
The following table summarizes the information displayed on the Process Instance Detail page.
|
The process URI. If there are multiple versions of the process, a version number is appended. |
||
|
Note: Because stateless processes start and finish in a single transaction, these processes are never in the running state. |
||
|
The process threw an unhandled exception. Aborted processes can only be terminated. |
||
|
The process failed but can be unfrozen. When a process is unfrozen, it resumes from the point where it failed. See Suspending, Resuming, Terminating, or Unfreezing Process Instances. Processes can be designed to freeze, rather than abort, by setting freeze on failure to true. To learn more see "Setting the Business Process Properties" in Designing Your Application in Building Integration Applications. |
||
|
Label for the process instance. The label is generated for each instance and typically reflects a value specific to the instance. For example, an order number, customer number, DUNS number, or some other value of use in auditing. To learn more about how the process label is set, see the JpdContext Interface in Building Integration Applications in the WebLogic Workshop help. |
||
|
If no service level agreements are set, Not Applicable is displayed. If service level agreements are set, this field displays the current status:
To learn more about the SLA, see Service Level Agreements. |
||
|
Time elapsed since instance start. The units reported depend on the duration. |
||
|
Termination date and time for a process that has been terminated. |
||
|
Parent process instance ID, display name, status, start time, and elapsed time for the parent instance is displayed. The instance ID is a link to the Process Instance Details page for the instance. To learn more, see Parent-Child Navigation. Note: The parent or child instance is only displayed if the tracking level for the process is Minimum, Node, or Full. |
||
|
An entry for each child instance. The instance ID, display name, status, start time, and elapsed time is displayed for each. The instance ID is a link to the Process Instance Details page for that process. |
||
|
Worklist tasks created by the instance. The task name and ID are displayed. The ID is a link to the Worklist Task Details page. |
||
|
Worklist tasks this process is listening to. The task name and ID are displayed. The ID is a link to the Worklist Task Details page. |
||
|
Summary information for any business messages are displayed. The event ID, direction (inbound or outbound), and trading partners (from and to) are displayed. The event ID is a link to the message detail. |
||
|
Name, type, and value of each variable defined for the instance. You can view the value of an XML or string variable by clicking it. You can view the value that was assigned to the process variables while the process is running and track the variable values after the process completes, terminates, or aborts. When a process is aborted, behavior of the variable tracking varies for stateless and stateful process. Latest variable values for an aborted stateless process are tracked, even if the transaction in which the variable changed might have been rolled back. For a stateful process, if an exception is thrown in a transaction block, it is rolled back and the variable values are not preserved. However, variable values prior to the transaction roll back are preserved and can be viewed. |
||
Parent-Child Navigation
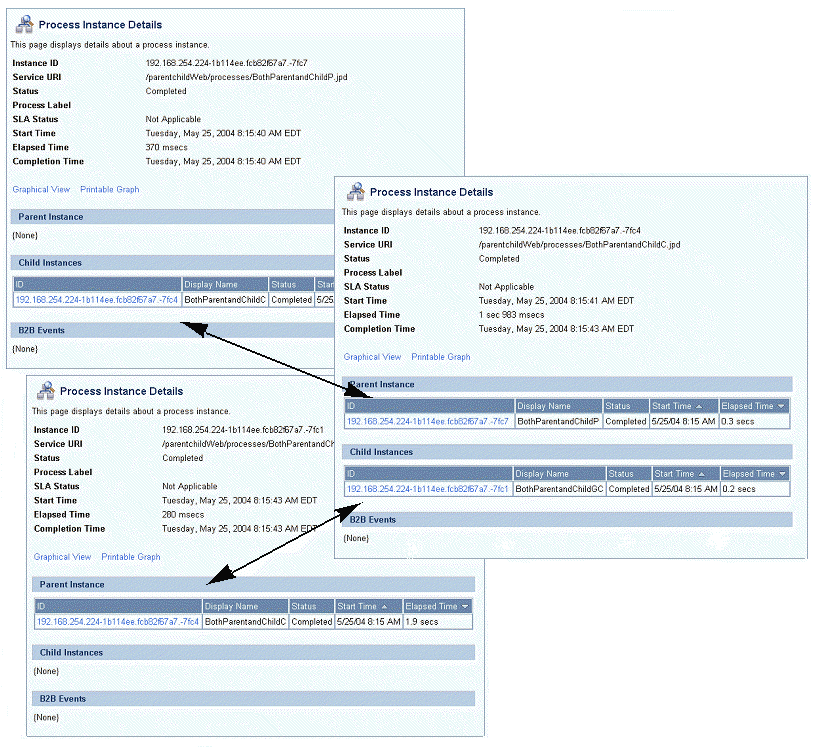
When a process instance calls another process via the Process control, the process invoked is considered a "child process." In WebLogic Integration 8.1 SP3, information about related processes was added to the Process Instance Details page. When you view the detail for an instance that has been called by another, identifying information for the calling process instance is displayed in the Parent Instance section. When you view the detail for a process that invokes one or more other instances, the information for each instance invoked is displayed in the Child Instances section.
In addition to displaying identifying information for related instances, the console also provides the ability to navigate between related instances. The following figure illustrates the parent-child navigation functionality.
Note: The parent-child navigation functionality is limited to instances invoked via the Process control. Instances started by the Service Control or Service Broker Control are not identified as child instances.
Viewing an Interactive or Printable Process Instance Graph
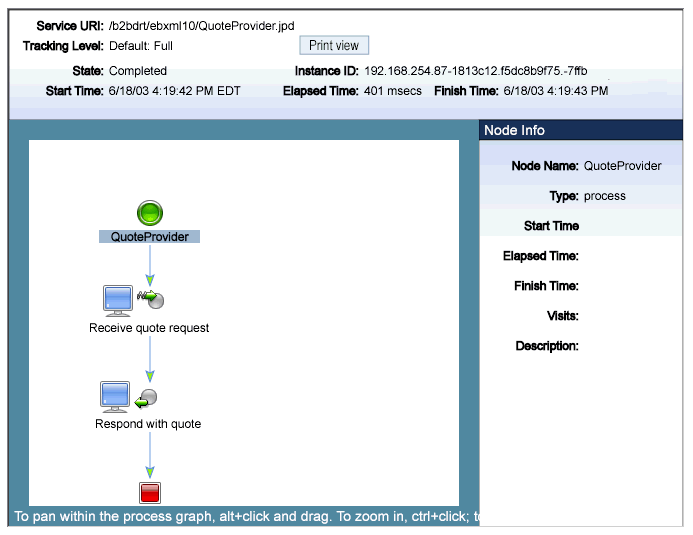
The Process Instance Details page allows you to view an interactive or printable graph of the process instance. The graph represents your business process and its interactions with clients and resources, such as databases, JMS queues, and file systems.
The interactive instance graph is a fully expanded version of the view provided in the Workshop Design View. Visual cues are provided to indicate node status as described in the following table:
The information displayed is dependent on tracking level and current state of the process.
The top panel displays selected process properties. To learn more about the properties displayed, see Viewing Process Instance Details. In addition to the properties, the commands applicable to the current state of the instance (terminate, suspend, resume, or unfreeze) are provided in the top panel. See Suspending, Resuming, Terminating, or Unfreezing Process Instances.
When you click on a node, the node name and type are displayed. If the tracking level is set to Full or Node, the start time, elapsed time, finish time, completed visits, and description are also displayed. If the tracking level is set to Minimum, this additional information is only available for the currently executing node.
To view a printable graph for a process instance:
Note: You must have Adobe Acrobat Reader installed to view the printable graph.
- Locate the process instance to view. See Listing and Locating Process Instances.
To view the interactive graph for a process instance:
- Verify that your browser meets the requirements. See Requirements for the Interactive Graph.
- Locate the process instance to view. See Listing and Locating Process Instances.
- To display node status, click the node image. The properties displayed are dependent on the tracking level set.
- To scroll the view, press and hold down the Alt key. The cursor changes to a hand
 tool. Click and drag to scroll the process graph vertically or horizontally.
 - To zoom in, press and hold down the Ctrl key. The cursor changes to a zoom in
 tool. Click to zoom in.
 - To zoom out, press and hold down the Ctrl+Shift keys. The cursor changes to a zoom out
 tool. Click to zoom out.
 - To change to a printable view, click Print View. The process graph is displayed as a PDF document.
Suspending, Resuming, Terminating, or Unfreezing Process Instances
Depending on the current state of a process instance, you can suspend, resume, terminate, or unfreeze it. The following table summarizes the available actions by instance state:
When you terminate a process, the operation in progress finishes, then the process completes without executing subsequent nodes.
A process can be designed to freeze, rather than abort, when it encounters an unhandled exception, by setting the freeze on failure property to true. To learn more see "Setting the Business Process Properties" in Designing Your Application in Building Integration Applications. This capability is useful for handling an exception due to a network outage, unavailable EIS, or other such transitory condition. When you unfreeze a process, if the condition that led the failure is still in effect, the process returns to the frozen state.
You can suspend, resume, terminate, or unfreeze an instance in the following contexts:
To suspend, resume, terminate, or unfreeze an instance from the Process Instance Details page:
- Locate the process. See Listing and Locating Process Instances.
To suspend, resume, terminate, or unfreeze one or more instances from the Process Instance Summary page:
- Display the Process Instance Summary page as described in Listing and Locating Process Instances.
To suspend, resume, terminate, or unfreeze an instance from the Interactive Process Graph:
- Locate the process. See Listing and Locating Process Instances.

