Release 12.1 V5
Part Number E37993-08
Contents
Previous
Next
| Oracle E-Business Suite Extensions for Oracle Endeca Integration and System Administration Guide Release 12.1 V5 Part Number E37993-08 | Contents | Previous | Next |
This chapter covers the following topics:
The Oracle Projects application suite includes a variety of features central to the requirements of competent and efficient enterprise project management. It enables project managers to effectively oversee their projects, assess progress against predetermined milestones and budgets, staff their projects with appropriate talent, and quickly generate a wide variety of reports. It also helps virtual and globally distributed project teams to efficiently communicate, collaborate, and complete tasks.
Oracle Projects Extension for Oracle Endeca enable you to search and filter projects and tasks, view financial, workplan and expenditure information and make updates to the plans. You can view and analyze financial and workplan information and drilldown to expense items or other information using performance metrics, charts, graphs, tables and alerts. Based on this data, project managers or controllers can take immediate action to bring their project back on track and on schedule.
This chapter provides product-specific details required to integrate Endeca Information Discovery (EID) with Oracle E-Business Suite (EBS) Release 12.1 V5 for the Oracle Projects Extensions for Oracle Endeca application. This supplements the information provided in Installing Oracle E-Business Suite Extensions for Oracle Endeca, Release 12.1 V5 (Doc ID: 1683053.1). You must read this document and make note of the requirements before you begin your installation.
Oracle Projects Extensions for Oracle Endeca updates are available from the Projects Search and Overview, the Workplan Overview, the Financial Overview, and the Expenditure Overview pages. All these page displays information and data graphically and in tabular format.
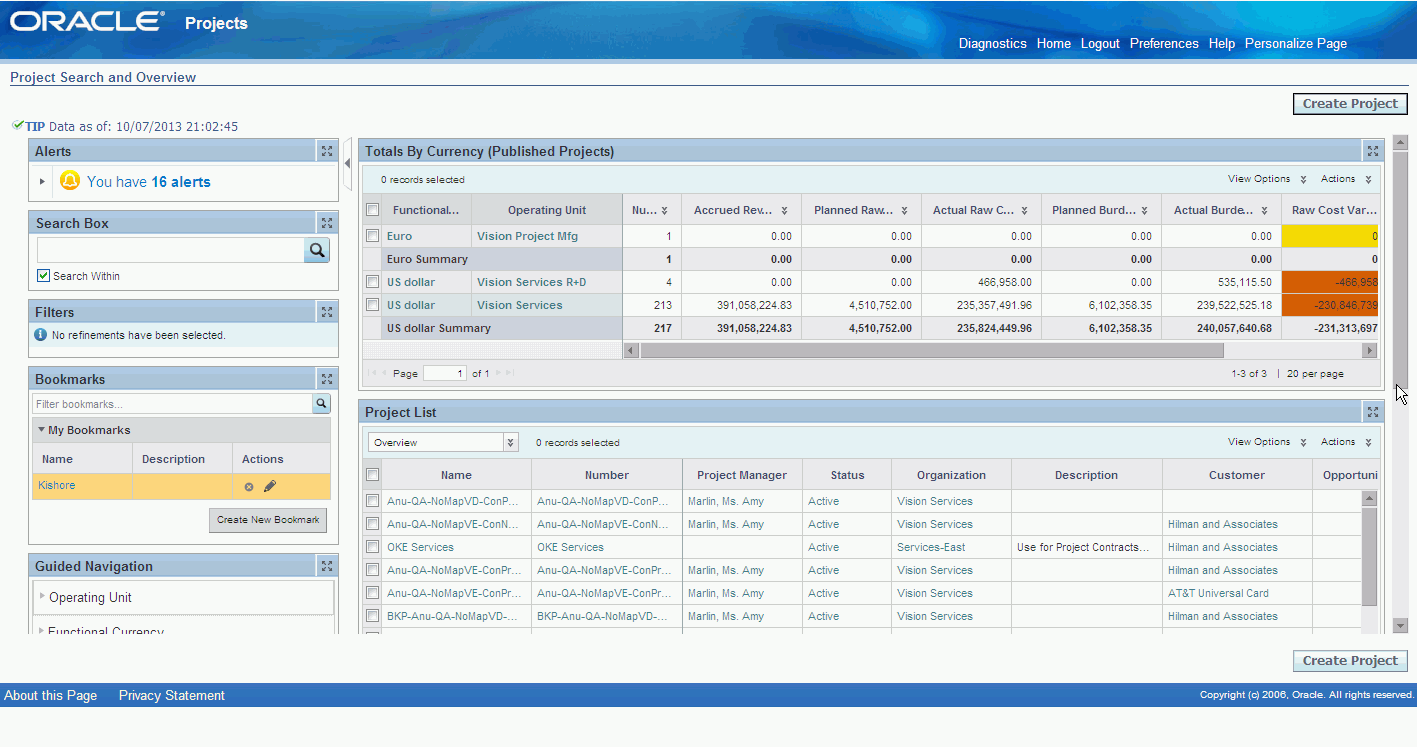
The Endeca Project Search and Overview page displays financial metrics and status information across all projects for multiple operating units and related functional currency that the user has access to. The components of the Project Search and Overview page are:
Create Project – renders the OA framework project creation page.
Portfolio Overview and Metrics – allow users to view measures across projects for multiple operating units.
Project List – provide detail information about each project grouped by column sets, including access to initiate common actions or drill into additional project information and plans
Reports – display performance information and metrics across multiple projects. The following graphic displays the Project Search and Overview page.
From the Projects Super User responsibility, navigate to the Projects:Delivery > Project Search and Overview page:

When you open the Endeca Project Search and Overview page, you can search and filter by a specific project. In addition, you can focus your review on specific projects at risk or delayed based on the metrics, charts, graphs, tables, and alerts available. The following table describes the Endeca Project Search and Overview page regions and components:
| Region | Component |
|---|---|
| Tip | This displays the date and time stamp of the last ETL update. |
| Alerts |
|
| Totals by Currency (Published Projects) |
Note: For Burdened Cost Variance and Raw Cost Variance, positive variance is displayed in green, zero variance is displayed in yellow and negative variance is displayed in red. You can choose various View Options such as:
You can also Print or Export the results of the table. |
| Projects List |
|
| Reports |
|
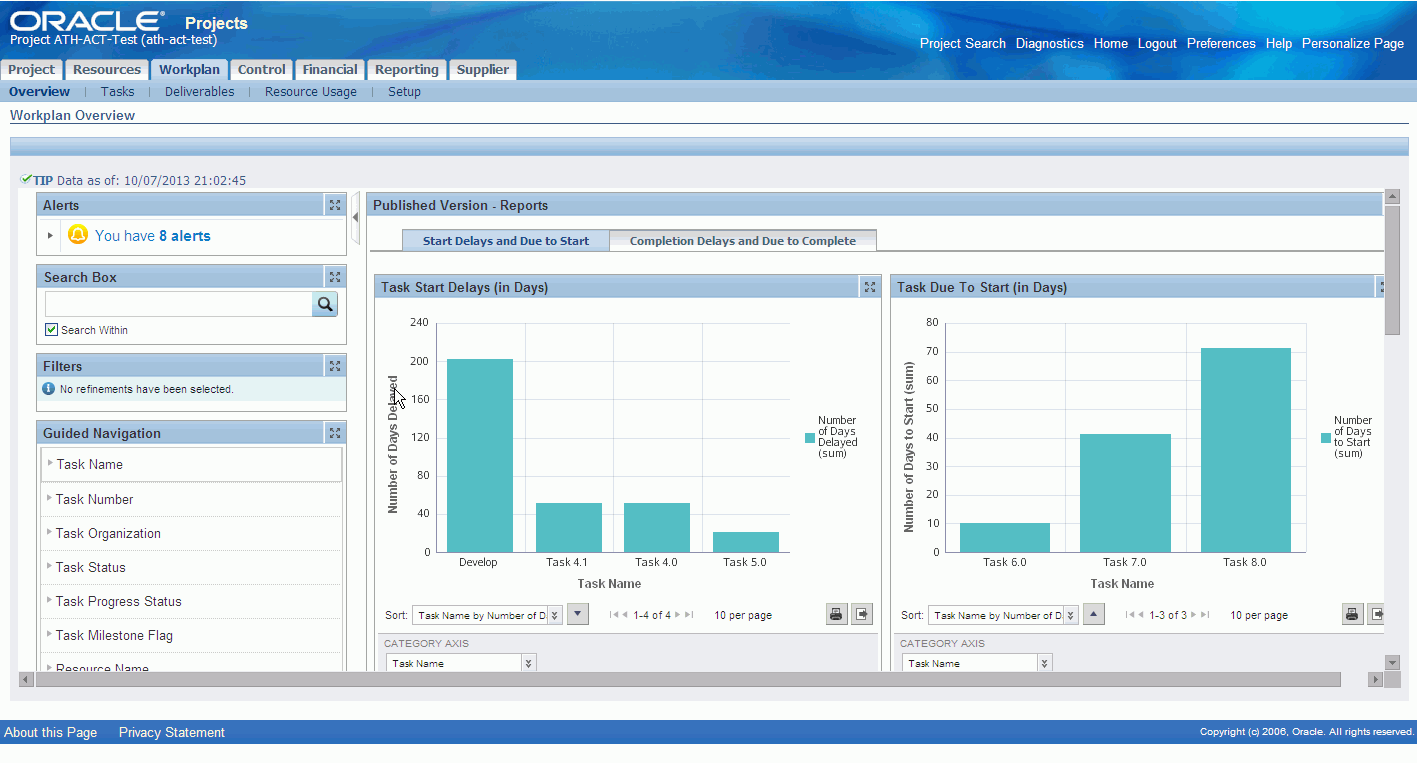
The Endeca Workplan Overview page displays financial metrics and task for a specific project. The components of the Workplan Overview page are:
Report Overview and Metrics – allow users to view project and task information such as task start delays.
Workplan versions allow users to view various versions of the workplan. The versions include current working, latest published, baselined and historical versions.
Task List – allow users to view details of the tasks.
Resource List – allow users to view details of the assignments

The Workplan Overview page contains filtering components that you can use to search, navigate and filter the data displayed in other components and consists of the following regions and components:
The following graphic displays the Workplan Overview page. There are a couple of ways to access the Workplan Overview page.
From the Projects Search and Overview page, select the Workplan icon.
You can access the Workplan Overview page for the existing Workplan tab > Overview.
| Region | Components |
|---|---|
| Tip | This displays the date and time stamp of the last ETL update. |
| Alerts | You can use alerts to direct you attention to any potential issues or risks that might arise on the project or task. There is one configurable alert:
|
| Published Versions - Reports |
|
| Current Working Version Tab |
Task List - Working:
Resource List - Working
Table View Options include:
Table Actions include:
|
| Latest Published Version Tab |
Task List - Latest Published:
Resource List - Latest Published
Table View Options include:
Table Actions include:
|
| Baselined and Historical Versions Tab | Overview:
Financial Overview
The Task List - Baseline, Resources List - Baseline, and Other Versions tables display the following details: Task List - Baseline:
Resource List - Baseline:
Other Versions
Table View Options include:
Table Actions include:
|
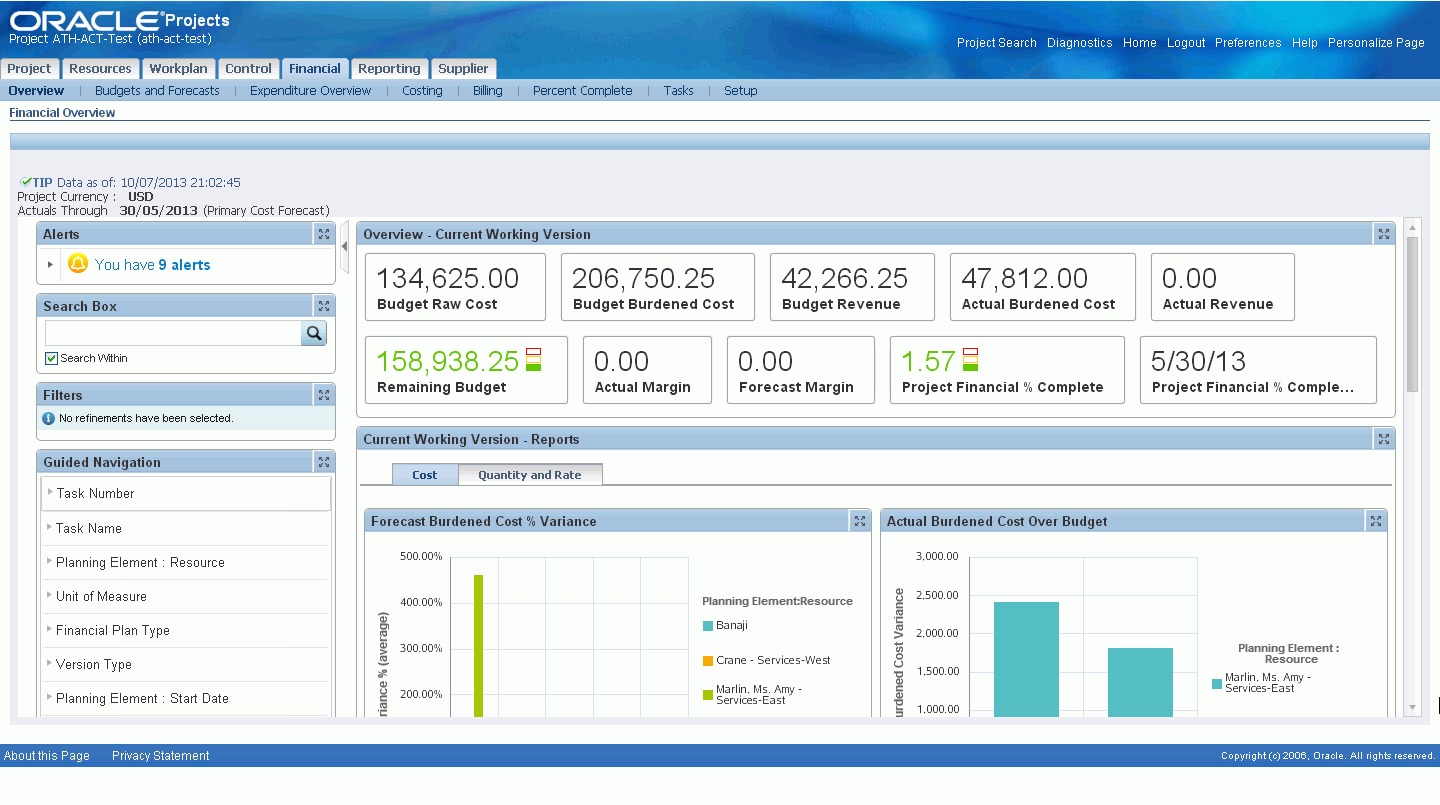
The Endeca Finance Overview page displays financial metrics and task status information for a specific project. The components of the Financial Overview page are:
Reports – Display performance information and metrics for the project or task such as Forecast Burdened Cost Variance, Actual Burdened Cost over Budget, Forecast Effort Variance, ETC Raw Cost Variance.
Task List – Display detail information about each task including access to initiate common task actions or drill into expenditure items.
Project Lines – Display detail information about each planning element grouped by column sets, including access to initiate an update to the plan line.
The Financial Overview page will display values for the project only under the following conditions:
The project has a fully shared structure
The project has workplan enabled
The project has at least one version of either the Approved Cost Budget or the Approved Revenue Budget
The project does not have any plan type that uses project-level as the lowest planning level or any plan lines in any plan type version that is planned at the project level. This is applicable only for the current working version and current baseline versions.
If the project does not meet the above criteria, then the application displays an information message in the page header, stating: The project you have selected does not meet the conditions required and cannot be displayed on the Financial Overview page. To view or modify a financial plan for budgets and forecasts, use the Maintain Versions page.
The following graphic displays the Financial Overview page. There are a couple of ways to access the Financial Overview page.
From the Projects Search and Overview page, select the Financial icon.
You can access the Financial Overview page for the existing Financial tab > Overview.

The Financial Overview page contains filtering components that you can use to search, navigate and filter the data displayed in other components and consists of the following regions and components:
| Region | Components |
|---|---|
| Tip | This displays the date and time stamp of the last ETL update. |
| Alerts | You can use alerts to direct you attention to any potential issues or risks that might arise on the project or task. There are configurable alerts:
|
| Overview - Current Working Version |
|
| Current Working Version - Reports | Cost tab
Quantity and Rate
|
| Task List | Overview
Details
Actions
|
| Plan Lines | Overview
Quantity
Raw Cost
Burdened Cost
Revenue
Margin
Actions
You can also Print or Export the results of the table. |
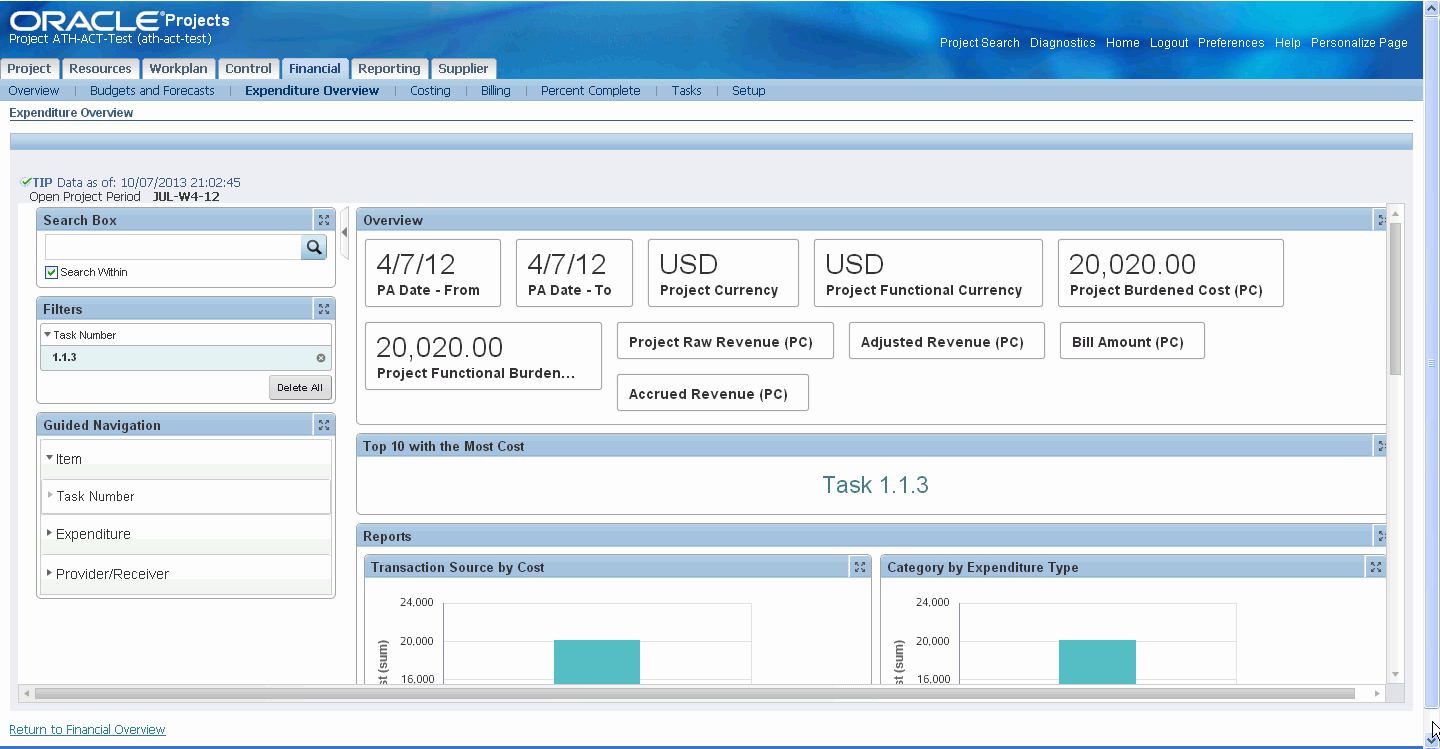
The Endeca Expenditure Overview page displays expense related information on an expense item. The components of the Expenditure Overview page are:
Expenditure Overview – Displays information on the expenditure item.
Metrics – Display the top 10 items with the Most Cost.
Reports – Display expenditure information such as Transaction Source by Cost, Category by Expenditure Type.
Expenditure Item Search Results – Display detail information about the expense including access to common expense actions or drill-down to expense item detail.
The following graphic displays the Expenditure Overview page. There are a couple of ways to access the Expenditure Overview page.
From the Projects Search and Overview page, select the Expenditures icon.
You can access the Expenditure Overview page from the Financial Overview Page via the Expenditures icon.

| Region | Components |
|---|---|
| Overview |
|
| Top 10 with the Most Cost | Displays the top 10 Transaction Source by Project Burdened Cost (cost incurred) and Expenditure Type by Category. |
| Reports |
|
| Expenditure Item Search Results | Column Sets:
The details you can view include:
|
Once you have completed installation and common configurations as described in Installing Oracle E-Business Suite Extensions for Oracle Endeca, Release 12.1 V5 document (Doc ID: 1683053.1), you must complete the Oracle Projects Extensions for Oracle Endeca product configuration setup.
See: Setting Up Oracle Projects Extensions for Oracle Endeca Integration
To set up Oracle Projects Extensions for Oracle Endeca integration, complete the following steps:
Enable JSP compilation post installation.
Note: If this is not done, then the integration between Oracle Projects Extensions for Oracle Endeca pages and the Oracle Applications framework pages will not work as expected.
See: How to Enable Automatic Compilation of JSP pages in R12 Environment Document ID: 458338.1.
Grant the Projects Endeca Access Role (UMX|PJT_ENDECA_ACCESS_ROLE) to the predefined Projects responsibility Project Super User (FND_RESP|PA|PA_PRM_PROJ_SU|STANDARD). You can also grant the Projects Endeca Access Role to any custom Oracle Projects responsibility. You can access the Oracle Projects Extensions for Oracle Endeca pages once you add the predefined role Projects Endeca Access Role to the Project Super User Responsibility responsibility (PA_PRM_PROJ_SU).
See: Oracle E-Business Suite System Administrator's Guide - Security for more information on how to assign roles.
Review the Projects Integration Security.
Set up the PA: Expenditure Data Load Start Date Profile Option to determine the list of expenditure items to be loaded. All expenditure items on or after this date would be loaded in Endeca. Ensure you set the value in the canonical date format (example: 2010/01/01).
Optionally, run the Summarization processes.
Note: You need to run this process only if the cost numbers do not match the amounts on the Workplan page.
See: Performance and Exceptions Reporting Programs, Oracle Projects Fundamentals for more details.
Schedule the set up for Full Endeca Refresh.
Schedule the set up for Incremental Endeca Refresh.
The Projects Endeca Security is based on the following criteria:
Role Based Access Control(RBAC) set up for Oracle Endeca is done.
Ensure that the user has access to at least one Projects Responsibility.
Ensure the user is part of a Projects Party associated with the project. i.e. – Planned resources, Task Managers, or Project Mangers.
Ensure that the Cross Org Update Profile set to Yes.
Ensure the Org Authority is set up.
Ensure access to the following function securities are in place:
PA_VIEW_WORKPLAN
PA_TASKS_UPDATE_DETAILS
PA_PAXPREPR_OPT_MAINT_VERSIONS
Ensure PA_ENDECA_USER_ACCESS_PRIVS_V is available.
You run the Full Load graph regularly to ensure that delete records are purged from the Endeca MDEX Server. It is recommended that you run the Full Load graph at least once as week. You can run it more frequently if required.
To set up the scheduler
Login to Integrator server using your Clover login.
Click the Scheduling tab.
Select the New Schedule link.
Enter a Description for the scheduler, for example, Projects Full Load Scheduler.
Select Periodic as the Type.
Select by interval as the Periodicity.
Enter a start date and time in the Not active before date/time field.
Enter an end date and time in the Not active after date/time field.
Enter a value in the Interval (minutes) field.
Ensure you select the Fire misfired event as soon as possible check box.
Select Execute graph from the Task Type list.
Select prj-pjt from the Sandbox list.
Select graph/Full.grf from the Graph list.
Click Create to set the scheduler.
You set up the Scheduler to load incremental graphs depending on when you update project information. For example, if you update project information frequently, you might choose to set the scheduler to load the incremental graph once in every 3 hours, or, if you do not update project information too frequently, you can set the scheduler to run once in a day.
To set up the scheduler
Login to Integrator server using your Clover login.
Click the Scheduling tab.
Select the New Schedule link.
Enter a Description for the scheduler, for example, Projects Incremental Load Scheduler.
Select Periodic as the Type.
Select by interval as the Periodicity.
Enter a start date and time in the Not active before date/time field.
Enter an end date and time in the Not active after date/time field.
Enter a value in the Interval (minutes) field.
Ensure you select the Fire misfired event as soon as possible check box.
Select Start a graph from the Task Type list.
Select prj-pjt from the Sandbox list.
Select graph/Incremental.grf from the Graph list.
Click Create to set the scheduler.
The following views are used by the ETL layer in Endeca to load and display Oracle Projects Extensions for Oracle Endeca data to the Endeca data store:
PA_ENDECA_WORKPLAN_STRUCTURES - Displays data at structural level for all structure versions under a project.
PA_ENDECA_WORKPLAN_VIEW - Denormalized view at the granular level of a task version. Includes info about project/structure and tasks. This is only for Structures (CWV,LPV and Baselined).
PA_ENDECA_WORKPLAN_ASGN_VIEW - Denormalized View at the granular level of a resource assignment including information about assignments. This is only for Structures (CWV,LPV and Baselined).
PA_ENDECA_FINPLAN_VIEW - This view provides the list of financial plan at the level of plan line information.
PA_ENDECA_EXPENDITEMS_V - This view provides the list of Expenditure Items.
PA_ENDECA_USER_ACCESS_PRIVS_V - This view determines the list of projects to which the currently logged in user has access.
![]()
Copyright © 2012, 2014, Oracle and/or its affiliates. All rights reserved.