

Chapter 12 |
Alarm Manager |
The Alarm Manager software monitors your hardware and software and notifies you, through alarms, when abnormal conditions occur. These alarms are triggered by conditions outside of preset range or by Sun Management Center rules. Default alarm conditions and rules are included in the modules. You can also set up your own alarm thresholds. For a list of Sun Management Center rules, see Appendix E.
The Sun Management Center 3.0 Alarm Manager enables you to:
This chapter describes the following topics:
Note - The messages displayed in the Alarms page of the Details window are always in English. They are not translated in other languages. However, the text in all dialog windows and in suggested fixes is internationalized.
The Alarms Manager software displays alarm information for managed objects. You can view object alarm information in an administrative domain in the Main Console and Details Alarm windows.
Pointing your cursor at the alarm icons in these windows displays an object status description.
Note - The Sun Management Center agent is configured so that only one server receives alarm information from that agent.
You can acknowledge, delete, and manage the object alarms by using the Alarms Details window. For more information, see "To Access Alarms From the Main Console Window" and "To Access Alarms From the Alarms Tab in the Details Window."
A managed object status summary is displayed in the Main Console window (FIGURE 5-1) in the Domain Status Summary. These colored icons (FIGURE 5-3) designate the severity of the alarms.
Pointing your cursor at the alarm icons in this summary displays the icon definitions.Numbers next to the alarm icons in the Domain Status Summary (FIGURE 5-3) indicate the number of managed objects for which the highest severity open, unacknowledged alarm is represented. For example, a number 1 next to the yellow alarm icon (center) indicates that there is one managed object for which the highest severity alarm is yellow (alert).
The Domain Status Summary displays the number of managed objects in the administrative domain that have at least one unacknowledged open alarm of a specific severity.
Note - If two or more types of alarms exist in the host, the color of the more severe unacknowledged open alarm is displayed in the Domain Status Summary.
If the most severe alarm on one host is critical (red) and the most severe alarm on another host is alert (yellow), you see the number 1 next to both the red alarm icon and the yellow alarm icon.
A down alarm (the black alarm icon with a down arrow in FIGURE 12-2) indicates that a service-affecting condition has occurred and an immediate corrective action is required. An example of this condition is when a resource defined by a managed object has gone out of service and that resource is required; for example, a module has gone down (exited).
A critical alarm (the red alarm icon with the vertical bar in) indicates that a service-affecting condition has developed and an urgent corrective action is required. An example of this condition is when a severe degradation in the capability of an object has occurred and the object needs to be restored to full capability.
An alert alarm (the yellow alarm icon with the slanted bar in FIGURE 12-2) indicates that a non-service-affecting condition has developed and a corrective action should be taken in order to prevent a more serious fault.
A caution alarm (the blue alarm icon with the horizontal bar in FIGURE 12-2) indicates the detection of a potential or an impending service-affecting fault, before any significant effects have occurred. Action should be taken to diagnose further (if necessary) and correct the problem in order to prevent it from becoming a more serious service-affecting fault.
A disabled alarm (the white alarm icon with a black X in FIGURE 12-1) indicates that a resource for a managed object is disabled; for example, a module is disabled.
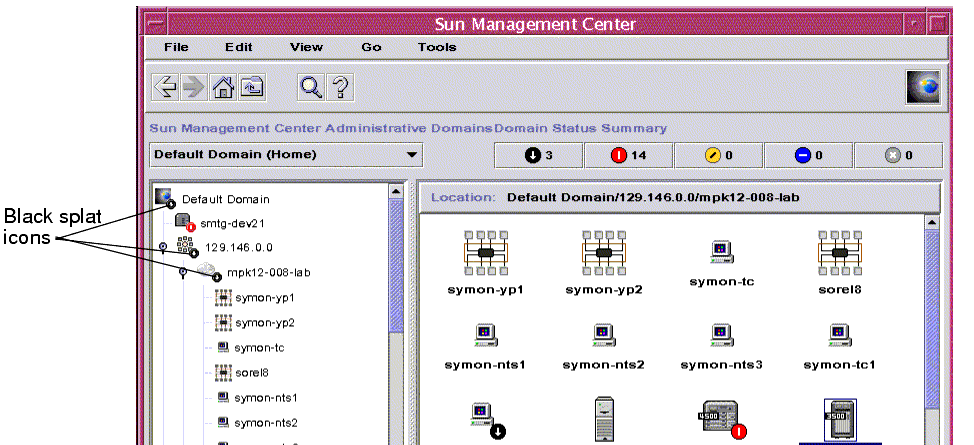
Note - Objects with black star icons that may look like a "splat" on your screen, are objects with indeterminate states, not to be confused with alarms. A black star or splat icon in the Main Console window means that a data acquisition failure occurred in that object. The failure is not the result of a rule infraction, so no alarm is associated with it. FIGURE 12-1 contains and example of the splat icons in the Browser Details window.

FIGURE 12-1 Objects With Indeterminate States Identified by Black Star or "Splat" Icon
Note - When you view the data property table for an object, a pink row is another indication of an indeterminate object state.
The Alarm Manager software alerts you to an unacknowledged open alarm condition that exists using several different methods:
The type and color of alarm icon identify the severity of the alarm. For example, a red alarm icon indicates a critical condition has developed and corrective action is required immediately. By contrast, a blue alarm icon indicates a potential or an impending service-affecting fault.
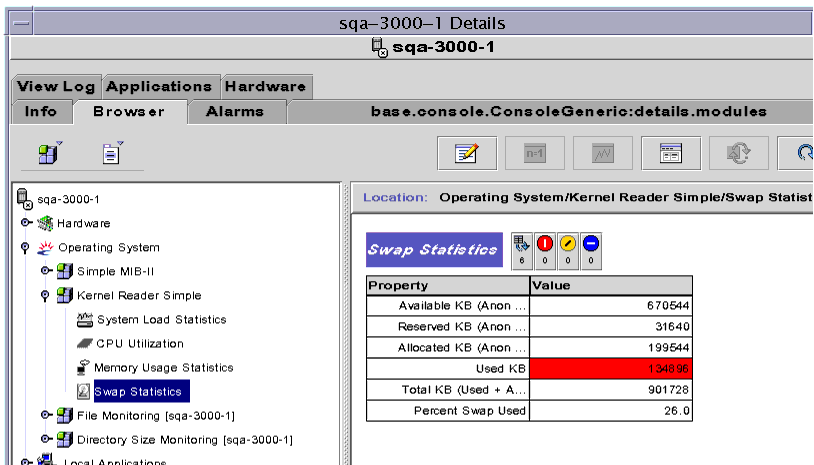
FIGURE 12-2 shows an unacknowledged, open critical alarm in the Swap Statistics properties table Used KB row. The row is red, which indicates a critical alarm.

The alarm icons are propagated up the hierarchy tree view, from the individual module up to the host. For example, FIGURE 12-2, shows an unacknowledged, open error condition (critical alarm) in the Swap Statistics icon. You see this same red alarm icon on the Swap Statistics icon, on the Kernel Reader icon module, on the Operating System icon, and the host icon.
In addition, you also see a red alarm icon on the corresponding host, group (if any), or administrative domain in the main console window unless an unacknowledged open black alarm (of higher severity) exists.
Note - Unacknowledged alarms take precedence over acknowledged alarms. If the hierarchy has two or more types of alarms, the color of the more severe unacknowledged alarm is propagated up the tree. For example, if there is a yellow unacknowledged alarm in CPU usage, and a red unacknowledged alarm in Disk Statistics, only the red alarm icon is propagated. However, if there is a yellow unacknowledged alarm in CPU usage, and a red acknowledged alarm in Disk Statistics,
only the yellow alarm icon is propagated.
 |
To Access Alarms From the Main Console Window |
| 1. | Click one of the buttons in the Domain Status Summary (FIGURE 5-1) in the Main Console window. |
| A list of objects that have at least one open, unacknowledged alarm, the highest severity of which is that of the icon on the button, is displayed in the Domain Status Details window. |
For example, if you click on the button with the yellow alarm icon (alert alarms), the Domain Status Details window displays a list of objects for which the highest severity, unacknowledged, open alarms are yellow (alert). The number of objects displayed is equal to the number on the button within approximately a five second delay period).
| 2. | Complete this procedure with one of the following actions: |
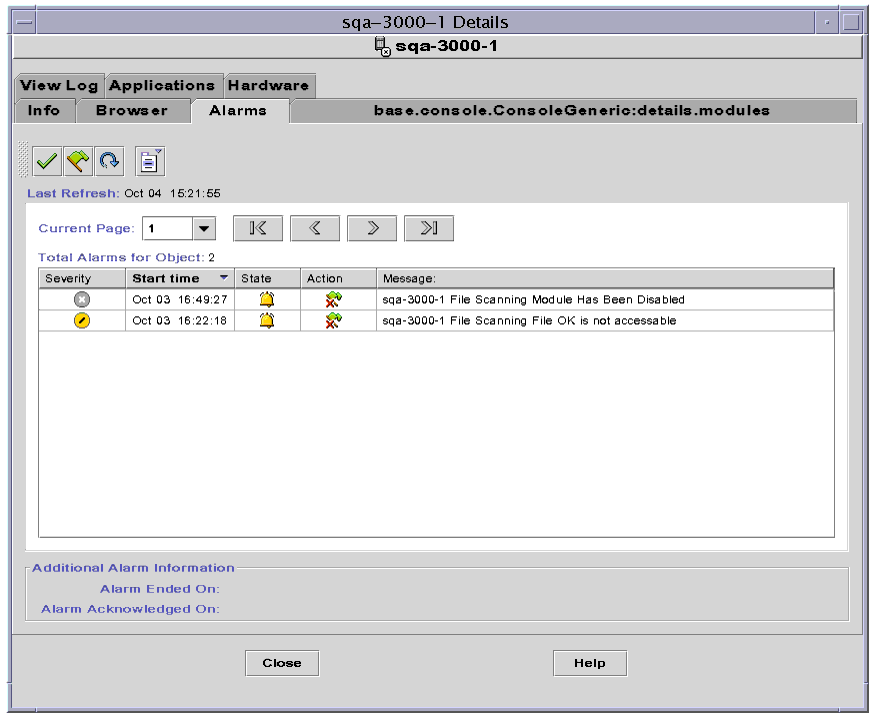
The Alarms Details window (FIGURE 12-3) is displayed.
 |
To Access Alarms From the Alarms Tab in the Details Window |
| 1. | With your right mouse button, click the selected host icon in the Main Console window and click Details in the pop-up menu. |
| The Browser Details window is displayed. |
| 2. | Click the Alarms tab. |
Note - A bold header and a down or up arrow indicate which column the table is sorted on and the sort order. The alarms table shown in FIGURE 12-3 is sorted in descending order (down arrow in Start time column) by start date and time, newest to oldest alarm. This is the default sort order for the table.

The alarms table contains a statistical summary of all alarm data for the managed object that you select.
Note - If the object is a platform, see your platform supplement for more information.
This table can be filtered and sorted to display only the information you currently want to see in the order that you want to see it. Alarms can be filtered and sorted from the alarms table. For additional details, see To Filter the Alarms Table" and "To Sort the Alarms Table."
The length of the alarms table, that is the maximum number of alarms that can be displayed on a page, is 50. The current page number and total number of alarms for the selected object in the database are displayed at the top of the table.
When new alarms occur, the currently displayed alarms table does not change, whether or not these alarms affect the current page. Instead, the Refresh button displays a two state icon. This icon indicates that new alarms have arrived and you should update (Refresh) the table to include the new alarms as soon as it is convenient.
When you delete alarms, the table is updated immediately; the deleted alarms no longer appear in the table. When alarms are deleted by another user, you may see blank rows in the alarms table. A Refresh request recomputes the pages and updates the table to remove the deleted alarms. Only one page of alarms is displayed per request. Additional pages can be seen by using the Page Navigation buttons above the alarms table.
TABLE 12-1 lists the Page Navigation information and buttons in the Alarms Details window. Informational messages inform you when the first and last pages of the table are displayed. A scroll bar enables you to scroll through each page of the table.
The alarms table presents different categories of detailed alarm information. Some of this information (TABLE 12-2) is always displayed in the alarms table.
Additional information (TABLE 12-3) is displayed on the bottom of the page when an alarm row is selected. This information is only displayed for closed and/or acknowledged alarms.
Selecting an alarm row displays any available additional information associated with that alarm. The additional information consists of the end time of the alarm, the acknowledgment date and time, and the user ID of the user who acknowledged the alarm.
A bell icon in the State column of the alarms table indicates the state of each alarm. Each alarm has two states: open and closed.
An open alarm is one in which the condition that caused the alarm still exists. A closed alarm means the condition no longer exists. Open alarm icons are "ringing"; closed alarm icons are "silent."
Each alarm can have one of three action conditions: no action, pending or executed.
No action means that an action has not been registered for that alarm. Pending action means that the action is manual and must be executed using the Run button. Executed means that the action is automatic and has already been done by the Alarms Manager software.
A three-state icon in the Action column of the alarms table indicates the status of each alarm.
| Table sorting is done in the database. Double-clicking a column header sorts the entire table in descending order according to the contents of that column. Double-clicking again reverses the sort order (ascending) and so on. |
The column headers have an down or up arrow to the right of the header. These arrows indicate the order in which the table is sorted, descending (down arrow) or ascending (up arrow). The arrow indicator and the selected column header are boldface to identify current sort order. TABLE 12-4 lists the default sort order for each header.
 |
To Sort the Alarms Table |
 |
Double-click any column header in the table. |