

Chapter 13 |
Details |
The Sun Management Center Details window provides detailed information about a selected object. The following are described in this chapter:
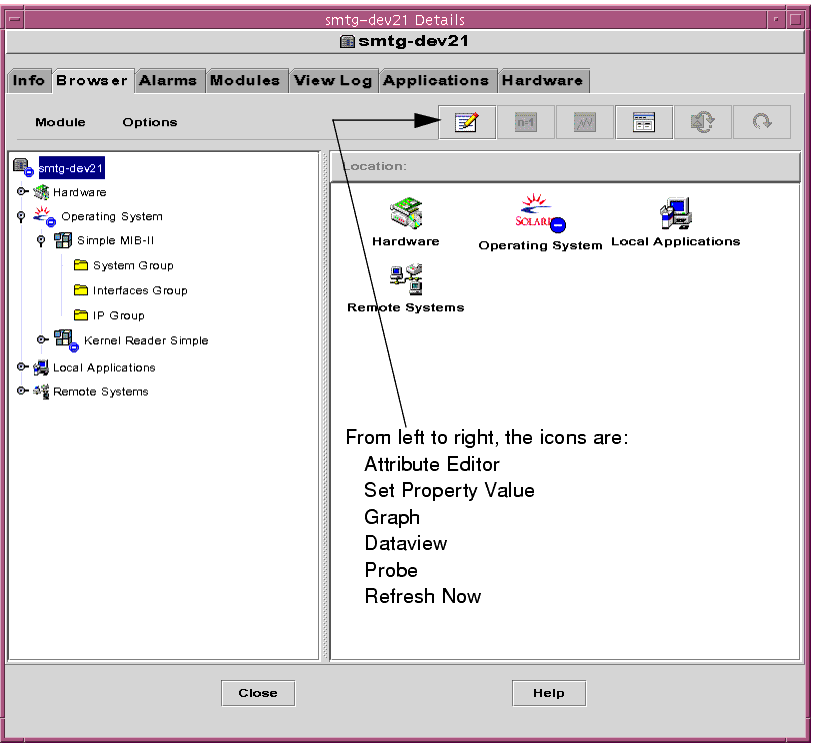
The Details window displays several tab buttons. The commonly seen buttons are shown in TABLE 13-1.
Clicking a tab button updates the window with the panel for that tab.
Note - The tabs that are displayed in the Details window are dependent on the type of object selected. For example, the Hardware tab is missing if the Config-Reader module is not supported on your system. For additional information on the tabs for your specific hardware object, see your supplement.
TABLE 13-1 Details Window Tabs Tab Button
Description
Info
Provides general information such as host name, IP address, and polling type.
Browser
Enables you to navigate through the hierarchy and contents views of the hardware, operating system, local applications, and remote systems (for navigation purposes). This view is the default view.
(The Browser is covered separately in Chapter 6.)
Alarms
Displays alarm status messages and the alarm controls for the host or node. Enables you to acknowledge or delete alarms. (Alarms are covered separately in Chapter 12.)
Modules
Displays module status - which modules are currently installed, whether they are enabled, and so on. Also displays which modules are available, but not currently installed.
View Log
Displays entries from host log files (such as system message logs).
Applications
View Processes - Displays information about processes running in the host. This is the default selected for the Applications tab.
Other applications - If you have installed custom or third-party applications, the entries for the application(s) display below the View Processes entry. Select an application and the application is displayed in the right side of the window.
Depending on your licensing agreement, this tab also provides access to the Hardware Diagnostics Suite software. You can display the Hardware Diagnostic Suite online help text by selecting the Hardware Diagnostic Suite link, and then clicking the Help button.
Hardware
Displays configuration information (resources, physical view, logical view, and dynamic reconfiguration status and controls), if available, for a host.
 |
To Start the Details Window |
| 1. | Double click the left mouse button on an object icon in either the hierarchy view or the topology view. |
| Be sure to select an object, not a administrative domain, as the Details window is not available for administrative domains. |
| The Details window is displayed (FIGURE 13-1). |

| 2. | Click a tab to view detailed information for that category. |
If information in a table cell is too long to be displayed in full, you may be able to see more information by holding the mouse pointer in the cell for several seconds. A pop-up balloon (tool tip) is displayed, showing the complete text contained in that cell.
The hierarchy can be expanded or compressed, depending on the position of the expansion/compression icon (FIGURE 6-2). The icon is compressed when the "handle" is pointing right. The icon is expanded when the "handle" is pointing down.
Click the compression icon to expand the hierarchy view ("unroll" and display more levels of detail).
 |
To Close the Details Window |
 |
Click the Close button located at the bottom of the window. |