| Solstice Enterprise Manager 4.1 Customizing Guide |
Using the Alarm Service
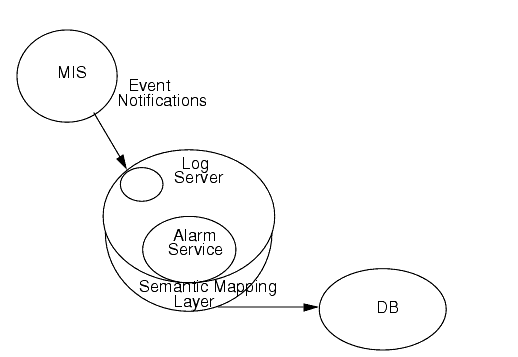
The Alarm Service is the module in the Log Server responsible for updating and storing the state of managed object instances (MOI) in the MIS. The state of an MOI is reflected in the color of its corresponding Network View node in the Network Views.
This chapter describes the following topics:
- Section 4.1 Network View Nodes
- Section 4.2 Alarm Management
- Section 4.3 The Alarm Service
- Section 4.4 Configuring the Alarm Service
- Section 4.5 Alarm Information Display in Solstice EM Tools
- Section 4.6 User-configurable Alarm Log Record Filter for Alarm Service
4.1 Network View Nodes
Network View nodes are created by users to logically model managed objects in their network environment. This is the object seen by the Network Views. Each Network View node has an attribute topoNodeMOSet which points to the managed object instances (MOI) the Network View node represents. Thus, the Network View node represents the state of the managed objects or MOI. When an alarm comes into the platform, it is against the MOI, not the Network View node.
When an alarm is received by MIS, the log server logs the alarm and the discriminatorConstruct determines whether to log the alarm or not.

FIGURE 4-1 Network View NodesThe Alarm Service is notified with the creation of each alarm log record. It maps the MOI value to the corresponding Network View node and updates the alarm counters based on severity. This triggers the severity propagation of topoNode in two ways:
- Propagates to parents, according to the attribute topoNodeParents (you can have multiple parents). This applies if topoNodePropagateUp is set to "true."
- Propagates to peers, according to the attribute topoNodePropagatePeers. This applies if topoNodePropagateUp is set to "true."
In addition, the Alarm Service keeps the topoNodeSeverity synchronized so that it represents the highest (most critical) uncleared alarm log record that is posted against the Network View node. When there are no open alarms posted against a Network View node, the topoNodeSeverity returns to its "normal" value of cleared.
4.2 Alarm Management
Alarms arrive at the MIS as event notifications. A log is a software entity that collects records (called log records) of event notifications. As many logs as you want can be created using the Event Logs. (For more information about the Event Logs, see Chapter 3. For more information on logs, refer to Chapter 6 in the Management Information Server (MIS) Guide.)
Alarms have a default log object called AlarmLog, to subscribe alarm notifications. This is the default log shipped with Solstice EM. By default, the Alarm Service monitors the AlarmLog, which includes all alarm types except for the following:
- attributeValueChange
- objectCreation
- objectDeletion
- stateChange
- Any alarm type without a perceivedSeverity
It is possible to modify the AlarmLog discriminator construct to:
- Log various other types of alarms to the AlarmLog
- Point the Alarm Service to another log or multiple logs.
For information on how to do this, see the Section 5.4 Defining the CMIS Filter.
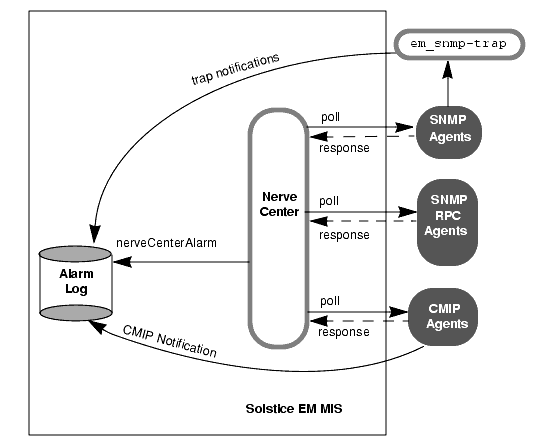
The following figure illustrates how internetAlarms and other trap notifications, CMIP notifications, and nerveCenterAlarms get logged to the AlarmLog.

FIGURE 4-2 Logging of Alarms to the AlarmLog4.3 The Alarm Service
The scenario in this section is designed to show you how the Alarm Service works. You must perform this scenario on a machine where the MIS is running locally, and the machine must be SNMP-manageable. If it is not, you must create an SNMP agent object by using the Network Views-Object Properties window. For information on the tools used in this scenario, refer to Chapter 4 in the Managing Your Network.

To Populate the MIS
1. Populate the MIS by running Network Discovery, if a runtime database does not yet exist:
Note – When using command line options, you must first source emenv.csh. At the command line, type source /opt/SUNWconn/em/bin/emenv.csh
2. Start the Alarms Window:
- In the viewer canvas, you should see a Network View node that has the name of your machine. The topoNodeMOSet attribute of this Network View node might contain:
/systemId=name:"<host>"/internetClas sId={1 3 6 1 4 1 42 2 2 2 9 2 4 1 0}/cmipsnmpProxyAgentId="<host>"- where <host> is the name of your machine. This MOI represents the SNMP agent running on your machine. The Network View node in the Network Views, then, represents the state of this agent running on your machine.
- Alarms in the system get posted against MOI. The Alarm Service maps the MOI to the Network View node representing it.
5. To see how this works, login as root, then kill the SNMP daemon on your machine with the following command:
- When the SNMP daemon is restarted, a Cold Start trap is sent by default to the local host. This causes a critical alarm to be posted against the MOI representing the SNMP agent. The Alarm Service maps this to zero or more Network View nodes (zero or more because there may be no Network View nodes with this MOI as a member of their topoNodeMOSet, or there may be many that contain this MOI in their topoNodeMOSet).
- When the alarm is posted, the icon color in the Network Views changes according to the severity of the alarm. The color of the alarm in the Alarms Window matches the color of the Network View node in the Network Views.
7. Delete the Alarm using the Alarms Window.
- Click once on the alarm in the table, then select Actions \xd4 Delete From Log.
- If there are several alarms of varying degrees against one node, the icon will appear in the color of the highest severity registered against that node.
- The key to understanding the Alarm Service is to understand that a managed object has a state. The Network Views uses icons to represent the state of the managed objects, while the Alarms Window shows the actual managed object. For example, suppose your machine has only one managed object: an SNMP agent, as in this scenario, and that there are already five critical alarms posted against this agent. If a sixth alarm of a severity lower than critical (minor, for example) were posted against this managed object, the Network Views would not reflect this alarm, because of its lower severity. The Alarms Window, however, would show all six alarms.
- Both the Network Views and the Alarms Window use the same severity mapping so that the colors are consistent.
4.4 Configuring the Alarm Service
By default, the Alarm Service monitors the AlarmLog. However, suppose you want to log some non-default alarms to the AlarmLog, or want to monitor only a specific set of alarms, and have created some additional logs in addition to AlarmLog. (You can create additional logs by using the Event Logs.) You can use the MIS Objects Object Editor (OBED) to tell the Alarm Service which log(s) to monitor.
The emAlarmServiceList object has the attribute emAlarmLogList. This attribute, by default, contains the value AlarmLog. The Alarm Service automatically monitors any log that is added to emAlarmLogList.
4.4.1 Adding Logs to emAlarmLogList
To add a logs to emAlarmLogList, you must use OBED to modify the emAlarmServiceList object.

To Add a Log using OBED
1. Click the folder next to subsystemId="EM_MIS" the selected object's subordinates are displayed.2. Double-click the listname="emAlarmServiceList" subordinate object.
- The Network Views-Object Properties window is displayed.
3. Add the logs you want the Alarm Service to monitor in the emAlarmLogList field.
- By default, the emAlarmLogList contains the following:
{ string : "AlarmLog" }- Suppose you have created a log called WarningLog. To add this log to emAlarmLogList, change the emAlarmLogList field as follows:
{ string : "AlarmLog", string : "WarningLog" }- As many logs as you want may be added in this fashion. Just be sure to separate each log with a comma.
4. Click Set when you are finished.4.4.2 Deleting Logs from the Event Logs Window
If you do not want the Alarm Service to monitor a specific log, the log must be removed from emAlarmLogList. You can remove a log by using the Event Logs or OBED.

To Remove a Log Using Event Logs
1. Select the log(s) you want to delete in the Event Logs main window.2. Select Actions \xd4 Delete from the menu bar to delete the selected log(s).

To Remove a Log Using OBED
1. Select the log(s) you want to delete in the OBED main window.
- Logs appear as a subordinate objects beneath the systemId object.
2. Select Object \xd4 Delete from the menu bar to delete the selected log(s).
- When you remove a log from the MIS, it is automatically removed from emAlarmLogList, thus eliminating the necessity to manually edit this field in the Network Views-Object Properties window.
4.4.3 Turning Off the Alarm Service
Removing all logs from emAlarmLoglist in effect turns off the Alarm Service because it will not change the topoNodeSeverity for a Network View node. However, the Alarm Service still keeps track of the MOI-to-topoNode ID mapping, in the hopes that when a log is re-added to emAlarmLoglist, there is no catching-up penalty.
4.5 Alarm Information Display in Solstice EM Tools
The following subsections explain how the Alarm Service controls the color mapping for alarms displayed in Solstice EM tools.
4.5.1 Alarm Information Display in Alarms Window
The Alarms Window does not display the alarm notifications directly. Instead, it displays the alarm log records contained in the alarm logs (for example, "AlarmLog") in a tabular format. You can specify filters to ignore unwanted alarms, association groups to summarize alarms, and sorting to prioritize alarms. The Alarms Window also monitors the alarm log for objectCreation, objectDeletion, attributeValueChange, and other events for alarm log records, updating the display as necessary.
The Alarms Window displays each row in the table in colors, based on the severity of the alarm log record. The standard attribute used to denote severity is the perceivedSeverity attribute, which is defined in ASN.1 as one of the following enumerated types: indeterminate, critical, major, minor, warning, and cleared.
The alarm record managed object classes with perceivedSeverity attributes are as follows:
- emAlarmRecord
- emInternetAlarmRecord
- nerveCenterAlarmRecord
Severity of the alarm log record is translated to a color by the user-configurable color mapping defined by the Nerve Center. The default color mapping is shown in the following table.
Normal no color Warning yellow Minor cyan Major orange Critical red Indeterminate blue Cleared grey
If you want to change the default color mapping, you must use the Severities window in the Design Advanced Requests by selecting Edit \xd4 Severities from the menu bar. This change, however, is not dynamic, meaning that you need to restart the Network Views and Alarms windows to see this change in color. For more information about changing the color mapping, see Chapter 18.
4.5.2 Alarm Information Display in Network Views
The Network Views also displays alarm information, but in a more indirect and limited way. The Network Views does not read the alarm log or wait for events for alarm log records, such as objectCreation or objectDeletion. The alarm information displayed by the Network Views are updates by the Alarm Service.
4.6 User-configurable Alarm Log Record Filter for Alarm Service
The following table compares the user options available in the Alarms Window and Network Views for processing alarm log record information.
|
Sun Microsystems, Inc. Copyright information. All rights reserved. |
Doc Set | Contents | Previous | Next | Index |