| Solstice Enterprise Manager 4.1 Customizing Guide |
Using Solstice EM for Fault Management
Fault management is the tracking and managing of critical events on your network. For example, if one of your critical network resources such as a server, link, or key application becomes inoperative or unavailable to users, you will want to be notified of this immediately.
This chapter provides you with some ideas on how to use Solstice Enterprise Manager (Solstice EM) to meet your network management goals. These methods and scenarios are not the only ways to meet your goals. The approach best suited for a given situation will depend on the particular network configuration, available network management tools, and network management priorities.
This chapter describes the following topics:
- Section 3.1 Fault Management Summary
- Section 3.2 Using Fault Management
- Section 3.3 Viewing Fault Status
- Section 3.4 Reporting Faults as Alarms
- Section 3.5 The Event Logs Tool and Alarm Logging
3.1 Fault Management Summary
Looking at the use of Solstice EM, the steps in preparing for fault management can be summarized as follows:
1. Decide on the information you need to manage your network.2. Create request templates, if needed. To create Basic request templates, use the Design Simple Request. To create Advanced request templates, use the Design Advanced Request.
- Solstice EM is shipped with a number of sample request templates. These may be sufficient for your needs. A request template is a set of commands used to obtain information about network devices, either by direct polling, initiation of a SunNet Manager event request, or by subscribing to receive incoming event notifications, or a combination of these methods. For information on using the Design Advanced Requests tool, see Chapter 18. For information on designing Nerve Center request templates, see Chapter 15 and Chapter 20. For information on using Simple Requests, see Chapter 9.
3. Use the Event Logs tool to create logs, to store those events for which you want to have a historical record and to define which events are logged to which logs.
- For information on creating and modifying alarm logs, see Chapter 5.
4. Choose the logs that you want the Alarm Service to monitor.
- The event notifications that are logged to these logs are the events that will automatically determine fault indication in the Network Views window. For information on configuring the Alarm Service, see Chapter 4.
5. Edit the SNMP trap daemon's trap_maps file to customize the mapping of SNMP traps to event notifications.
- For information on customizing the SNMP trap daemon mapping of SNMP traps to event notification, see Chapter 11.
6. If you want to implement forwarding of information from SNM Consoles to Solstice EM, use the Cooperative Consoles Configuration tool to configure the Sender daemons on the SNM machines and the Receiver tool on the Solstice EM MIS machine.
- For more information, see Chapter 7.
3.1.1 Before Starting Fault Management
Before customizing Solstice EM to perform fault management tasks, you should complete the following:
- Populate your MIS to add multiple managed objects.
- Managed objects can be added automatically or one-by-one using Network Discovery. Refer to Chapter 4 in the Managing Your Network for how you can add managed objects to your MIS.
- Configure objects representing your network according to the network management protocol and agents they support (CMIP, SNMP, or SunNet Manager (SNM) RPC).
- This is done either via the Network Discovery process, CMIP agent registration, or one-at-a-time using the Network Views-Object Properties.
3.2 Using Fault Management
Three key tools provided by Solstice EM for tracking fault status are as follows:
- Network Views
- Alarms
- Event Logs
Three important Solstice EM components that can provide you with information about critical network events are as follows:
- Nerve Center requests, which are launched from the Network Views window.
- SNMP trap daemon, which listens for traps generated by SNMP agents.
- Simple Requests, which are launched from the Viewer.
The various options available to you to set up Solstice EM for tracking fault status of devices on your network are described in this section.
The steps involved in monitoring the fault status of devices are described in Managing Your Network.
3.3 Viewing Fault Status
The Network Views window provides a window into your network that is continuously updated with the latest fault status information. Fault status is indicated by an icon changing color. The fault status of an object reflects the incoming alarms posted against that object.
Alarms differ in their severity. The severity of an event is a rating used to represent the importance or impact of the event. For example, you might regard an event indicating high memory usage of a router network being rated as less severe than an event indicating that the router not working at all.
Solstice EM provides six severities; by default, these are color-coded as indicated in the following table.
TABLE 3-1 Default Color-Coding of Severities 1 Critical Red 2 Major Orange 3 Minor Cyan 4 Warning Yellow 5 Cleared No color 0 Indeterminate Blue
The same color-coding of severities is used in the Alarms window--a Solstice EM tool that enables you to selectively view, acknowledge, and clear alarms.
3.3.1 Changing the Color Associated with a Severity

To Change the Color Associated with a Severity
1. In the Network Tools window click Network Views.2. Click File \xd4 Customize \xd4 Display Settings \xd4 Colors to open the Severities window.3. Select Alarm Severity.4. Select the color you want to use for that severity in the field.5. Click Modify.
Note – You cannot change the name or the numeric value of the severities, nor can you add or delete severities. Only integer values in the range 0 to 5 are valid severity values.
3.3.2 Alarm Severity Propagation
For container objects the propagated severity is the most severe outstanding alarm posted against the container and all its children--for example, if a container contains devices such as a host with a major alarm and also a router with critical alarm, the severity of the container will be critical, as critical is more severe than a major alarm. This severity is evaluated recursively for all containers within containers.
3.3.3 Access to Tools, Features, and Database Objects
Network Views window displays the Solstice EM tools to which you have access. Solstice EM has four levels of security:
- Tool Access
- Tool Feature Access
- Object Access
- Database Access
Tool access enables administrators to set up the environment so that certain users or groups can use or run a Solstice EM tool that has been registered with the Management Information Server (MIS).
Tool feature access enables administrators to provide or restrict access to certain features within a tool to specific users or groups. Tool and feature level access is enforced by the tool; the MIS is used only to store the list of features for each tool.
Object class or instance access enables administrators to permit or restrict access to specific managed object classes or managed object instances.
Database access enables administrators to provide or restrict access to information found in the MIS. Prompting database access allows the respective users to view summaries of log information, while users or groups with complete access can view detailed log information.
For more information about security and access levels, refer to Chapter 6 in Managing Your Network.
3.4 Reporting Faults as Alarms
The fault status of objects displayed in the Network Views window and Alarms window is controlled by the Alarm Service, which is in the topology server. The Alarm Service monitors incoming alarms posted to the AlarmLog and updates the fault status of objects to match the highest severity amongst the outstanding (uncleared) alarms posted against that object. If the Solstice EM receives four minor alarms and one critical alarm against router sledge, sledge's icon is changed to red to reflect the critical alarm. If the critical alarm is cleared, the icon changes to cyan reflecting the uncleared minor alarms. If all the alarms are cleared or purged, the icon has no status coloring--indicating that the state of the device is "normal."
The Alarm Services monitors a log called AlarmLog. When alarms are logged to this log, they automatically affect the icon color in the Network Views window.
For more information about using the Alarms window, refer to Chapter 5 in the Managing Your Network. Configuration of the Alarm Service is described in Chapter 4.
3.5 The Event Logs Tool and Alarm Logging
The Event Logs tool is the tool used to create logs to store incoming event notifications, and to define which events are stored in which logs.
The particular event types that are selected for logging to the AlarmLog and to all logs is determined by a Common Management Information Service (CMIS) filter, called a discriminator construct. You use the Event Logs tool to add or subtract event types to the AlarmLog by editing the AlarmLog's discriminator construct. (An example that illustrates how to do this is described in Creating a Separate Log for Enterprise-Specific Trap Notifications.)
Actions of the Alarms window also affect fault indication in the Network Views window. If a network administrator uses the Alarms window to clear all the outstanding alarms against router sledge, the Alarm Service changes sledge's fault status to cleared, and the Network Views window icon changes color accordingly. Thus, the Alarm Service ensures that the Network Views window and Alarms window have the same picture of the fault status of the network resources you are managing.
The types of events that you will want the Alarm Service to monitor (thus updating the color of Network Views window icons automatically) depends upon the types of network events you want to track and the management protocols you are using.
For example, SunNet Manager RPC agents (shipped with Solstice EM) have the ability to poll managed resources to check for predefined thresholds and send an event notification--called an SNM event--to the management station. This polling activity can be initiated by a one-shot message--called an SNM event request. SNM event requests can be initiated from the MIS by Nerve Center requests. (Using Nerve Center requests to initiate threshold-checking by RPC agents, is described in Chapter 17.) When an RPC agent generates an SNM event in response to threshold-checking initiated by the MIS, this arrives at the MIS as an snmAlarmEvent. There are two ways in which you might use these events:
- The Nerve Center request that initiated the RPC agent threshold-checking could subscribe for incoming snmAlarmEvents from the target device and take appropriate action in response, such as logging nerveCenterAlarms. nerveCenterAlarms are alarms created by Nerve Center requests using alarm-generating functions that can be inserted in request templates. The SNM event request templates shipped with Solstice EM, such as AdminOperStatusUp, CheckCPU, and DeviceReachablePing, use this method of handling snmAlarmEvents.
- Alternatively, the AlarmLog could be configured to automatically log incoming snmAlarmEvents. If you want to implement this, you can use the Event Logs tool to remove the entry for snmAlarmEvents from the default discriminator construct for the AlarmLog. The default log discriminator only specifies the types of events that are to be excluded from the AlarmLog. Any incoming event not explicitly excluded is logged automatically.
- Even if you do not want snmAlarmEvents posted to the AlarmLog, you might create a special log, SNMLog, to retain an historical record of incoming snmAlarmEvents. You can use the Log Network Views window to examine the contents of event logs.
For more information ...
- Managing Your Network describes the use of the Network Views window, Alarms window, and Log Network Views window in accomplishing network management tasks.
- The Alarm Service is described in this guide in Chapter 4.
- The Event Logs tool is described in Chapter 5.
3.5.1 Receiving Network Information
Information about changes in network resources are reported by agents. There are two types of event information that agents provide:
- Responses to polls--Managers can request attributes of managed objects at periodic intervals; this is called polling.
- Event notifications--Agents also typically have the ability to generate messages on their own initiative when they detect events on a resource the agent is responsible for; these messages are called event notifications.
3.5.1.1 Polling
There are two types of polling. Polling can be done directly by the Nerve Center module in the MIS, or SunNet Manager event requests can be used to offload polling to Remote Procedure Call (RPC) proxy agents. For managing large numbers of devices, fault management strategies that rely on event notifications and indirect polling by proxy agents are more efficient than direct polling because such strategies minimize network traffic and MIS processing load. (Offloading of polling to RPC agents is described in Chapter 17.)
You can deploy fault management strategies based on logging of incoming event notifications, direct polling by the Nerve Center, or threshold-checking by RPC proxy agents; or you can develop strategies that use a combination of these. Fault management scenarios that illustrate some of the possibilities are described in the following sections.
Solstice EM is shipped with a number of Nerve Center request templates which you may find helpful in developing your fault management strategy. You may find these templates useful as is, or you might modify them to better fit your network management needs.
Note – If you want to monitor large numbers of devices (for example, more than 500) for reachability, the most efficient way to do this is to activate the Solstice EM Auto Manager. For information on Solstice EM's automatic management capability, refer to Chapter 7 in the Managing Your Network.
3.5.1.2 Monitoring Device Availability
Solstice EM's Network Discovery tool provides a form of polling for device status that does not require the use of Nerve Center requests.
The main purpose of Network Discovery's Monitor function is to update the representation of your network view in the MIS. Monitor uses Internet protocols, such as SNMP and Internet Control Message Protocol (ICMP), to probe for devices that have been added to the network since Network Discovery was last run. Monitor compares the existing network view in the MIS to the results of its searches and adds objects to the MIS if new devices are uncovered.
Monitor can also be configured to query all links and interfaces represented in the MIS and generate CMIP communicationsAlarms if these network resources are not available. You can also select the severity that you want to attach to the alarms that would be generated. CMIP communicationsAlarms are logged to the AlarmLog by default when they arrive.
If the Monitor finds that a previously downed interface or link has become available, it posts a communicationsAlarm with a severity of cleared against the object. The Alarm Service changes fault status indication to reflect this, and icon color in the Network Views window changes accordingly.
By default, Monitor's "No Response" event generation capability is turned off.

To Activate the Event Generation Capability
1. Invoke Network Discovery from the Network Tools window, if it is not currently running.
- Select the Actions menu \xd4 Monitor Network option to invoke the Monitor Network window.
2. Select On for the Generate Event if Object is Down option and select a severity from the pulldown menu (shown in FIGURE 3-1).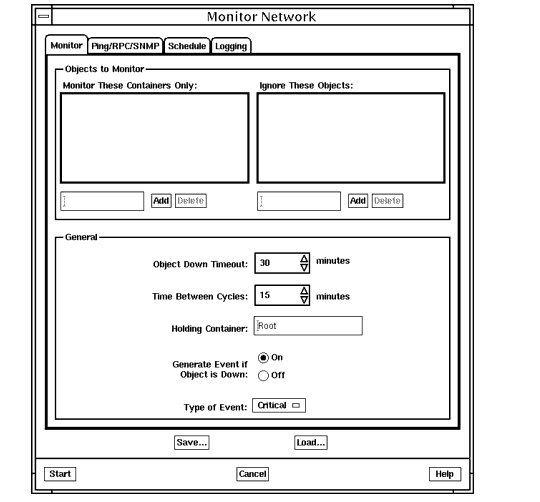
FIGURE 3-1 Selecting a Severity for communicationsAlarm Generated by Monitor3. Click Schedule tab, select the time of day and days of the week when you want the Monitor to be active. Click Start for your choices to be reflected.
- Using Network Discovery is described in more detail in Chapter 3 of Managing Your Network.
3.5.2 Event Notifications
There are two ways event notifications can be used in fault management:
- Automatic monitoring of incoming events by the Alarm Service
- Event correlation and processing by Nerve Center requests
Several types of event notifications are, by default, automatically logged to the AlarmLog when they arrive at the MIS. When these events arrive, Alarm Service monitoring of alarm logs ensure that icon color in the Network Views window is dynamically changed to reflect the severity of the alarms.
3.5.2.1 Example: Monitoring Event Notifications from CMIP Agents
In this scenario XYZ Communications Corp. is using Solstice EM to manage a cellular network. The vendor for their network components has provided AwesomeCell CMIP agents to manage switches and other network elements. The agents can be configured to generate OSI alarms, such as environmental Alarms and communicationsAlarms, when specified thresholds are crossed. This configuration is illustrated in the following figure.
When, for example, a failure occurs in a relay, the agent generates an environmentalAlarm with a severity critical. The alarm is logged to the AlarmLog and the icon for the device is colored red automatically. There is no need for a Nerve Center request or polling of the agent.
FIGURE 3-2 CMIP Management of a Cellular Network3.5.3 Using SNMP Traps
Simple Network Management Protocol (SNMP) agents also have the ability to initiate the generation of event notifications; these messages are called traps. The CMIP protocol is used by Solstice EM internally to represent all network management event information. Accordingly, Solstice EM's SNMP trap daemon (em_snmp-trap) converts incoming SNMPv1 and SNMPv2c traps to CMIP event notifications and sends them to the MIS.
By default, the trap daemon converts SNMP traps into event notifications as indicated in the following table.
These notifications are, by default, sent to the AlarmLog when they arrive. When you open the Alarms window, you can tell at a glance the types of traps that have been logged against devices in your network, as shown in the following figure.
FIGURE 3-3 Viewing Trap Notifications in the Alarms WindowSNMP trap daemon operation is illustrated in FIGURE 3-4. The SNMP trap daemon's mapping of SNMP traps into event notifications can be customized to create alarms that are tailored to your particular network management needs. For example, you can customize the severities that attach to trap notifications or create custom mappings for enterprise-specific traps based on the enterprise identifier and the specific trap type.
The trap mapping capability also allows you to more finely pinpoint the element that is the source of the alarm. You might want to represent the interface cards in a router with separate icons. You could configure the trap daemon to convert router linkDown and linkUp traps to communicationsAlarms targeted to the responsible interface. The interface icons would change color to pinpoint problems to the level of the individual interface. (Customizing the trap daemon's trap-to-event notification mapping is described in Chapter 11.)
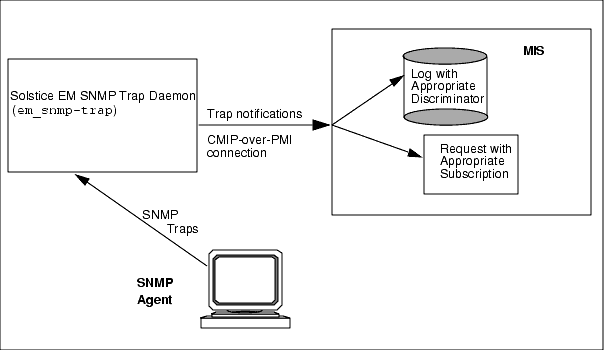
FIGURE 3-4 Solstice EM Processing of SNMP Traps3.5.3.1 Monitoring SNMP Traps with Nerve Center Requests
Nerve Center requests can be designed to receive a specified type of event notification, or events from a selected object; this is called event subscription. The request enters a subscription with the MIS to receive the specified events as they arrive. A request can subscribe for any type of event notification that has been defined in the MIS.
Event subscription requests can be used to customize your handling of incoming SNMP traps. The sample template SnmpLinkUpDownTrap, shipped with Solstice EM, illustrates this possibility. If you launch the SnmpLinkUpDownTrap request at a target router in the Network Views window, the request subscribes for incoming linkDown traps from the target device. If a linkDownTrap notification arrives, the request terminates the subscription for linkDown traps and initiates a subscription for linkUp traps. If a matching linkUp trap does not arrive from the target device within a specified polling interval, the request transitions to the Down state and logs a nerveCenterAlarm with a severity of critical. Since the critical alarm is of higher severity than the major severity of the linkDown trap, the Alarm Service sets the fault status of the device to "critical" and the device icon turns red.
The following figure shows the flow of information from traps to logs using the SnmpLinkUpDownTrap request.
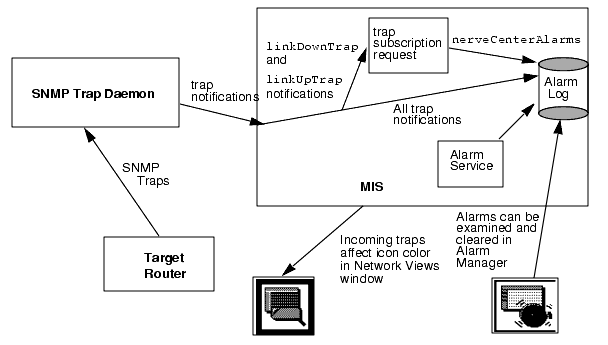
FIGURE 3-5 Example of SNMP Trap Handling Using SnmpLinkUp/DownTrap Request3.5.3.2 Creating a Separate Log for Enterprise-Specific Trap Notifications
As enterprise-specific traps may have a variety of possible causes, the default severity of enterpriseSpecificTrap notifications is indeterminate. You may want to create more meaningful alarms by customizing the SNMP trap daemon's mapping of enterprise-specific traps, or by using a Nerve Center request that subscribes for enterpriseSpecificTraps and logs nerveCenterAlarms with severities that match the cause, as indicated by the specific trap type. (An example of a Nerve Center request that subscribes for enterprise-specific traps is described in Chapter 15.)
If you do not want enterpriseSpecificTrap notifications to automatically affect the icon color in the Network Views window, edit the discriminator construct for the default AlarmLog to add enterpriseSpecificTraps to the list of excluded event types.
However, you may also want to create a separate log to store the enterpriseSpecificTraps for historical record.
Creating a separate Enterprise-specific trap event log includes two separate tasks:
1. Modifying the Alarm Log to exclude Enterprise-specific traps.2. Creating a separate log and setting the discriminator to log Enterprise-specific traps.

To Modify the AlarmLog
1. Invoke the Event Logs tool from Network Tools.2. Select the AlarmLog.3. Select Actions \xd4 Properties.
- This invokes the Event Logs properties dialog box, as shown in the following figure.
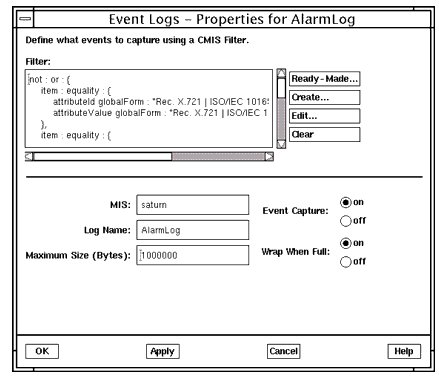
FIGURE 3-6 Viewing AlarmLog Properties in the Event Logs Properties Dialog4. To add a new CMIS filter entry for enterpriseSpecificTraps:
- Click Edit to add a new item entry for enterpriseSpecificTraps.
- Solstice EM displays the CMIS Filter dialog box as shown in the following figure.
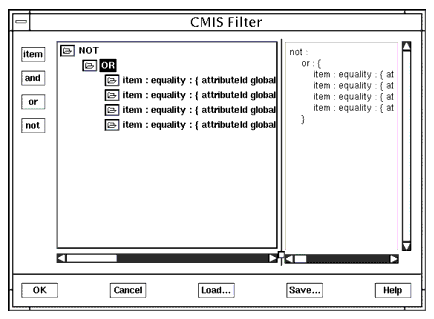
FIGURE 3-7 CMIS Filter Window- Select OR to highlight the editing buttons on the left (item, and, or, and not).
- Click the item button to display a new item window for the CMIS Filter, as shown in the following figure.
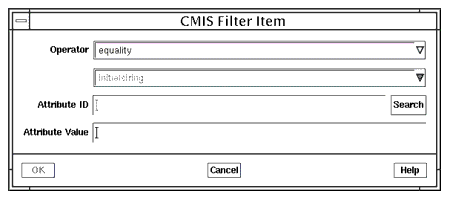
FIGURE 3-8 CMIS Filter Item Dialog Box- Enter the Attribute ID and Attribute Value.
- Click OK in the CMIS Filter Item box to add the new entry to the CMIS filter.
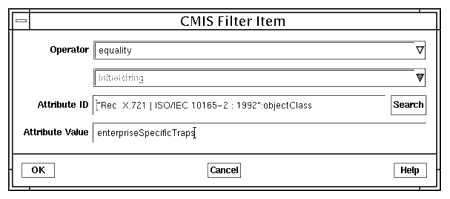
FIGURE 3-9 Adding an Item to the Default AlarmLog Discriminator- Click OK in the CMIS Filter window to modify the log discriminator.
5. Click OK in the Event Logs properties dialog box to have the changes you made to the AlarmLog to be reflected.
FIGURE 3-10 AlarmLog Discriminator Construct With enterpriseSpecificTraps Excluded

To Create a Separate Log
1. To create a new log for enterpriseSpecificTraps, select Action \xd4 Create Log.
- This invokes the Create Log window, shown in the following figure.
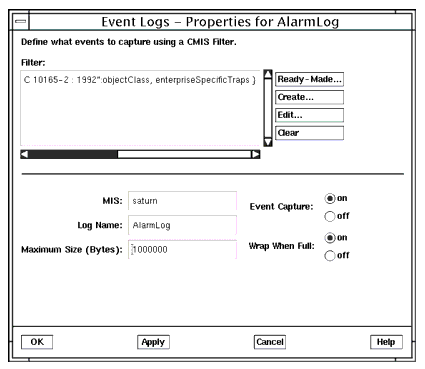
FIGURE 3-11 Creating a New Log for enterpriseSpecificTraps (will be displayed Filer pane)2. Enter the name of the new log in the Log Name field.
- If you leave the Maximum Size field as 0 (the default), there is no limit on the size. If you enter an integer value in this field, this becomes the maximum log size in bytes.
3. Select Create to build the discriminator construct for the new log.
- This invokes the CMIS Filter window.
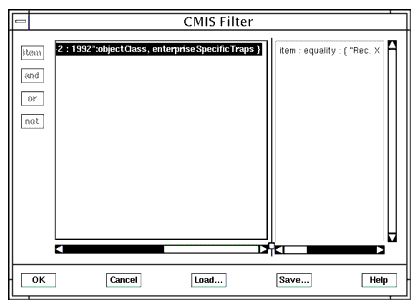
FIGURE 3-12 Specifying a CMIS Filter for enterpriseSpecificTraps
4. Select Item to create a discriminator that selects enterpriseSpecificTraps (as shown in FIGURE 3-9).
5. Enter the Attribute ID and Attribute Value.
6. Click OK in the CMIS Filter Item box to add the new entry to the CMIS filter.
7. Click OK in the CMIS Filter Item window to add the item to the CMIS filter.
8. Click OK.
9. Click OK in the Create Log window to create the new log.
If you have Site/SunNet/Domain Manager Consoles
installed in various sites on your network, this can provide
an additional source of fault status information for Solstice
EM. When RPC agents generate event notifications about
critical events, in response to threshold-checking initiated
from SNM Consoles, Cooperative Consoles can be used to
forward these event notifications to the Solstice EM MIS.
When SNM event notifications are forwarded to Solstice EM by
Cooperative Consoles, these arrive at the SNM Event Forwarder
(em_snmfwd) on the MIS machine.
The SNM Event Forwarder translates SNM's fault status
indications into Solstice EM alarm severities in the manner
indicated in the following table. The SNM event notifications
are then logged to the AlarmLog
as snmAlarmTraps.
The Alarm Service, which controls the fault status color of icons in the Network Views window, monitors the perceivedSeverity of alarms posted against a device, and sets fault status to reflect the highest severity of outstanding (uncleared) alarms against a device. (For information on changing the icon colors for the perceivedSeverity of alarms, see Section 3.3.1 Changing the Color Associated with a Severity.) Incoming snmAlarmTraps will thus affect fault status color of icons in the Network Views window. (For more information on forwarding of information from SNM Consoles to Solstice EM, see Chapter 7.)
|
Sun Microsystems, Inc. Copyright information. All rights reserved. |
Doc Set | Contents | Previous | Next | Index |