| Solstice Enterprise Manager 4.1 Customizing Guide |
Requesting Data in Solstice EM
Solstice Enterprise Manager (Solstice EM) enables you to request data from agents to monitor the status of network components and to take action in response. This proactive management of network conditions enables you to quickly find and remedy faults and enhance the performance of your network.
This chapter describes the following topics:
- Section 15.1 Polling for Data in Solstice EM
- Section 15.2 Subscribing for Events
- Section 15.3 Using Solstice EM Tools for Polling
- Section 15.4 Working with Basic Requests
- Section 15.5 Working with Advanced Requests
- Section 15.6 Building Blocks: States, Transitions, and Conditions
- Section 15.7 Designing Request Templates
- Section 15.8 Requests Based on Polling
- Section 15.9 Polling RPC Agents
- Section 15.10 Requests Based on Event Subscription
- Section 15.11 Subscribing for Enterprise-Specific SNMP Traps
- Section 15.12 Requests that Combine Subscription and Polling
- Section 15.13 Building Request Definitions
15.1 Polling for Data in Solstice EM
The architecture of Solstice EM enables you to keep informed of changes in status of network components and overall network conditions. Through multiple Solstice EM tools, you can design and customize request templates, scripts that enable a variety of different actions to be completed, each of which causes a specific event to occur. Request templates are used to poll or subscribe to an agent for data about a network component.
Polling is a means to obtain data from an agent configured for a network component. Attribute data, such as the percentage of disk capacity used, can be useful for fine-tuning the performance of your network or for locating system faults.
Solstice EM supports three ways to poll for data:
- Direct polling
- Indirect polling
- Event Request polling
15.1.1 Direct Polling
Direct polling supports Simple Network Management Protocol (SNMP) agents. The term, direct polling, refers to the ability to directly request information from an SNMP agent configured for a network component. The request is initiated from an application and is translated into an SNMP request by the SNMP Management Protocol Adapter (MPA). Direct polling is advantageous for direct communication between the SNMP MPA and the MIS. However, as the request must travel through the SNMP MPA and the MIS, the MIS can support only a limited amount of direct polls. For more information about Solstice EM architecture, including the MIS and MPAs, see the Management Information Server (MIS) Guide.
15.1.2 Indirect Polling
Indirect polling enables an SNMP agent configured for a network component to obtain attribute data from a SunNet Manager (SNM) RPC agent or proxy agent via the MIS. Indirect polling is initiated when a request generates a certain type of action, a SunNet Manager (SNM) event request, targeted at an RPC agent or proxy.
Indirect polling is more efficient than direct polling for checking thresholds on large numbers of devices because it minimizes the polling burden on the MIS and distributes the polling activity to an RPC proxy agent closer to the device being polled. (Building request templates that initiate SNM event requests is discussed in Chapter 17.)
15.1.3 Event Request Polling
Event request polling refers to setting up a Nerve Center request template to poll an agent for states and conditions of a network component. The agent configured for the network component sends the requested data to the Nerve Center of the MIS. The Nerve Center then issues instructions to the agent to complete an action depending on the data returned.
Event request polling is highly scalable because the polling is completed by remote agents. An unlimited number of remote agents may be distributed around the network.
15.2 Subscribing for Events
A message generated by an agent on its own initiative when a specified event is detected on a managed resource is an event notification. For example, a CMIP agent may generate a communicationsAlarm when a remote connection goes down.
A request template can listen for specified event notifications; this is called an event subscription. The RCL subscription functions are used to specify the type of event notification the request is to receive. The desired events can be specified by managed object, event type, or through the use of a CMIS filter. The subscribed event notifications are forwarded to the request by the MIS when they arrive. For example, if you are using the Solstice EM SNMP trap mapping capability to convert router SNMP linkDown traps to CMIP communicationsAlarms, you might design a template that subscribes for communicationsAlarms and then takes appropriate action when communicationsAlarms are received.
The MIS also generates event notifications; and, thus, a request could be defined that listens for specified event notifications from the MIS. For example, a request could subscribe for objectCreation event notifications generated when client applications connect to the MIS.
15.2.1 Combining Polling and Event-Subscription
These different ways of obtaining information about managed resources can be combined in the same request. For example, a request might subscribe for incoming linkDown traps and then use polling to count the elapsed time before the arrival of a linkUp trap for the downed router interface. If the elapsed time exceeds a certain threshold, the request might then emit a Nerve Center alarm. A sample template that illustrates this scenario is described in Section15.12 Requests that Combine Subscription and Polling."
15.3 Using Solstice EM Tools for Polling
Solstice EM provides several tools for creating requests. The following table describes each tool.
TABLE 15-1 Solstice EM Request Tools Basic Requests Enables you to set up individual or groups of requests to be sent to an SNMP agent. This tool is accessible from the Network Views Tool menu or by typing em_simplerequests at the command line. For introductory information about Basic Requests, refer to Chapter 4 of Managing Your Network.
For more complete information, refer Section 15.4 Working with Basic Requests of this book.Simple Requests Same as Basic Requests Same as Basic Requests. Advanced Requests Enables you to create, modify, and start Nerve Center request templates For introductory information about Advanced Requests, refer to Chapter 4 in Managing Your Network.
For more complete information, see Section 15.7 Designing Request Templates of this book.Design Advanced Requests Enables you to create requests to be launched against SNMP or SNM RPC agents, including specifications of states, conditions, transitions, and the poll rate. For complete information, see Section 15.7 Designing Request Templates. Request Controllers Enables you to automate Nerve Center requests to issue many requests at a time. Involves correlating a Nerve Center request template to a type of object. Each time that type of object is created, the autoManagement daemon is launched against the object to obtain its status. Accessible from the Administration tool in Network Tools. Refer to Chapter 7, "Automating Nerve Center Requests" in Chapter 7 of Managing Your Network.
15.4 Working with Basic Requests
15.4.1 Viewing Basic Request Information
You can view information about basic agent-oriented SNMP, RPC, and CMIP requests by clicking Tools \xd4 Basic Requests from the Network Views main window.

To View Basic Agent Request Information
1. In the Network Views main window, select an object associated with the agent for which you want to display request information, and then click Tools \xd4 Basic Requests to open the Basic Requests tool, as illustrated in the following figure.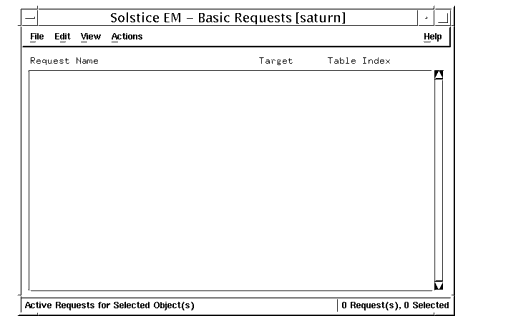
FIGURE 15-1 Viewing Request Information in the Basic Requests Main Window2. Click View \xd4 Requests \xd4 Available or View \xd4 Request Groups to view available or active requests, or request groups, as desired.
- A list of active requests, available requests (see FIGURE 15-2), or request groups (see FIGURE 15-3) is displayed, according to your choice.
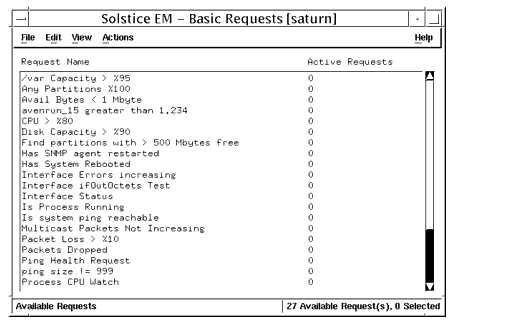
FIGURE 15-2 Viewing Requests in the Basic Requests Available Window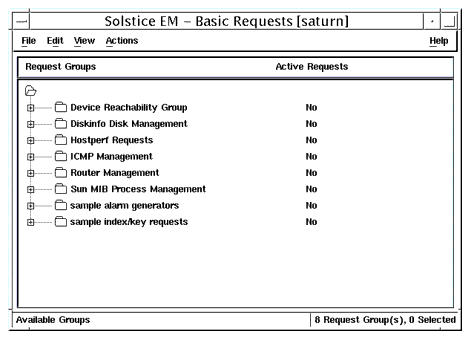
FIGURE 15-3 Viewing Request Groups in the Basic Requests Groups Window3. Select the request or request group for which you want more information, and then click Actions \xd4 Properties to display detailed information.
- In the following figure, see request for Avail Bytes < 1Mbytes as well as see FIGURE 15-5 and FIGURE 15-6.
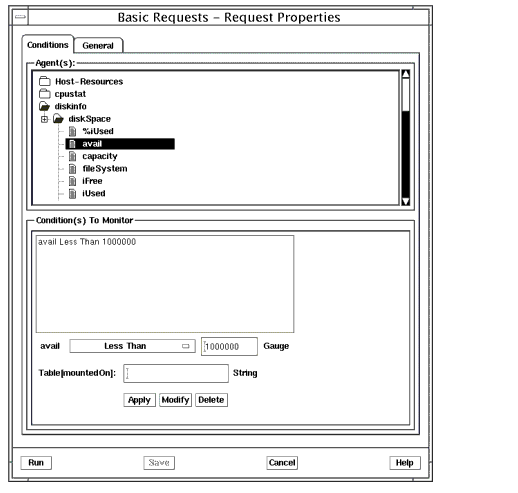
FIGURE 15-4 Basic Requests Properties Conditions Window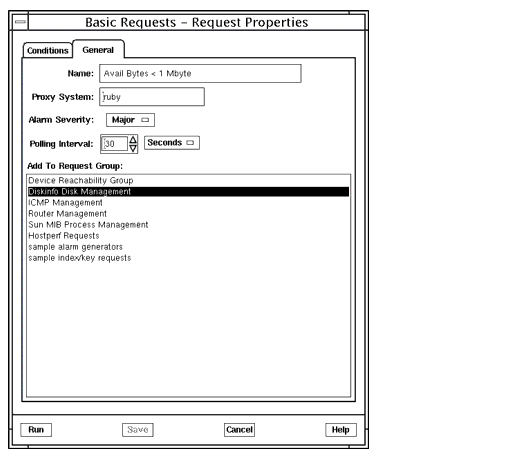
FIGURE 15-5 Basic Requests Properties General Window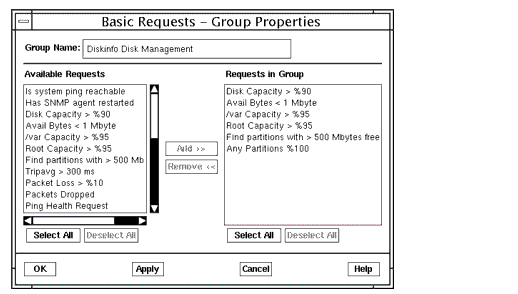
FIGURE 15-6 Basic Requests Group Properties Window15.4.2 Creating, Modifying, and Initiating Basic Requests
You can use the Basic Requests tool to start, stop, create, and modify basic requests and request groups based on agent conditions. Complete instructions for using the Basic Requests tool are provided in Chapter 4 of Managing Your Network.
To Initiate a Basic Request
1. In the Network Views main window, select an object associated with the agent for which you want to initiate a request, and then click Tools \xd4 Basic Requests to open the Basic Requests tool.2. Click View \xd4 Requests \xd4 Active Requests, or View \xd4 Request Groups to view active requests or request groups, as desired.3. Select the request you want to initiate, and then click Actions \xd4 Start.
To Halt a Basic Request
1. In the Network Views main window, select an object associated with the agent for which you want to halt a request, and then click Tools \xd4 Basic Requests to open the Basic Requests tool.2. Click View \xd4 Requests \xd4 Active Requests, or View \xd4 Request Groups to view active requests or request groups, as desired.3. Select the request you want to halt, and then click Actions \xd4 Stop.
To Create a Basic Request or Request Group
1. In the Network Views main window, select an object associated with the agent for which you want to create a request, and then click Tools \xd4 Basic Requests to open the Basic Requests tool.2. Click Actions \xd4 Create \xd4 Request or Actions \xd4 Create \xd4 Request Group, as desired, to open the Create Request or Create Group dialog.3. Specify Request or Request Group options as needed.
- Refer to Managing Your Network for complete information about the Create Request and Create Request Group options.
To Modify a Basic Request or Request Group
1. In the Network Views main window, select an object associated with the agent for which you want to modify a request, and then click Tools \xd4 Basic Requests to open the Basic Requests tool.2. Click View \xd4 Requests or View \xd4 Request Groups to view available or active requests, or request groups, as desired.
- A list of active requests, available requests, or request groups is displayed, according to your choice.
3. Select the request or request group you want to modify, and then click Actions \xd4 Properties to display detailed information.4. Specify Request or Request Group options as needed.15.5 Working with Advanced Requests
To View Advanced Request Information
1. In the Network Views main window, click Tools \xd4 Advanced Requests to display the Requests dialog.
- All available and active requests are displayed in two lists at the top and bottom of the dialog, as shown in the following figure.

FIGURE 15-7 Viewing Available Requests in the Advanced Request Dialog2. Click Start to display the selected Available Requests in the Active Requests list.3. In the Active Requests list, select the request that you want to view detailed information for.4. Click Examine to open the Request Examine dialog, as illustrated in the following figure.
FIGURE 15-8 Advanced Request Examine Window15.5.1 Creating, Modifying, and Initiating Advanced Requests
You can use the Network Views Requests dialog to start and stop requests based on existing request templates. You can also use the Requests dialog to open the Request Designer tool, from which you can perform a full range of request management tasks.
To Initiate an Advanced Request
1. In the Network Views main window, click Tools \xd4 Advanced Requests to display the Requests dialog.2. Select the request you want to start from the Available Requests list.3. Select the target object(s) in the current view, and then click Start.
- Alternatively, you can use the middle mouse button to drag a request from the Available Requests list and drop it on an object in the Network Views window.
4. Repeat Steps 2 and 3 for each request you want to initiate, or click Close to exit the Requests dialog.
To Halt an Advanced Request
1. In the Network Views main window, click Tools \xd4 Advanced Requests to display the Requests dialog.2. Select the request you want to halt from the Active Requests list.3. Click Delete.
- The request template itself is not deleted from the MIS; only the particular request object instance based on the request template is deleted.
4. Repeat Steps 2 and 3 for each request you want to halt, or click Close to exit the Requests dialog.
To Create or Modify an Advanced Request
1. In the Network Views main window, click Tools \xd4 Advanced Requests to display the Requests dialog.2. In the Requests dialog, do either of the following:
- If you want to modify a request, select the request from the Available Requests lists, and then click Modify.
- If you want to create a request, click Create.
- In both cases, the Request Designer (em_reqedit) is opened.
3. In the Request Designer, modify or create requests or request templates as desired.15.6 Building Blocks: States, Transitions, and Conditions
A request template is comprised of a finite number of states and transitions between states. States in a request are used to represent the presumed state of a managed resource, as indicated by information available to the request. For example, if a request is polling to determine if a device is up or down, then, clearly, two states you would want in such a request would be Up and Down, to represent these possible states of the device. If the request is in the Up state when the device fails to respond to a poll, then you will want the request to move to the Down state to indicate this change in the state of the device. A move from one state to another in a request is called a "transition".
A state can also loop back to the same state in a transition. For example, if a request is in the Up state and a poll indicates the target device is still up, passing this test may cause the request to loop back to the Up state.
Note – The "severities" that attach to template states in the Design Advanced Requests do not control the fault status indication (icon color) of devices in the Network Views; severities of states only affect the color attached to states in the Design Advanced Requests's graphical display. Fault status color of devices in the Network Views is determined by the alarms logged against those devices. If you want the fault status color of icons to change when a request transitions from one state to another, you can control this using RCL alarm-emitting functions. This is discussed below in Controlling Fault Status Color.
In designing a template you will need to specify when each transition should take place; this is done by selecting a condition that defines when the transition is to occur.
A condition is made up of instructions written in Request Condition Language (RCL). You assign a name to a condition when you save it in the Design Advanced Requests. Saving a condition stores it in the MIS for use in templates. A condition can be used to define when a transition from state A to state B is to occur. If you want a request to move from Up to Down, for example, when a target system is not reachable, you will need to use a condition that tests for that circumstance to define the transition.
Nerve Center checks conditions in the order they occur in the template. To use a condition to define when a transition is to occur, the condition must evaluate to true or false when checked by the Nerve Center.
A condition that defines a transition is evaluated only if the current state is "awake." The current state is awake only if one of the following occur:
- The request has received an incoming event notification.
- The condition attempts to access an attribute.
For example, if a request subscribes for coldStartTraps and the condition defining a transition tests for the arrival of an event, an incoming coldStartTrap will "wake up" the state and the condition is then evaluated.
15.6.1 State Machine Diagrams
A representation of a finite set of states, and the possible paths between those states, is a finite state machine. Before you start building a request template, you may wish to draw a state machine diagram in which you show the various device states you want to represent, the paths between them, the types of information that the request is to make use of to determine when to make each transition, and the actions that you want the request to take when it makes a transition (for example, emitting an alarm or sending an email message).
A state diagram shows how a request template works. The following figure shows a simple example that illustrates request-related concepts.
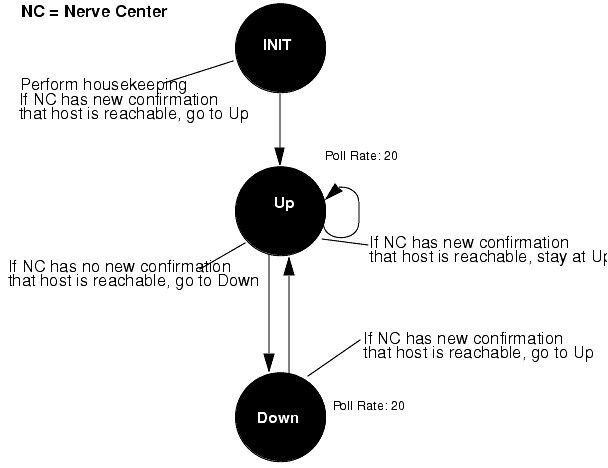
FIGURE 15-9 Request Example with Poll RatesThe following figure is a state diagram for an example request template that adds the "Missed" and "InitComplete" states to the template in FIGURE 15-9.
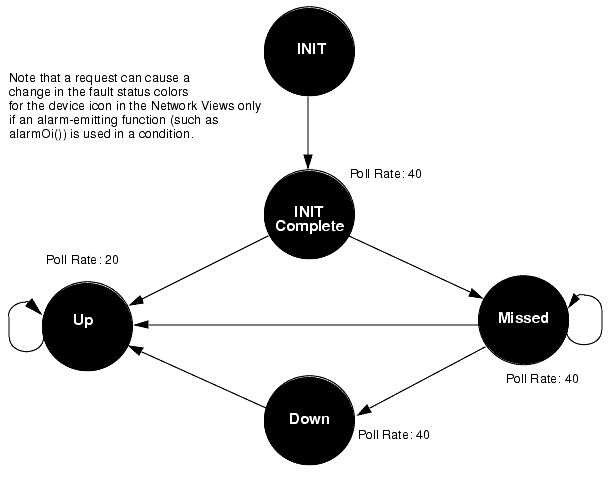
FIGURE 15-10 Request Example with Poll Rates and SeveritiesThe following figure shows the same template as shown in FIGURE 15-10 with the conditions associated with each transition.

FIGURE 15-11 Request Example with ConditionsIn FIGURE 15-11, the conditions are described in English. In an actual request template, you define conditions in the Request Condition Language.
15.6.2 Sample Request Template
FIGURE 15-12 illustrates the workings of a sample request template IsSnmpSystemUp, which is shipped with Solstice EM. This template does what its name suggests: It tells you whether the SNMP daemon is running on a target machine. You can use this template as the basis for additional templates. For example, you might add a "Missed" state, as illustrated in FIGURE 15-11.
Condition names are user-created; they are not pre-defined in RCL. Conditions are saved in the MIS under separate names to make it possible for you to use the same condition in multiple requests. The AlarmCriticalOi condition, for example, logs a nerveCenterAlarm with a severity of critical. This is a condition that you may want to use in a wide variety of request templates.
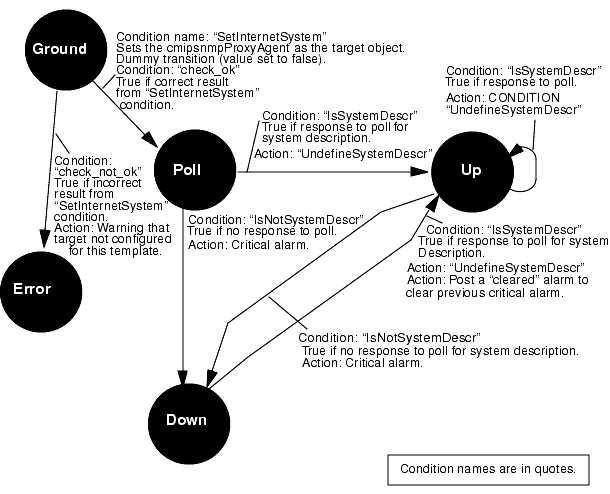
FIGURE 15-12 IsSnmpSystemUp Sample Request TemplateIn the Design Advanced Requests' graphical display, the "IsSnmpSystemUp" request template is displayed much as it appears in FIGURE 15-12, without the condition code. You can infer much of the essential work in building a template from the figure:
- create states
- define transitions between states
- specify a condition for each transition
- specify actions to take place for each transition, if needed
The IsSnmpSystemUp template (FIGURE 15-12) has five states: Ground, Error, Poll, Up, and Down.
15.6.2.1 Setting the Target Managed Object
The initialization of the template takes place in the transition from Ground to Poll. The first step in initializing the request is to set the target of the poll.
When you launch a request against a device selected in the Network Views, Nerve Center places all of the managed objects configured for the device into the system variable $pollFdnSet. "Managed objects" are internal representations in the MIS of the agent capabilities supported by the device. If you configured Network Discovery to search for RPC-based SunNet Manager agents when you populated your MIS, devices that have both SNMP and RPC agents are configured in the MIS to indicate this. Fully distinguished names (FDNs) pointing to these managed objects in the MIS are thus loaded into the $pollFdnSet variable when you launch requests against such a device.
Nerve Center uses another system variable -- $pollfdn -- to hold the target of the request. When a request is launched, Nerve Center initially sets $pollfdn to the first FDN in $pollFdnSet. However, the first agent name in $pollFdnSet may not be the appropriate agent to support this particular request.
The task performed in the template's initialization is thus to check $pollFdnSet to determine if the device is configured with the agent capability appropriate for the request, and, if so, to set $pollfdn to the appropriate object from those contained in $pollFdnSet. The IsSnmpSystemUp template, for example, must be targeted at a device that supports SNMP, and $pollfdn needs to be set to point to the cmipsnmpProxyAgent object, which represents the SNMP agent system. Thus, the SetInternetSystem condition searches through the FDNs contained in the $pollFdnSet for the target device to find a match on "cmipsnmp". If no match is found, then the request knows the device is not configured appropriately for this template.
The SetInternetSystem condition uses an RCL WHILE loop to accomplish this. The WHILE loop needs to loop for as many times as there are objects in $pollFdnSet. The RCL numElements() function is used to discover how many objects there is:
If SetInternetSystem does find a match on "cmipsnmp", it uses the RCL AppendRdn() function to set the target for the poll to the SNMP RFC 1213 internetSystem group object "contained" under the default cmipsnmpProxyAgent, which represents the agent system:
Note that the condition ends with the statement "false;". This guarantees that this condition will not cause a transition to another state. This is to ensure that the next transition out of the Ground state in the template is not passed over but is evaluated. If the Boolean variable $res is false at the end of the SetInternetSystem condition, we know that the request has been targeted at a device that is not configured with a cmipsnmpProxyAgent.
You may want to warn the user when this happens. In the IsSnmpSystemUp template, the check_not_ok condition checks for $res having a value of false, and causes a transition to the Error state if this occurs. A warning alarm is posted, indicating that the target device is not configured properly for this template.
Thus, we see that there are three phases to initialization in the IsSnmpSystemUp template:
- Determining if the target device is configured with the appropriate agent support for this template
- Setting $pollfdn to point to the appropriate managed object
- Transitioning to an Error state (and sending an appropriate warning) if the search of $pollFdnSet indicates the device is not configured with the appropriate agent support
15.6.2.2 Polling for an SNMP Attribute
The internetSystem group contains the system description (sysDescr) attribute. If the Nerve Center can obtain the value of this attribute from the agent, the IsSnmpSystemUp request knows that the agent is running. The IsSysDescr condition, which checks for the value of the sysDescr attribute, is therefore used to define the transition to the Up state. This condition contains the following code:
The defined() function can be used to poll for any attribute that has been defined in the GDMO document for the target managed object. If you try to add a condition that refers to an attribute that is not defined in a GDMO document that has been loaded into the MIS, the Design Advanced Requests displays an error message and the condition is not saved to the MIS. (You can use the SNMP Data application to examine the attributes and groups supported by GDMO documents that the MIS knows about.)
If the target object's sysDescr attribute value does not already exist in the memory space allocated for the running request, the Nerve Center retrieves the attribute from the agent. But the Nerve Center does not attempt to retrieve the attribute if a value for sysDescr already exists. This is why the UndefineSysDescr condition is invoked as an action after each transition. UndefineSysDescr contains the following RCL statement:
This removes the attribute sysDescr from the memory allocated to the running request, forcing the Nerve Center to access the remote agent each time a new defined(&sysDescr) is called.
15.6.3 Controlling Fault Status Color
Your network topology is represented in the Network Views by icons once you have populated the MIS. The objects you are viewing are called topology nodes. Each topology node has an attribute, topoNodeSeverity, that represents the fault status of the device. When the value of this attribute changes, the icon changes color to represent a change in the fault status of the device. The setting of the fault status of topology nodes is controlled by the Alarm Service -- a module in the MIS that tracks incoming alarms posted to the alarm log. The Alarm Service keeps a tally of the perceivedSeverity values of all outstanding (uncleared) alarms logged against each topology node. The Alarm Service sets the fault status indication of a topology node to match the highest perceivedSeverity value amongst the outstanding alarms against the device.
Corresponding to each device represented in the Network Views are objects in the MIS--called managed objects (MOs)--that represent the agent capabilities supported by the device. For example, a cmipsnmpProxyAgent object in the MIS represents a remote SNMP agent. There may be multiple managed objects that correspond to a single topology node. For example, host bigiron may be configured in the MIS to indicate that it can support both SNMP and RPC management.
Incoming alarms are logged against the managed objects, not the topology node. However, each topology node has an attribute, topoNodeMOSet, which contains a set of fully distinguished names (FDNs) that point to the managed objects configured for that device. The Alarm Service uses this list of managed objects to match incoming alarms to devices represented in the Network Views.
When a request is launched against a selected device in the Network Views, the topology node's list of managed objects (topoNodeMOSet) is loaded into the RCL system variable $pollFdnSet. Thus, if you want to use the RCL alarm-logging functions to change the fault status color for the device in the Network Views, you need to ensure that alarms are logged against one of the objects in $pollFdnSet. When the request is initially launched, the RCL variable $pollfdn is set to point to the first object in $pollFdnSet. Therefore, the easiest way to post alarms against the target device is to log alarms against $pollfdn. The RCL alarm() and alarmStr() functions automatically post alarms against $pollfdn.
However, this approach will work only if you do not reset $pollfdn in the template to point to some other object. Notice, for example, that the SetInternetSystem sample condition resets $pollfdn to point to the RFC 1213 internetSystem group under the SNMP agent. And the internetSystem group object is not a member of $pollFdnSet. Therefore, if alarmStr() were then used to post alarms, they would not affect icon color because the Alarm Service would not be able to match that object to a topology node.
However, RCL provides another alarm-logging function, alarmOi(), which allows you to specify the managed object the alarm is to be posted against. Also, note that the SetInternetSystem condition saves the original value of $pollfdn in the variable $save_pollfdn. Thus, an alarm can be posted against the device by passing $save_pollfdn to alarmOi(). For example, we could post a minor alarm with the condition:
$info = StrToAsn("EM-NC-ASN1.NerveCenterAlarmInfo","{3,minor,\"Device is up after being down\",3,1}");alarmOi($save_pollfdn,$info);In this example the ASN.1 alarm type (a Nerve Center alarm), and the ASN.1 values of the alarm attributes, are derived from their text equivalents using the strToAsn() function. The ASN.1 values are then passed to alarmOi(). The curley braces ("{","}") indicate the set of attributes that are to make up the Nerve Center alarm that is posted by alarmOi(). The first value (3 in this case) is the probableCause, the second value (minor) is the perceivedSeverity of the alarm, the fourth value is additionalText (which is an optional attribute). The last two values (mosiState and mosiSeverity) are not significant.
15.6.3.1 Using alarmOi() to Clear Previous Alarms
Also, note that if a critical alarm had been logged by our request before logging a minor alarm, using the condition in FIGURE 15-14, this minor alarm will not cause the icon to change to cyan unless we first log a "cleared" alarm to clear the previous critical alarm. The Alarm Service always sets the fault status color to the highest severity of uncleared alarms. No matter how many minor or warning alarms are logged, the icon remains red if there is a single uncleared critical alarm against the device. We could clear the previous critical alarm with the following condition:
"{1,5,\"Device is up\",3,1}");Note that, in the above example, the probableCause value (the first value in the set of ASN.1 values making up the alarm) has been set to 1 in the clear alarm--the same probableCause value used in the critical alarm. For an alarm to clear a previous alarm, it is necessary that the probableCause value of the clear alarm match the probableCause value of the alarm being cleared. If the alarm() or alarmStr() functions were used to log nerveCenterAlarms, the probableCause is automatically set to a value that matches the severity of the alarm. For this reason, only the alarmOi() function can be used to log alarms that clear previous alarms.
For templates that subscribe for incoming event notifications, alarms can be targeted to the appropriate device by using the RCL $eventOi variable. $eventOi points to the managed object that is the source of the event. Before calling the alarm() or alarmStr() functions, you could set $pollfdn to point to the managed object that is the source of the event:
15.6.3.2 Alarm-logging Tips
We can summarize the alarm-logging considerations discussed here as follows:
- Event notifications must have a perceivedSeverity value to affect fault status color. Alarm Service uses the highest outstanding severity to determine fault status. If you want an icon to change to indicate a lower severity after your request has posted a higher severity alarm, your request should first clear the higher severity alarm.
- To affect fault status color, alarms must be logged to the alarm log monitored by the Alarm Service (by default, this is the log called AlarmLog). The RCL alarm-logging functions (alarm(), alarmStr(), and alarmOi()) can be used to log nerveCenterAlarms to the alarm log.
- If your request template resets $pollfdn to point to a different object, you may want to save the initial value of $pollfdn in another variable for use in alarm-logging. The functions alarm() and alarmStr() automatically post alarms against $pollfdn. If you have reset the value of $pollfdn, you can use alarmOi() to post alarms against a particular managed object.
- If you want to log an alarm to clear a previous alarm, you must use alarmOi() and set the probableCause value of the clear alarm to match the probableCause of the alarm it is clearing. If the previous alarm was logged using alarm() or alarmStr(), its probableCause value is the same as its severity.
- The managed object that is the source of an incoming event can be obtained using the RCL $eventOi variable. This can then be passed to alarmOi() to log a nerveCenterAlarm against that object.
For more information...
You may want to consult the following chapters in this guide:
- Chapter 4 Using the Alarm Service"
- Chapter 14 Nerve Center Overview"
- Chapter 18 Building Advanced Requests"
- Chapter 20 Request Condition Language"
- Chapter 22 RCL Functions"
15.7 Designing Request Templates
Before embarking on building a request template from scratch, use the Design Advanced Requests to examine the sample request templates supplied with the product. You may be able to use a template as is, modify a template, or use one or more of the conditions that are used in the sample templates. See the following subsection for a procedure for creating a template from an existing template.
To Create a Request Template
1. Design a state machine: draw a picture for yourself showing the states you want to monitor and the paths between those states.
- Make note of conditions that would cause movement from one state to another.
2. Invoke the Design Advanced Requests, as described below.
- All the following steps involve the use of the Design Advanced Requests.
3. Create the states you need.
- States are specific to each template, that is, you have to create new states for each template.
4. Create the conditions you need.
- You are supplied with a number of conditions. Conditions are reusable across all request templates. You may wish to develop a library of conditions that can be used in multiple templates.
5. Create the transitions from one state to another.
- Transitions are specific to each template and are executed in the order in which they appear in the template.
6. Name the request template and enter a brief description of it.7. Save the template.
Note – You can save an incomplete template, to continue work on it at a later date, through the Design Advanced Requests' Template \xd4 File \xd4 Export Current option. Use the Template \xd4 import option when you want to reload that template into the Design Advanced Requests.
With a template created, you can invoke the Advanced Requests window from the Network Views's Tools menu and start requests using that template against target managed objects.
The bulk of the work in building a new request template is in the design of the template and in the coding of the conditions for the template. You should design your template before you invoke the Design Advanced Requests, although you can use the application's graphical display as your drawing board. We recommend composing your conditions in the Design Advanced Requests, because the application tests the syntax of your condition code when you attempt to save it.
With your design and a set of conditions in place, the putting together of a request template is a simple matter of moving through menu selections. The Design Advanced Requests gives you a choice of a text-based or a graphical method of creating templates.
15.8 Requests Based on Polling
The IsSnmpSystemUp template, discussed earlier, is an example of a request based on polling -- periodically checking a managed resource for the current value of one of its attributes. A limitation of the IsSnmpSystemUp template is that it can only determine if an SNMP agent system is available on the occasions that it polls the system. But you may want to be notified if an SNMP device has been down momentarily and then become available. Another attribute in the SNMP RFC 1213 internetSystem group -- sysUpTime -- can be used to design a request template that does this. Building such a template will illustrate the process of creating templates based on polling.
sysUpTime measures the time, in hundredths of a second, since the last system restart. If this value has decreased since the last poll, we know that the system went down between polls. We can create a state in the template called "EverDown" to represent the situation where the device is currently up but was previously down. To make this visible in the Network Views, we can log an alarm with a perceivedSeverity of minor when a transition to the EverDown state occurs. However, this will only cause the Network Views icon color to "decay to cyan" if we first log a "cleared" alarm to clear the previous critical alarm. Fault status color is determined by the highest severity of uncleared alarms against a device.
The states for our template, and the corresponding Network Views color, might be the following:
- Ground--no color
- Poll--no color
- Up--no color
- Down--Red (critical alarm)
- EverDown--Cyan (minor alarm)
To ensure that the Network Views icon for the target object displays an appropriate color in response to a change in request state, we can add, as an action at each transition, a condition that calls an RCL alarm-logging function. For example, to cause icons to turn cyan when the request enters the EverDown state, we can add a condition, AlarmMinorOiEverDown, consisting of the following statement:
{$info = StrToAsn("EM-NC-ASN1.NerveCenterAlarmInfo","{3,minor,\"Device is up after being down\",3,1}");alarmOi($save_pollfdn,$info);}$everdown_alarm = TRUE;Because the SetInternetSystem condition resets $pollfdn to point to the internetSystem group, we need to use $save_pollfdn to log the alarm against the target device. The Boolean variable $everdown_alarm is used as a latch, to ensure that the request does not flood the alarm log with duplicate alarms.
As in the IsSnmpSystemUp template, we can set the target of the poll to the SNMP RFC 1213 internetSystem group by using the SetInternetSystem condition to define a transition from Ground to Poll.
We want the request to transition from Poll or Up to EverDown if the value of sysUpTime decreases. This means we will need a variable to store the previous value of sysUpTime, to compare with the results of the next poll. This variable should be initialized to zero in the transition from the Ground to Poll state. For example, we might add a condition, InitLastSysUpTime, as an action at the transition from Ground to Poll; this condition might consist of this statements:
To define the transition from Up (or Poll) to EverDown, we might compose a condition, sysUpTimeDecrease, as follows:
We will also need to re-initialize the variable $last_sys_up_time with the current value of sysUpTime after each successful poll. For example, we might compose a condition, getSysUpTime, to do this:
We might call our template "IsSnmpSystemEverDown"; a possible state diagram for our template is pictured in FIGURE 15-13.
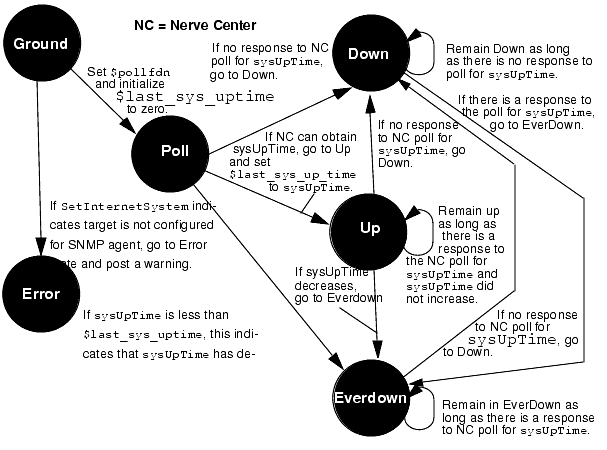
FIGURE 15-13 State Diagram of IsSnmpSystemEverDown Template15.8.1 Adding States
If you want to add a state, for example EverDown, to the template use the following procedure.
To Add a State
1. Click States.2. Type in the name ("EverDown") in the State field.3. Describe what the state represents in the Description field.
- For example, "Agent system is up but has been down."
4. Select a poll rate from the Poll Rate menu.
Note – The polling interval for poll rates (in seconds) can be changed, or new poll rates added in the Poll Rates window (invoked by selecting the Edit \xd4 Poll Rates menu option).
5. Select a severity from the Severity menu.
- Note that severity here is a value that is internal to the request. This does not cause an alarm to be logged, nor does it automatically cause a change in icon color in the Network Views when the request enters the state. Icon color is determined by alarms that are logged against a managed object. Control of icon color is discussed above in Section15.6.3 Controlling Fault Status Color."
6. Click Add to add the new state to the template.
- Repeat this procedure for the other states to be added.
15.8.2 Adding Conditions
To add a condition, invoke the Conditions window by clicking Conditions in the Design Advanced Requests main window. You create the condition code by simply typing in the text window. For example, a condition we will want to use in the IsSnmpSystemEverDown template tests whether sysUpTime has not decreased. Refer to the following figure.

FIGURE 15-14 Entering Condition Code in the Design Advanced RequestsThis RCL statement returns a value of true when (and only when) the current value of the sysUpTime attribute is less than the value currently stored in the $last_sys_up_time variable.
To Add the New Condition to the MIS
1. Enter a name ("sysUpTimeNotDecrease") for the condition in the Name field.2. Describe what the condition does in the Description field.3. Click Add to store the new condition in the MIS.Repeat this procedure for the other conditions to be added.
15.8.3 Adding Transitions
After you have created the states and conditions that you need for the template, you can begin to create transitions.
After you have created the Poll state, do the following steps to create the first transition from the Ground to Poll state.
To Create the Transition
1. Invoke the Transitions window in the Design Advanced Requests main window.2. Select the Ground state as the From state.3. Select the Poll state as the To state.4. Select SetInternetSystem as the Condition to define this transition.5. To select an Action to be taken at the transition, select either CONDITION, MAIL, or UNIXCMD.
- Because SetInternetSystem is a "dummy" transition that never occurs, we do not select an action for this transition. Select <none>.
6. Click Add to add this transition.

To Add Additional Actions at a Transition
1. Set the From, To, and Condition field settings so that they match the transition to which you wish to add an additional action.
- If you are adding an action after creating the transition, the settings will be already set properly, for adding an additional action.
2. Select the type of action from the Action menu.
- If you selected MAIL as the type of action, fill in the Message and Address fields
- If you selected UNIXCMD as the type of action, fill in the Command and Arguments fields as required by the UNIX command.
- If you selected CONDITION as the type of action, select the condition from the condition Name menu.
3. Click Add to add the new action to the list of actions that will be performed at that transition.Note that actions at a transition are executed in the order they appear in the template textual display (which is the order you entered them in the template). If you want to delete one of the actions at a transition, you can only delete the last action listed in the transition. By deleting the actions from the bottom up, as needed, you can re-enter them to arrange them in the desired order.
Repeat this procedure for each of the transitions in the template. For example, we need to do error-checking to determine whether SetInternetSystem indicates a configuration error. If an error occurs, we transition to the Error state; if no error occurs, we transition to the Poll state. The InitLastSysUpTime condition can be called as an action in the transition from Ground to Poll, thus completing the request's initialization.
After we have completed the initialization phase, we might create the two transitions out of the Poll state shown in the following figure.
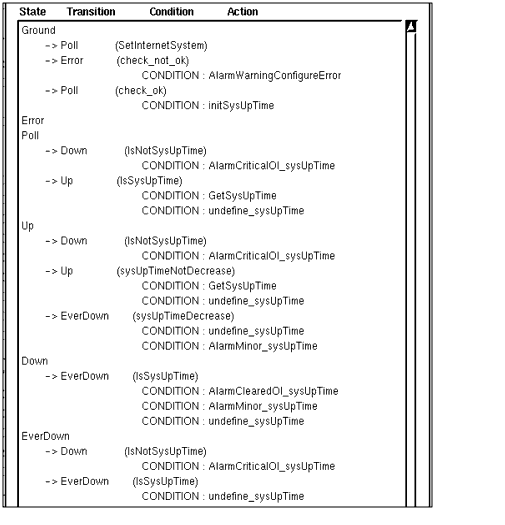
FIGURE 15-15 IsSnmpSystemEverDown TemplateThe transition to the Down state is the first transition out of Poll because we want IsNotSysUpTime to be checked first, to determine if the request will be able to retrieve the sysUpTime value. If this condition evaluates to false, the request knows that sysUpTime has been retrieved, and it then transitions to the Up state. Polling in the Up state checks to determine if sysUpTime has decreased. If it has not decreased, the request loops in the Up state. If it has decreased, the request transitions to the EverDown state.
If you enter the transitions out of a certain state in the wrong order in a template, you can change the order by invoking the Order Transitions window. The Order Transitions window is accessed by clicking Order Transitions in the Transitions window.
The condition undefine_sysUpTime contains the following RCL statement:
This condition needs to be called after each successful poll to remove the last sysUpTime value from the memory space where the request is running. This forces the Nerve Center to retrieve the current sysUpTime value from the agent system at the next poll. But before removing sysUpTime from memory, we call the getSysUpTime condition, which stores the retrieved sysUpTime value in the variable $last_sys_up_time for comparison with the value of sysUpTime at the next poll.
FIGURE 15-15 shows the completed IsSnmpSystemEverDown template as it appears in the Design Advanced Requests textual display. Select the Template \xd4 Save As option to save the completed template.
15.9 Polling RPC Agents
A limitation of our IsSnmpSystemEverDown template is that it cannot distinguish between a situation where the lack of response to a poll for sysUpTime is due to the SNMP daemon being down and a situation where the lack of response is due to the unavailability of the machine on which the daemon is installed. The SnmpPingBackoffReachable sample template overcomes this limitation by using the ping RPC proxy agent to poll for reachability. Discussing this template will illustrate the design of request templates that do direct polling of RPC agents.
The SnmpPingBackoffReachable request begins by polling every 30 seconds for the SNMP system for the sysUpTime attribute. If there is no response to the poll, the request backs off the poll rate to 60 seconds. If there is still no response to the poll, the request attempts to poll the device for reachability using the RPC ping proxy agent. If there is a response to the ping, the request knows that the machine is up but the SNMP daemon is down, and a major alarm indicating this is logged.
However, if there is no response to the poll for reachability, the request knows that the machine is unavailable and logs a major alarm indicating this. The request continues to poll for reachability. When a response is received, a warning alarm is logged, indicating that the device is up after having been down. The request then transitions back to polling for the SNMP sysUpTime attribute. A state machine diagram for this request is shown in the following figure.
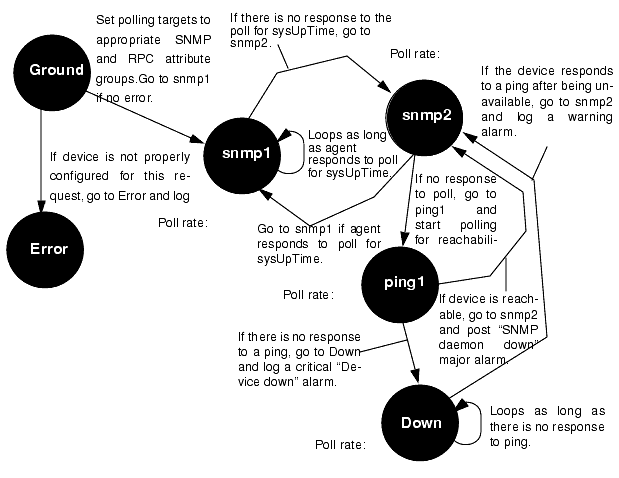
FIGURE 15-16 State Diagram of SnmpPingBackoffReachable Request15.9.1 Targeting the RPC ping-reach Group
The SnmpPingBackoffReachable template polls for both the SNMP sysUpTime attribute and the reachable attribute supported by the RPC ping proxy agent. To do this, the request must extract both the cmipsnmpProxyAgent object and the RPC proxy table object from $pollFdnSet for the device against which the user has launched the request. Just as SNMP attribute groups are "contained" under the cmipsnmpProxyAgent object, all RPC agent attribute groups configured for a device are "contained" under the RPC proxy table object for that device. The request should check to ensure that the target device is configured to support both SNMP and RPC. In this case, the SnmpPingBackoffReachable request transitions to an Error state if it determines that the device is not configured to support the request.
The first transition in the template uses the following condition to obtain the RPC proxy table object from $pollFdnSet:
{$numstr = AsnToStr($count,TRUE);$dn = Extract(&$pollFdnSet,$numstr);$dn1 = Extract(&$dn,"distinguisedName");$dnstr = AsnToStr($dn1,TRUE);$res = AnyStr($dnstr,"RPC");if ($res == TRUE);{$rpc_mo = appendRdn($dn,"/agentId=\"ping-reach\"");$count = $num + 1;print($rpc_mo);}$count = $count+1;}false;The initial setting of $pollfdn is saved in $save_pollfdn. $save_pollfdn can then be used to target alarms against this device. Alarms must be targeted at one of the objects in $pollFdnSet in order for the Alarm Service to match it to a device icon in the Network Views.
A WHILE loop is used to locate the RPC proxy table object by finding a match for "RPC" on one of the FDNs in $pollFdnSet. An appendRdn() operation is used to set $rpc_mo to point to the ping-reach attribute group "contained" under the RPC proxy table. This is accomplished by appending /agentId="ping-reach" to the RPC proxy table FDN.
The condition ends with "false;" to ensure that the transition defined by this condition is not actually executed, and the request then proceeds to evaluate the next condition, get_snmp_mo, which is similar to the SetInternetSystem condition discussed in Section15.6.2.1 Setting the Target Managed Object." This condition sets $snmp_mo to point to the internetSystem group object under the cmipsnmpProxyAgent object (which represents the SNMP agent).
The third transition out of the Ground state checks for errors:
This condition will evaluate to true if $pollFdnSet had one or fewer objects (i.e., not both SNMP and RPC) or the internetSystem group or RPC ping-reach group are not defined for the target device. If so, the request transitions to the Error state and an appropriate warning alarm is posted. If there is no error, the request transitions to the snmp1 state in the transition defined by the initialize_variables condition:
The $pollfdn is set to the SNMP internetSystem group to poll for the sysUpTime attribute. "true;" ensures that this transition will occur when it is evaluated.
15.9.2 Correlating Information from Multiple Polls
The SnmpPingBackoffReachable uses polls for the sysUpTime attribute in the snmp_up condition:
As long as this condition evaluates to true, the request loops in the snmp1 state. After each poll, the UndefineSysUpTime condition is called to force the next defined() call to access the remote agent. If there is no response to the 30 second poll for sysUpTime, the request transitions to the snmp2 state which backs off the poll rate to 60 seconds, in case a longer timeout is needed in waiting for a response from the agent. If there is now a response from the agent, the request transitions back to snmp1 and in the transition executes the is_snmp_backup condition:
{$info = StrToAsn("EM-NC- ASN1.NerveCenterAlarmInfo","{4,warning,\"SNMP Daemon is now responding\",3,1}");alarmOi($save_pollfdn,$info);}$ping_alarm = FALSE;$snmp_alarm = FALSE;The IF construct here is used to distinguish between the situation where the machine has previously failed to respond to a ping and the situation where it has not failed a poll for reachability. This warning alarm will be logged only in the situation where it has not previously failed a response to a poll for reachability; that is, the request had previously determined that failure of response to a sysUpTime poll was due to a failure of the SNMP daemon and not due to the unreachability of the machine.
If there is still no response to the poll for sysUpTime, the request transitions to the ping1 state to begin polling for reachability, using the RPC ping proxy agent. In this transition the $pollfdn is set to point to the ping-reach attribute group with the set_ping_pollfdn condition:
The request tests for reachability with the ping_up condition:
If this condition evaluates to true, the request knows that the previous absence of a response to the previous poll for sysUpTime was not due to the unavailability of the machine, but indicates a failure of the SNMP daemon. The request thus transitions back to snmp1 and executes the is_ping_alarm condition as an action in the transition:
{$info = StrToAsn("EM-NC- ASN1.NerveCenterAlarmInfo","{2,major,\"SNMP daemon is not responding\",3,1}");alarmOi($save_pollfdn,$info);}$ping_alarm = TRUE;This condition logs a nerveCenterAlarm with a severity of major against the device the request was launched against (indicated by $save_pollfdn), but only if an "SNMP daemon is not responding" alarm has not already been logged. Setting the $ping_alarm variable to true ensures that if the SNMP device does start responding to a sysUpTime poll, an alarm will be logged indicating that the SNMP daemon is up after having been down.
If the device does not respond to the ping, the ping_down condition will evaluate to true:
If so, the request knows that the absence of a response to the original sysUpTime poll was due to the unavailability of the machine, and thus the request transitions to the Down state. The request executes the deviceDownCriticalAlarm condition as an action at this transition:
The request loops in the Down state as long as the device does not respond to polls, which are generated at two-minute intervals. If the device responds to a ping, the request transitions back to the snmp2 state and issues a warning alarm in the ping_back_up condition.
15.10 Requests Based on Event Subscription
In addition to responding to requests from managers, agents typically have the ability to detect conditions and generate messages called event notifications on their own initiative. Event subscription is a facility that forwards specified event notifications to a request as soon as they arrive at the MIS. Rather than actively polling devices in the network, the request waits for the arrival of specified event notifications, and then takes appropriate action when this happens.
A request can "subscribe" to receive any type of event notification that is known to the MIS. Subscriptions can request all events of a certain type, events generated by a specified object, or all events that satisfy a CMIS filter. (For information on CMIS filters and the types of event notifications that are defined in Solstice EM by default, refer to the appendix on CMIS filters in Developing C++ Applications.
When designing requests based on event subscription, you will want to correlate this with your use of the following Solstice EM event-handling features.
15.10.1 Event Logging and Alarm Service Monitoring of Alarm Logs
Most types of incoming event notification are, by default, logged to the AlarmLog; this log is, by default, used by the Alarm Service to determine the fault status of devices. The fault status of the device, indicated by icon color in the Network Views, is set to the highest severity of outstanding (uncleared) alarms against that device. However, if you are, for example, using requests to determine when alarms are posted in response to the arrival of enterpriseSpecificTraps, you might not want enterpriseSpecificTraps to be automatically logged to the AlarmLog. The Event Logs is used to define which events are logged to specified logs. The Event Logs is discussed in Chapter 5.
15.10.2 Mapping of SNMP Traps to CMIP Event Notifications
The Solstice EM SNMP trap daemon (em_snmp-trap) converts incoming SNMP traps into CMIP event notifications for forwarding to the MIS. The type of event the trap is mapped to depends upon the way you have configured the trap daemon's mapping capability. (SNMP trap-mapping is described in Chapter 11.) If you are designing a subscription template to listen for SNMP traps, the event types your request should subscribe for will depend upon the trap-to-event mapping implemented by the trap daemon.
15.11 Subscribing for Enterprise-Specific SNMP Traps
An example of an event subscription request would be a request that subscribes to receive all enterprise-specific SNMP traps. By default, the Solstice EM SNMP trap daemon converts all incoming enterprise-specific SNMP traps into enterpriseSpecificTraps with severity set to indeterminate.
You could design an event-subscription request that uses the Nerve Center alarm-logging function to generate more meaningful alarms. For example, suppose that you are interested in the status of certain devices on your network that emit traps with the enterprise identifier of 1.3.6.1.4.1.46. These enterprise-specific traps have specific trap values that are to be interpreted as indicated in the following table.
TABLE 15-2 Enterprise Specific Traps Example 1 CPU Failure Critical alarm 2 Power Supply Failure Critical alarm 3 Fan Failure Critical alarm 4 Overheating Minor alarm 5 Realtime Clock Failure Ignore 6 Network Connection Failure Warning alarm
Your request could subscribe for enterpriseSpecificTrap notifications and then use the RCL alarm-logging functions to log nerveCenterAlarms with the appropriate severities in response to incoming traps. We would thus be using nerveCenterAlarms to drive fault status indication in the Network Views for incoming enterprise-specific alarms. This means that we want to route incoming enterprise-specific traps to our subscription request before they become alarms that affect Network Views icon color.
By default, enterpriseSpecificTraps are logged to the Alarm Log and thus affect icon status color in the Network Views. However, in this example we are assuming that you want to control fault status indication for enterprise-specific traps with a request template that logs nerveCenterAlarms with a severity that is appropriate to the problem indicated by the trap.
Thus, we want to remove enterpriseSpecificTraps from the AlarmLog to eliminate duplication of alarms. To do this, you can use the Event Logs to alter the log discriminator for the AlarmLog to filter out enterpriseSpecificTraps. (An example is described in Chapter 3. Also, you may to refer to Chapter 5.)
15.11.1 Initiating the Event Subscription
In this example, the trap daemon is mapping incoming enterprise-specific traps to enterpriseSpecificTrap event notifications, we will want our request template to listen for incoming enterpriseSpecificTraps.
A subscription request typically initiates the subscription in the transition out of the Ground state. For example, we might define a condition, called "SnmpTrapSubscription" that has the following condition code:
$esindx=Subscribe("enterpriseSpecificTrap");$abccorp_id = "enterprise = 1.3.6.1.4.1.46";false;The variable $esindx receives a value of -1 if an error occurred which prevented the subscription from being implemented. Accordingly, you could define a condition to check if such an error occurs, and then transition to a "Dead" state if it does. The following is an example:
If a request does transition to the Dead state, you may also want to use the Exit() function to cause the request to delete itself. We could define a condition SelfDestruct that is called as an action when the transition to the Dead state occurs:
The variable $abccorp_id is set to contain the enterprise-identifier of the devices whose enterprise-specific traps this request is to listen for. This will be checked against the additionalText field of incoming enterpriseSpecificTrap notifications since the additionalText field contains the enterprise identifier of the device that generated the trap.
The IsSubscriptionError condition is used to define the transition from Ground to Dead. The use of "false" in the last line of SnmpTrapSubscription conditions ensures that this error-checking transition will be evaluated. A third transition out of the Ground state is defined by the IsNotSubscriptionError condition:
After subscribing for enterpriseSpecificTraps and checking for subscription error, the request transitions from Ground to a state where it listens for incoming enterpriseSpecificTraps, if no error has occurred. Accordingly, you might want to create a state in the template called "Waiting," to represent this situation.
15.11.2 Listening for Incoming Events
In the Waiting state the request checks for the arrival of incoming enterpriseSpecificTraps by testing the following condition:
$messType is a system variable that indicates the type of message that "woke" the current state of the request. A value of 0 indicates an incoming event that corresponds to a type that the request has subscribed for. If this condition evaluates to true, an enterpriseSpecificTrap has arrived and we will want this to cause a transition to another state, that we might call the "Problem" state, where the request examines the enterpriseSpecificTrap in detail and takes appropriate action, depending on the nature of the trap. A possible state diagram for our SNMP trap subscription template is pictured in FIGURE 15-17.
The examineTrap condition illustrated in the following figure is an example of how the request could interpret enterprise-specific traps in the way suggested by the example in TABLE 15-2. The extract() function is used to pull out the additionalText field of the event. This is then checked against the enterprise identifier in $abccorp_id. If anystr() detects a match, extract() is then used to retrieve the specific trap number, which is in the probableCause field.
Alarms are posted with the appropriate severity and the cause of the trap is passed in the additionalText field of the nerveCenterAlarm.
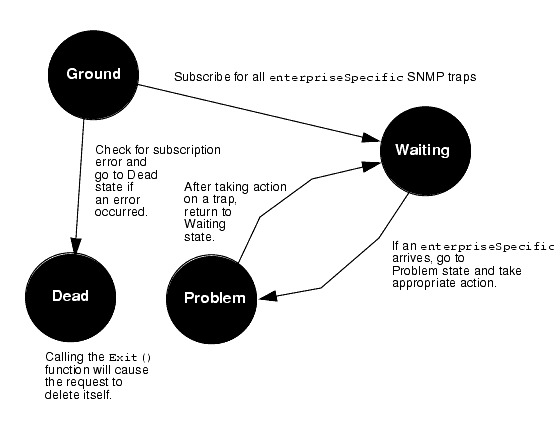
FIGURE 15-17 State Diagram for IsEnterpriseSpecificTrap Template
{$snum = extract(&$eventInfo,"probableCause");IF ($snum == 1){$info = strToAsn("EM-NC-ASN1.NerveCenterAlarmInfo","{1,critical,\"CPU Failure\", 3, 1}");alarmOi($eventOi,$info);}ELSE{ IF ($snum == 2){$info = strToAsn("EM-NC-ASN1.NerveCenterAlarmInfo","{1,critical,\"Pow er Supply Failure\", 3, 1}");alarmOi($eventOi,$info);}ELSE{ IF ($snum == 3){$info = strToAsn("EM-NC-ASN1.NerveCenterAlarmInfo","{1,critical,\"Fan Failure\", 3, 1}");alarmOi($eventOi,$info);}ELSE{ IF ($snum == 4){$info = strToAsn("EM-NC- ASN1.NerveCenterAlarmInfo","{3,minor,\"Overheating\", 3, 1}");alarmOi($eventOi,$info);}ELSE{IF ($snum == 6){$info = strToAsn("EM-NC- ASN1.NerveCenterAlarmInfo","{4,warning,\"Network Connection Failure\", 3, 1}");alarmOi($eventOi,$info);}}}}}}When using the alarmOi() function to log Nerve Center alarms, $eventOi is a system variable that indicates the managed object that is the source of the event. $info contains five values that are used to build the Nerve Center alarm. The first value is the probableCause of the alarm. This is used by the Alarm Service to match clear alarms with the previous alarm that is to be cleared. The second value is the severity of the alarm. The text string, such as "CPU Failure," becomes the additionalText field of the alarm, which can be viewed in the Alarms. (The last two values are not significant.)
Our completed IsEnterpriseSpecificTrap template is shown in the following figure.
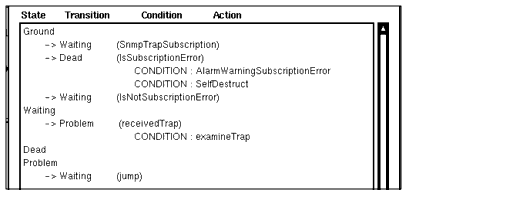
FIGURE 15-18 SNMP Trap Subscription Template15.12 Requests that Combine Subscription and Polling
Event subscription and polling can be combined in a single template. An example of a template that does this is the SnmpLinkUpDownTrap sample template. This template subscribes for incoming linkDownTrap notifications. When a linkDownTrap is received, the request transitions to the LinkDown state which initiates polling in order to count the elapsed time until a linkUp trap is received for the downed interface. If a linkUpTrap notification is not received within the polling interval (20 seconds), a critical Nerve Center alarm is posted against the target SNMP device. If a linkUpTrap notification is received within the polling interval, no alarm is logged. A state diagram for the SnmpLinkUpDownTrap template is shown in the following figure.
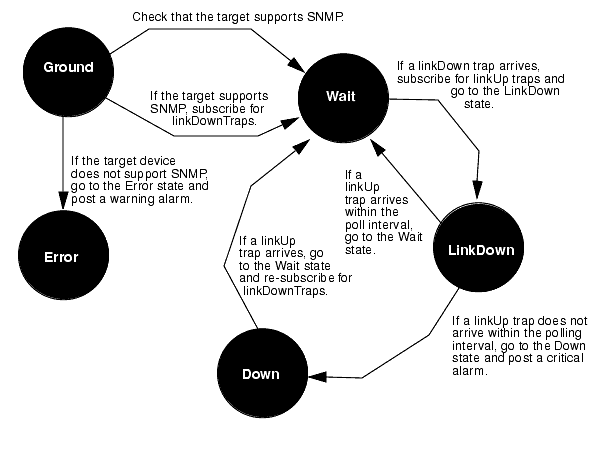
FIGURE 15-19 SnmpLinkUpDownTrap Template State DiagramSince a request is being used to control logging of alarms for linkDown traps in this example, you would not want linkDownTrap notifications to automatically lead to a change in Network Views status color. However, by default, the linkDownTrap notifications are logged to the Alarm Log. Since, by default, the Alarm Log is monitored by the Alarm Service, which controls fault status indication in the Network Views, these trap notifications thus affect the fault status color of icons in the Network Views. For this template, then, you would probably want to use the Event Logs to add linkDownTrap and linkUpTrap notifications to the list of events excluded from the Alarm Log. You might create a separate log, such as LinkLog, to maintain an historical record of incoming linkDownTrap and linkUpTrap notifications. For information on accomplishing this task, see Chapter 5.
15.12.1 Checking for a Correct Target
The first transition out of the Ground state uses the get_snmp_agent_dn condition to ensure that this request has been launched at a device that is configured as supporting SNMP. The request will log a warning alarm if this condition is not satisfied.
To test for SNMP support, the get_snmp_agent_dn condition examines the contents of the RCL system variable $pollFdnSet.
When a request is launched against a target device selected in the Network Views, distinguished names (DNs) for the set of managed objects configured for that device, representing the manageable attributes of the device, are loaded into $pollfdnSet. The first member of $pollFdnSet is loaded into $pollfdn. The get_snmp_agent_dn condition stores the value of $pollfdn into $save_pollfdn. This provides a pointer to a managed object for the target device which can be used as the target for alarms logged against this device. Alarms must be logged against one of the managed objects in the target's $pollFdnSet for the Alarm Service to know which topology node is the target of the alarm.
The get_snmp_agent_dn condition also searches the DNs in $pollFdnSet for a match on "cmipsnmp." If there is a match, the target has been configured with a cmipsnmpProxyAgent, representing the SNMP agent on the device.
{$numstr = AsnToStr($count,TRUE);$dn = extract(&$pollFdnSet,$numstr);$dn1 = extract(&$dn,"distinguishedName");$dnstr = asntostr($dn1,TRUE);$res = anystr($dnstr,"cmipsnmp");if ($res == TRUE){$pollfdn = $dn;$count = $num +1;}$count = $count +1;}false;If a match was found, $res is TRUE, otherwise it is FALSE.
This condition ends with the statement "false;" to ensure that the transition from the Ground state to the Wait state does not yet occur. The request then falls through to the next transition. If the device was configured for SNMP support, the check_ok condition evaluates to true:
The request then subscribes for linkDownTrap notifications and transitions to the Wait state; otherwise, it transitions to the Error state and posts a warning alarm to indicate the request was launched against a device that is not configured to support it. The subscription for linkDownTrap notifications occurs in the subscribe_to_linkdown condition:
$handle =
subscribeOi("linkDownTrap","cmipsnmpProxyAgent",$pollfdn);
subscribe_to_linkdown Condition
The subscribeOi() function here limits the subscription to events generated by the device associated with $pollfdn. The type of event subscribed for is indicated by "linkDownTrap". The condition is_event will be true if a subscribed event arrives:
This condition thus defines the transition to the LinkDown state. Since we want to now test for the arrival of follow-on linkUp traps, we terminate the subscription for linkDown traps by passing $handle to the unsubscribe function:
In the transition to the Wait state the request also now subscribes for linkUp traps:
$handle =
subscribeOi("linkUpTrap","cmipsnmpProxyAgent",$pollfdn);
The Wait state has a polling interval of 20 seconds. Polling is activated by the test for an attribute value (the value of the map attribute) in the is_poll_timeout condition:
This condition is used to define the transition from the Wait state to the Down state. If the Wait state is woken up by the arrival of a linkUpTrap notification, $messType != 0 evaluates to false and this transition does not occur. ($messType is 0 only if the message that woke up the state is subscribed-for event notification.) If the polling interval elapses and no linkUpTrap event has arrived, then $messType !=0 evaluates to true and the transition to the Down state does take place.
If is_poll_timeout evaluates to false, the request then evaluates the next transition out of the Wait state, which is defined by the is_event condition. If a linkUpTrap notification has arrived, this condition evaluates to true and the request transitions back to the Wait state. In the transition back to the Wait state, the request drops the subscription for linkUpTraps (by executing the unsubscribe condition) and re-subscribes for linkDownTrap notifications (by executing the subscribe_to_linkdown condition).
On the other hand, if the request transitions to the Down state, indicates that the polling interval expired before the arrival of a linkUp trap. In this case, a critical alarm is posted against $save_pollfdn (a managed object corresponding to the target device) and the request continues to wait for the arrival of a linkUp trap.
15.13 Building Request Definitions
The meta data browser presents data in a three level hierarchy:
- document
- class
- attributes in each class
You can create multiple thresholds for multiple attributes provided the attributes are within the same document and class. When any one of the thresholds is crossed a notification is sent.
You can name the request definition, enter a description of the request definition based on a list of the following threshold operators:
- equal to threshold
- not equal to threshold
- less than threshold
- less than or equal to threshold
- greater than threshold
- greater than or equal to threshold
- value changed
- value increased by threshold
- value decreased by threshold
- value increased by more than threshold
- value increased by less than threshold
In order for you to organize the requests, each Request Definition can belong to a group that you define by the following methods:
- Create request groups and add request definitions to the group (a Request Definition defaults to the root group if none is specified)
- Modify groups
- Delete groups
- Provide a default name for the request
- Create a new request from an existing request (similar to a "save as" option)
- Delete request definitions
- Modify request definitions
|
Sun Microsystems, Inc. Copyright information. All rights reserved. |
Doc Set | Contents | Previous | Next | Index |
| Solstice Enterprise Manager 4.1 Customizing Guide |
Debugging Request Templates
There are several facilities available to you in debugging Nerve Center request templates:
- The Design Advanced Requests tool does RCL syntax checking when you attempt to save a newly created, or modified, condition. However, the Design Advanced Requests tool will not catch possible runtime errors.
- The Basic Requests tool (accessible from the Network Views menu) lists the requests currently executing in the Nerve Center. If you select a request and click Examine, the Request Examine window is invoked. This window displays the values of variables in the request as it is executing. (Refer to Chapter 4 in Managing Your Network for information on the Basic Requests tool.)
The Solstice Enterprise Manager (Solstice EM) em_debug utility also provides facilities that are useful in debugging templates.
This chapter describes the following topics:
- Section 16.1 Nerve Center Debugging Agents
- Section 16.2 Activating RCL Print Statements
- Section 16.3 Turning Off Debug Agents
16.1 Nerve Center Debugging Agents
As a part of em_debug, there are a number of Nerve Center debugging "agents" which track aspects of Nerve Center operation and display messages in the shell where they are invoked.
- nc_state--Traces transitions from state to state, indicating the current state and the condition used to transition out of a state.
- nc_poll--Traces the enabling and disabling of polling in states.
- nc_event--Provides information on all event notifications that have been received.
- nc_error--Provides information on Nerve Center runtime errors.
For example, you can activate the nc_state agent by entering the following command:
In reporting on state transitions in a running request, nc_state refers to states by number. States are numbered by order of appearance in the left-most column in the Design Advanced Requests textual display.
You should invoke the debugging agents before launching the request in the Network Views.
The Nerve Center debugging agents report on the activities of any request running in the MIS. If you have multiple requests running, it may be difficult to isolate which request is the cause of a message that is displayed. For this reason, it is recommended that you only have the request running which you are trying to debug when using the NC debugging agents.
16.2 Activating RCL Print Statements
Request Condition Language provides a print() function which you can use in conditions to help you in debugging templates--by printing current values of variables, for example. You can use the following em_debug command to activate RCL print() statements:
The RCL print() statements will be displayed in the shell where this command was invoked.
As with the NC debugging agents, the misc_stdout agent turns on print statements for all requests running in the MIS that contain the print() function. If you follow a practice of removing print() statements from templates after new conditions have been debugged, you can use print() statements to debug new templates even while other requests are running in the MIS. Only messages from the request being debugged are then displayed.
Keep in mind that the RCL print() function always returns a value of true. If a print() statement is the last statement in a condition that defines a transition, that transition will always occur. Accordingly, when debugging a template, you may want to avoid print() statements in conditions that define transitions, and restrict them to conditions that are used as actions after a transition.
Note – An RCL print() statement will only be executed if it is in a condition that is evaluated. If a state is never "woken up" by either a poll for an attribute value or the arrival of an incoming event, the conditions defining the transitions out of that state will never be evaluated. Also, the conditions that define transitions out of a state are evaluated in the order they appear in the template. If a prior condition has evaluated to true, and the request transitions out of the state, the subsequent transitions in that state are not evaluated.
16.3 Turning Off Debug Agents
You can turn off a particular debugging agent by entering the following commend:
If you want to turn off all debugging, you can use the em_debug wildcard feature, as follows:
|
Sun Microsystems, Inc. Copyright information. All rights reserved. |
Doc Set | Contents | Previous | Next | Index |