| C H A P T E R 9 |
|
Viewing and Editing Peripheral Devices |
This chapter describes viewing and editing parameters for peripheral devices. Topics covered include:
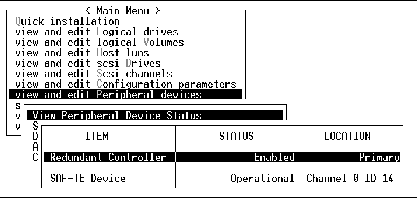
To view the status of each controller, choose "view and edit Peripheral devices  View Peripheral Device Status."
A table displays the status of the available peripheral devices.

A Fibre Channel array's SCSI Enclosure Services (SES) processor, located on the I/O module, monitors environmental conditions such as temperature sensors, cooling fans, the beeper speaker, power supplies, and slot status. The SES processor is supported by Sun StorEdge Configuration Service and the command-line interface.
For Sun StorEdge 3510 FC JBOD arrays only, both Sun StorEdge Configuration Service and the CLI access the SES processor using device files in /dev/es, such as /dev/es/ses0, as shown in the following example:
|
1. /dev/rdsk/c4t0d0s2 [SUN StorEdge 3310 SN#000280] (Primary) 2. /dev/es/ses0 [SUN StorEdge 3510F D SN#00227B] (Enclosure) |
1. Choose "view and edit Peripheral devices  View Peripheral Device Status."
A table displays the status of the available peripheral devices.
A list is displayed of environmental sensors and other hardware components of that SES device.
3. Select an item from the list and press Return to display information about it or see a submenu of its component attributes.
Choosing Overall Status in the illustration above displays the status of the SES device and its operating temperature.
Overall status of an SES device is reported independently from the status of the individual components of that device. An SES device showing an overall status in the menu has its own sensors that report its overall status and its overall temperature.
4. Select other attributes in which you are interested and press Return to learn more about the SES device.
Selecting the Element Descriptor in the following illustration displays the descriptive name of the element.
In this case the descriptor is "Disk Drives."
You can view the status of SES components, including the pair of fans located in each fan and power supply module. A fan is identified by the SES Device menus as a cooling element.
1. Choose "view and edit Peripheral devices  View Peripheral Device Status
  SES Device
  Cooling element."
In some cases you have to "drill down" to display information about components, as as shown in the following illustrations. The following series of screens provide the fan (cooling element) status for each fan.
2. Choose one of the elements (element 0, 1, 2, or 3).
Standard fan speeds are indicated by numbers 1 through 7, indicating speeds in the normal range of 4000 to 6000 RPM. The number 0 indicates that the fan has stopped.
If a fan fails and the Status field does not display the OK value, you must replace the fan and power supply module.
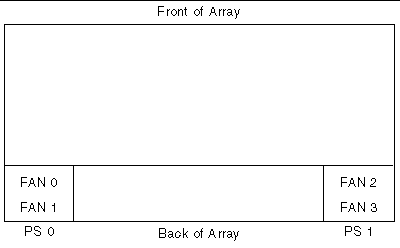
Cooling elements in the status table can be identified for replacement as shown:

Monitoring temperature at different points within the array is one of the most important SES functions. High temperatures can cause significant damage if they go unnoticed. There are a number of different sensors at key points within the enclosure. The following table shows the location of each of those sensors. The element ID corresponds to the identifier shown when you choose "view and edit Peripheral devices  View Peripheral Device Status
  SES Device
  Temperature Sensors."
A SCSI array's SAF-TE controller is located on the SCSI I/O module. It controls environmental monitoring SAF-TE devices such as temperature sensors, cooling fans, the beeper speaker, power supplies, and slot status.
1. Choose "view and edit Peripheral devices  View Peripheral Device Status
  SAF-TE Device."
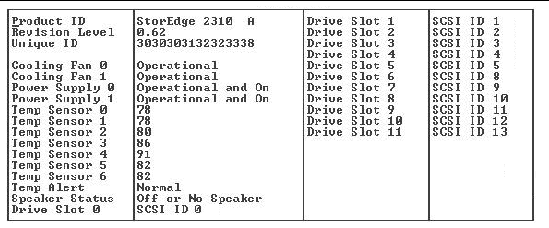
The temperature sensor displays the current temperature of each sensor in degrees Fahrenheit.
The drive slot status indicates that a slot is filled by displaying a SCSI ID number.
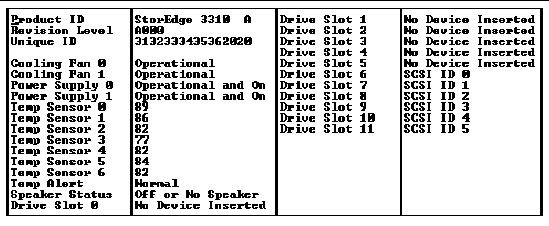
To check whether you have all slots filled in a dual-bus configuration, see Viewing the Physical Drive Status Table and check the column labeled "Chl ID."

In a dual-bus configuration example, the following SAF-TE window displays "No Device Inserted" for six drives that are actually inserted into slots. The SAF-TE protocol does not support a dual-bus configuration and recognizes only one bus (half the drives) if you have a dual-bus configuration.

Monitoring temperature at different points within the array is one of the most important SAF-TE functions. High temperatures can cause significant damage if they go unnoticed. There are a number of different sensors at key points within the enclosure. The following table shows the location of each of those sensors. The Element ID corresponds to the identifier shown when you choose "view and edit Peripheral devices  View Peripheral Device Status
  SAF-TE Device."
The Set Peripheral Device Entry menu options include the following:
The redundant controller mode is automatically enabled. Do not change this setting.
For more information about redundant controller operation, refer to Controller Defaults and Limitations.
|
Note - Dual independent controllers are sometimes used in high-performance situations where data integrity is not crucial and nonredundant is appropriate. |
This function is used to enable the Uninterruptible Power Supply (UPS) status if a UPS unit is installed for power redundancy and backup. The default value for this function is "Disabled."
A confirmation prompt is displayed.
The "UPS Power Fail Signal" menu option sets the priority of the alert notification level if power to your UPS device should fail for any reason. Do not change the default High priority.
1. Choose "view and edit Peripheral devices  Define Peripheral Device Active Signal
  UPS Power Fail Signal."
A confirmation prompt is displayed.
Use the "Temperature exceeds threshold" menu option to force a controller shutdown if a temperature is detected that exceeds system threshold limits. You can adjust this setting to shut down the controller as soon as the temperature limit is exceeded, or after a configurable delay.
1. Choose "view and edit Peripheral devices  Set Peripheral Device Entry
  Event Trigger Operations
  Temperature exceeds threshold."
A menu of options and shutdown delay intervals is displayed.
2. Choose one of the following options.
A confirmation prompt is displayed.
This section describes how to see whether a controller's voltage and temperature are within normal ranges.
1. Choose "view and edit Peripheral devices  Controller Peripheral Device Configuration
  View Peripheral Device Status."
The components checked for voltage and temperature are displayed on the screen and are defined as normal or out-of-order.
2. Choose "Voltage and Temperature Parameters" to view or edit the trigger thresholds that determine voltage and temperature status.
3. Choose a threshold you want to view or edit.
4. Repeat this step as many times as necessary to "drill down" to the threshold ranges and triggering events.
5. If you want to edit a trigger or other editable value, backspace over the existing information and replace it, as shown in the following sequence.
You can view FC error statistics that indicate the status of loopback operation on local channels and on drives.
The statistics are provided under the following headings:
To check the Fibre Channel Error statistics, perform the following steps.
1. Choose "view and edit Peripheral devices  Fibre Channel Error Statistics
  Local Channel Statistics."
Local channel statistics are displayed.
2. Choose "Drive Side Device Statistics."
Drive-side device statistics are displayed.
Copyright © 2004, Sun Microsystems, Inc. All rights reserved.