| Skip Navigation Links | |
| Exit Print View | |

|
Oracle® Hardware Management Connector 3.2 for Microsoft System Center Operations Manager |
| Skip Navigation Links | |
| Exit Print View | |

|
Oracle® Hardware Management Connector 3.2 for Microsoft System Center Operations Manager |
Chapter 1 Using This Documentation
Chapter 3 Deploying Oracle HMC for Operations Manager
Chapter 4 Monitoring Sun x86 Servers in Operations Manager
Configuring Monitoring of Sun x86 Servers
Modifying the Frequency for Server Discovery
Modify the Server Discovery Frequency Interval
Modifying the Server State Polling Frequency
Modify Server State Polling Frquency
Events for Sun x86 Servers View
Active Alerts for Sun x86 Servers View
Power Consumption View Sun x86 Servers
The Health Explorer view provides information about the state of the components and device types in a server. Analyzing the health status by component provides detailed information about each component in the server, while viewing the health status by device type provides detailed information about the server subsystem health. For example, when a temperature device type and a fan speed device type are not healthy, it means that temperature and fan speeds subsystems are having problems.
There are different ways of opening the Health Explorer for a particular server. Choose one of the following options to open the Monitoring section of the Operations Console:
Select the desired server in any of the server state views and click Health Explorer in the Actions panel at the top right of the screen.
Double-click the desired server in any of the server state views.
Right-click the desired server in any of the server state views and from the Open menu choose Health explorer.
The Health Explorer wndow appears.
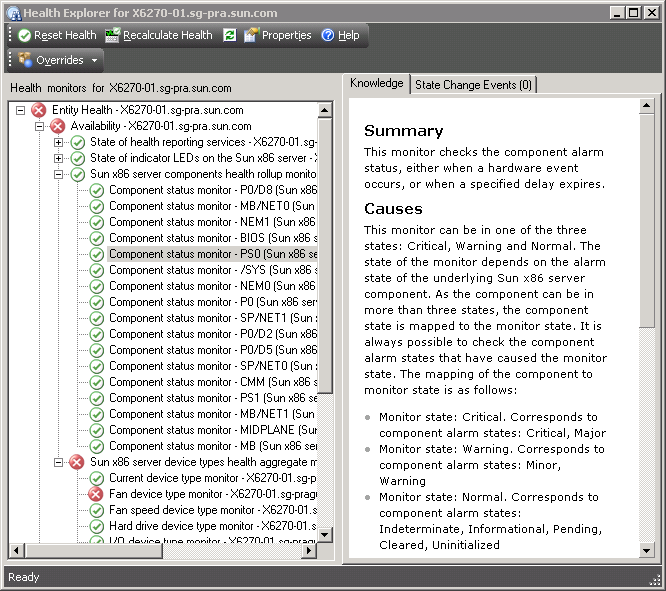
The Health Explorer consists of a knowledge base that provides health details about a managed component, or device type, as well as information about State Change Events, as seen in the following example:

To view information about a component that is being monitored, open Availability and then open Sun x86 server components health rollup monitor. To view information about a device type that is being monitored, open Availability and then open Sun x86 server device types health aggregate monitor.
When a sensor has a critical state, an alert is generated with the corresponding severity. To get information about changes to a sensor's state, select the State Change Events tab.