Oracle Inventory Management Command Center
This chapter covers the following topics:
- Inventory Management Command Center Overview
- Receiving Dashboard
- Aging Inventory Dashboard
- Reservations Dashboard
- Shipping Dashboard
- Space Utilization Dashboard
- Accuracy Dashboards
- Activity Dashboard
- Move Orders Dashboard
- Supply/Demand Dashboard
- Track and Trace Dashboard
- Transaction Management Dashboard
- Replenishment Dashboard
- Items Dashboard
- Kanban Dashboard
- Movement Statistics Dashboard
- Exceptions Dashboard
Inventory Management Command Center
Inventory Management Command Center Overview
Use the Inventory Management Command Center to simplify and expedite fulfillment planning and processing. The command center enables warehouse managers, outbound supervisors, inventory managers, inventory control supervisors, and product managers to streamline inventory activities and to quickly act on exceptions. Kanban planners and inventory control supervisors can use the command center to gain insights about the current inventory health at various inventory locations known as points of use, material replenishment lead time, Kanban demand, and unmoved Kanban cards to manage inventory levels and control inventory cost.
Use the command center to:
-
Coordinate daily activity.
-
Optimize outbound fulfillment.
-
Expedite receiving, inspection, and putaway.
-
Review and act on pending inspection receipt lines with high rejection probability.
-
Reconcile system-maintained item on-hand balances with the actual counts of inventory.
-
Review and act on the on-hand stock locations with high cycle count discrepancies.
-
Maintain inventory accuracy.
-
Manage items, reservations, storage space, move orders, and stockouts efficiently.
-
-
Maximize resource utilization.
-
Prioritize workloads.
-
Allocate resources.
-
Analyze performance.
-
-
Track and trace historical transactions.
-
Use the network diagram to identify reasons for and sources of defective material.
-
Ensure quality control of material.
-
Prevent the receipt of defective material during inspection.
-
Stop the shipment of defective material or recalled goods that are already shipped due to various reasons.
-
-
-
Get better visibility through dashboards into all active shipments in the fulfillment process.
-
Use the time estimates data to manage day-to-day picking operations.
-
Monitor alerts to focus attention on the highest priority tasks.
-
Use shipping operations to act on shipments.
-
Perform comprehensive transaction management.
-
Investigate unprocessed transactions and transactions with errors in these interfaces: Transaction Open Interface, Pending Transactions, Receiving Open Interface, Cycle Count Open Interface, Reservations Interface, and Object Genealogy Interface.
-
Expedite inventory material movement by resolving transaction errors using the business processes in Oracle Inventory.
-
-
Evaluate and streamline your inventory replenishment processes using the Replenishment Dashboard.
-
Examine min-max planning, replenishment counting, and reorder point planning.
-
Use the replenishment processes data to maintain optimal inventory levels to avoid stockouts and overstock.
-
Integrate demand forecasting and time-phased stock replenishments.
-
-
Efficiently manage inventory levels using the Kanban dashboard.
-
Periodically review inventory health of Kanban Items at various points of use in the organization and identify the pull sequences with low, normal, or excess stock.
-
Review material replenishment history for Kanban items.
-
Review the material replenishment history for an item pull sequence and track on hand, safety stock, and daily demand quantities.
-
-
Review replenishment lead time performance and handle supply exception due to longer replenishment lead time situations.
-
Analyze replenishment cycle time trend for an item pull sequence by each replenishment cycle of a Kanban card and view the cycle time break up by card supply status.
-
-
Monitor demand for pull sequences at various points of use in the organization and proactively identify potential future stockout situation due to changes in demand.
-
Find Kanban cards that have been in a particular supply status for an extended period and act to follow-up with supply source to ensure timely replenishments.
-
-
Get a comprehensive insight into your trade movement, analyze movement statistics data, and resolve exceptions using the Movement Statistics and Exceptions dashboards.
-
Analyze your state of business and business performance across legal entities and transaction types.
-
Track and monitor trade movement across economic zones and geographies.
-
Prioritize and resolve transactions with exception errors to expedite trade movement.
-
The Inventory Management Command Center includes role-based dashboards with metrics and charts that highlight critical information about the day-to-day activities of warehouse managers, outbound supervisors, inventory managers, inventory control supervisors, product managers, trade reporting managers, and Kanban planners. The dashboards provide in-depth, multidimensional analysis using transactional data so that you can take corrective actions to resolve issues proactively.
These dashboards are organized by role under the following responsibilities and menus:
| Dashboard | Role | Responsibility and Menu |
|---|---|---|
| Receiving Dashboard | Warehouse Manager, Inventory Manager, and Inventory Control Supervisor | Logistics Manager > Command Center |
| Aging Inventory Dashboard | Warehouse Manager, Inventory Manager, and Inventory Control Supervisor | Logistics Manager > Command Center |
| Reservations Dashboard | Warehouse Manager, Inventory Manager, and Inventory Control Supervisor | Logistics Manager > Command Center |
| Accuracy Dashboards include: | Warehouse Manager, Inventory Manager, and Inventory Control Supervisor | Logistics Manager > Command Center |
| Shipping Dashboard | Outbound Fulfillment Manager and Supervisor | Logistics Manager > Command Center |
| Space Utilization Dashboard | Warehouse Manager, Inventory Manager, and Inventory Control Supervisor | Logistics Manager > Command Center |
| Activity Dashboard | Warehouse Manager, Inventory Manager, and Inventory Control Supervisor | Logistics Manager > Command Center |
| Move Orders Dashboard | Warehouse Manager, Inventory Manager, and Inventory Control Supervisor | Logistics Manager > Command Center |
| Supply/Demand Dashboard | Warehouse Manager, Inventory Manager, Inventory Control Supervisor, and Production Supervisor | Logistics Manager > Command Center |
| Track and Trace Dashboard | Warehouse Manager, Inventory Manager, and Inventory Control Supervisor | Logistics Manager > Command Center |
| Transaction Management Dashboard | Warehouse Manager, Inventory Manager, Inventory Control Supervisor, Production Supervisor, Receiving Supervisor, and Shipping Clerk | Logistics Manager > Command Center |
| Replenishment Dashboard | Warehouse Manager, Inventory Manager, Replenishment Planner, and Inventory Control Supervisor | Logistics Manager > Command Center |
| Items Dashboard | Product Manager | Manufacturing and Distribution Manager > Inventory > Items |
| Kanban Dashboard | Inventory Control Supervisor, Kanban Planner | eKanban Super User > Home (OAF) |
| Movement Statistics | Trade Reporting Manager | Inventory > Transactions > Movement Statistics Dashboards |
| Exceptions | Trade Reporting Manager | Inventory > Transactions > Movement Statistics Dashboards |
Note: You must complete the Inventory Management Command Center configuration and setup after the installation and common configurations are completed as described in My Oracle Support Knowledge Document 2495053.1, Installing Oracle Enterprise Command Center Framework, Release 12.2. For additional ECC overview information, see Overview of Oracle Enterprise Command Centers, Oracle E-Business Suite User's Guide
Searching in and Refining Enterprise Command Center Dashboards
Use the search box to search for and refine (filter) the data on a dashboard. You can select a value from the Available Refinements component, or you can use the Search field to find a keyword, a value, or a specific record. When you submit a search, or select an available refinement, the search term or refinement is added to the Selected Refinements list, and all of the dashboard data is refined. You can add multiple refinements and remove any of them at any time. Use Saved Search to create and save your search. You can edit, delete, or refer to this saved search. You can also use data sets to further refine your search.
Use an asterisk (*) or a percent sign (%) to perform a partial keyword or record search that matches any string of zero or more characters. You can also use a question mark (?) to perform a partial search that matches any single character.
Additional Information: For more information about searching for and refining data in enterprise command centers, see Search in Highlights of an Enterprise Command Center, Oracle E-Business Suite User's Guide.
Receiving Dashboard
See Inventory Management Command Center Overview.
The Receiving Dashboard enables you to ensure that material is received, inspected, and made available for order picking and consumption. Analyze and refine the dashboard data by clicking metrics, alerts, and graphs.
Use the dashboard to:
-
Receive and track material on the receiving dock.
-
Manage inbound workload, prioritizing high value or high demand items.
-
Focus on backordered items that are shipping today.
-
Monitor expected receipts by supply source and need-by date.
-
Review the rejection probability percentage for pending inspection receipt lines.
-
Act by navigating to the Receiving Transactions page from the dashboard.
-
Access the Receiving Dashboard using the following navigation:
(N) Logistics Manager (responsibility) > Command Center > Receiving Dashboard
Receiving Dashboard
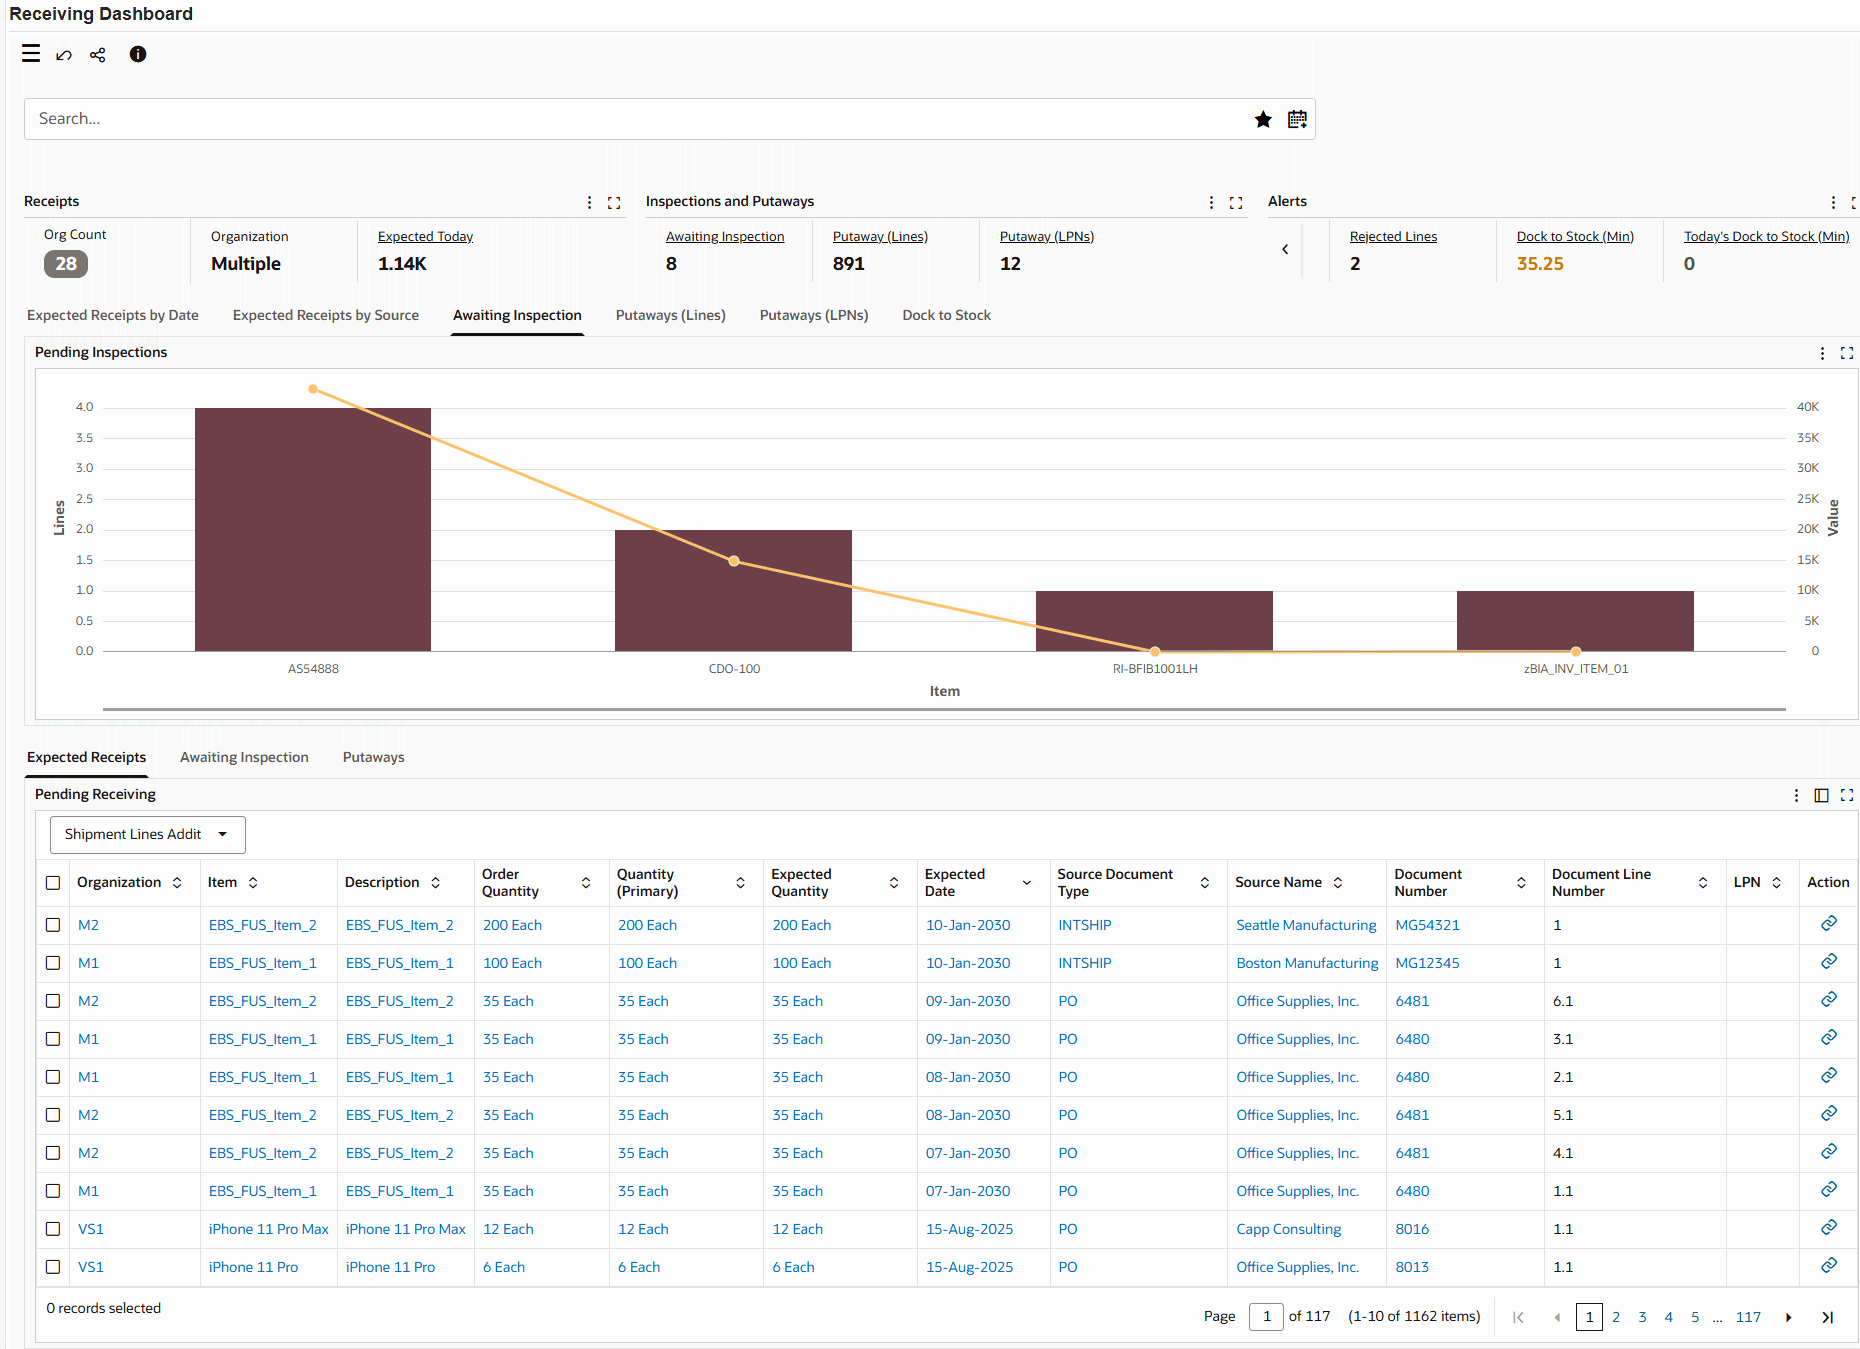
Awaiting Inspection Tab - Rejection Probability Percentage

The following table describes the dashboard:
| Components | Description |
|---|---|
| Receipts (summary bar) | The Receipts summary bar contains the following key metrics. You can refine the dashboard data by clicking a metric value.
|
| Inspections and Putaways (summary bar) | The Inspections and Putaways summary bar contains the following key metrics. You can refine the dashboard data by clicking a metric value.
|
| Alerts (summary bar) | The Alerts summary bar contains the following key metrics. You can refine the dashboard data by clicking a metric value.
|
| Expected Receipts by Date (tab) | This tab contains a chart that sorts expected receiving lines by scheduled date. |
| Expected Receipts by Source (tab) | This tab contains a chart that sorts expected receiving lines by source. |
| Awaiting Inspection (tab) | This tab contains a chart that sorts receiving lines pending inspection by item. |
| Putaways (Lines) (tab) | This tab contains a chart that sorts the receiving lines awaiting putaway (not LPN) to inventory. |
| Putaways (LPNs) (tab) | This tab contains an Aggregate table that shows the LPNs awaiting putaway to inventory. This is the default tab when you select the Pending Putaway LPNs metric. |
| Dock to Stock (tab) | This tab contains a chart that shows the average dock to stock time (in minutes) for all the eligible delivery transactions. Sorting of this chart can be done based on delivery date and item. |
| Expected Receipts (results table) | This table shows all expected receipt lines that match the current refinements. To update the receipt details and perform the receive transaction, click the link in the Action column to navigate to the Directed Receipt page. |
| Awaiting Inspection (results table) | This table shows all receipt lines that await inspection and that match the current refinements. To add inspection details, click the link in the Action column to navigate to the Receiving Transactions page. Use the Rejection Probability Percentage column data to prioritize lines based on the rejection percentage. You can navigate to the Receiving Transactions page to act on these receipt lines. Note: You can use the Receiving Transactions page beginning with Oracle E-Business Suite release 12.2.11. |
| Putaways (results table) | This table shows all receipt lines that await putaway and that match the current refinements. To update the receipt details and perform the deliver transaction, click the link in the Action column to navigate to the Directed Deliver page. |
| Source Documents for Receipt, Inspect, and Deliver Transactions | You can perform transactions for inbound material from the action links in the Expected Receipts, Awaiting Inspection, and Putaways tables. Identify the receiving source using the Source Document Type column. Transactions are applicable to the following documents:
|
| Options (table-level actions) | Export: Use this action to export the search results in a comma-separated values (CSV) file. |
Aging Inventory Dashboard
See Inventory Management Command Center Overview.
Use the Aging Inventory dashboard to:
-
Minimize carrying costs.
-
Optimize space utilization.
-
Maximize labor efficiency.
-
-
Control inventory turnover.
-
Maintain FIFO and FEFO allocations.
-
Dispose expired or obsolete items.
-
-
Manage aging lots.
-
Identify and manage lots nearing expiration.
-
Plan activities dependent on retest dates.
-
The Aging Inventory dashboard provides visibility to your on-hand inventory, receipt, expiration, retest, maturity dates, and subinventories with high cycle count discrepancies. This visibility ensures that material is used as intended and does not become obsolete. Additionally, you can search for organizations, subinventories, locators, revisions, lots, items, descriptions, and other details. You can also refine data by selecting the metrics and alerts and portions of the graphs. The dashboard displays several components, that you can use to further refine your search. Use the enhanced navigation features to:
-
Monitor the age of the inventory.
-
Determine the shelf life of the inventory.
-
Identify at risk items in the inventory.
-
Dispose of obsolete or expired inventory.
-
Review items and subinventory or locator combinations with potentially high cycle count discrepancy percentage.
-
Focus on on-hand stock locations with high discrepancies.
-
Resolve discrepancies by scheduling cycle counts.
-
Access the Aging Inventory Dashboard using the following navigation:
(N) Logistics Manager (responsibility) > Command Center > Aging Inventory Dashboard
Within the Aging Inventory dashboard, you can analyze data and review summary bars, charts, and tables. The following table describes the dashboard:
Aging Inventory Dashboard
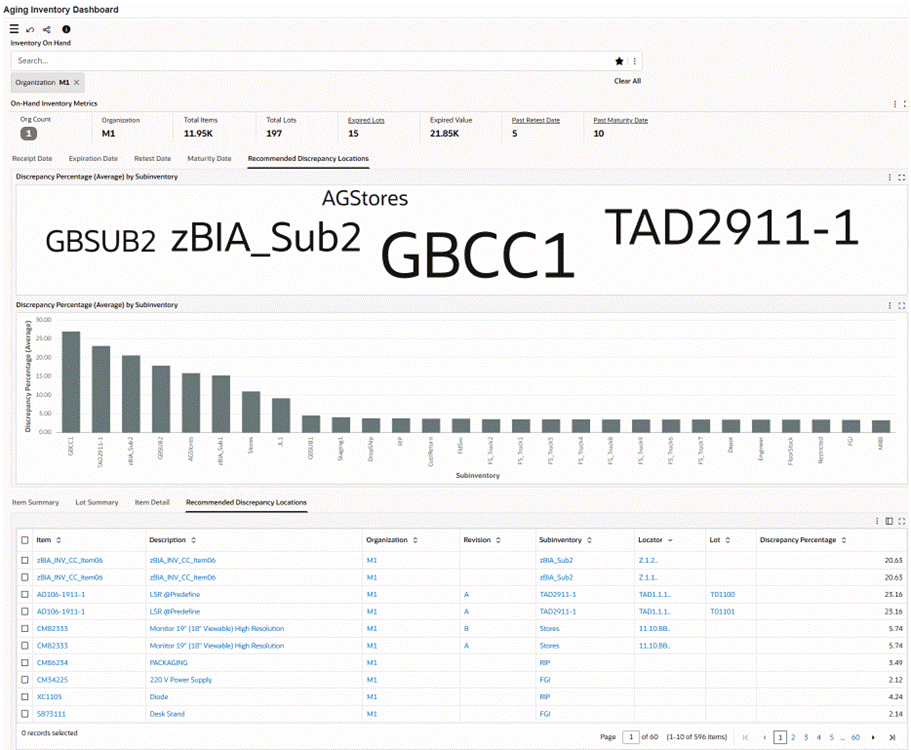
Recommended Discrepancy Locations Tab

| Components | Description |
|---|---|
| On-Hand Inventory Metrics (summary bar) | The On-Hand Inventory Metrics summary bar contains the following key metrics. You can refine the data by clicking on a metric value.
|
| Receipt Date (tab) | This tab contains the following tag cloud and chart:
|
| Expiration Date (tab) | This tab contains the following tag cloud and chart:
|
| Retest Date (tab) | This tab contains the following tag cloud and chart:
|
| Maturity Date (tab) | This tab contains the following tag cloud and chart:
|
| Recommended Discrepancy Locations (tab) | This tab contains the following tag cloud and chart that enable you to identify the on-hand stock locations with a high cycle count discrepancy percentage and potentially suitable for cycle count activities.
|
| Item Summary (results table) | The table displays item summaries. The table also displays items with zero on-hand quantity. Use attribute groups to see more information about items. |
| Lot Summary (results table) | The table displays lot summaries. Use attribute groups to see more information about lots. |
| Item Details (results table) | The table displays item details. The table also displays items with zero on-hand. Use attribute groups to see more information about items. |
| Recommended Discrepancy Locations (results table) | This table displays the discrepancy percentage in descending order for the on-hand stock locations. View details such as item, item description, organization, subinventory, locator, and lot. To review and correct discrepancies, select an item with higher discrepancy and then select the Generate Cycle Count Schedule Requests table-level action. The Select Cycle Count Name and Submit for Scheduling page appears. Select the cycle count and click Submit. Review the request in the Manual Schedule Requests window and proceed with the cycle counting activity to adjust on-hand quantities for any discrepancies. After you complete this action, your administrator must complete the steps described in the Prioritize Cycle Counts to Analyze Inventory Discrepancies Using Machine Learning topic and run the Inventory On Hand Data Load concurrent program with the Full Load option. These steps ensure that the latest discrepancy data is available on the dashboard. |
Reservations Dashboard
See Inventory Management Command Center Overview.
The Reservations Dashboard enables you to ensure that demand is satisfied through effective reservations management.
Use the dashboard to:
-
Gain insight into gaps in demand and supply.
-
Analyze demands match supply, and expected supply.
-
Prioritize backorders.
-
Identify expected receipts and completions.
-
Allocate supply to ensure future demand is satisfied.
Access the Reservations Dashboard using the following navigation:
(N) Logistics Manager (responsibility) > Command Center > Reservations Dashboard
Reservations Dashboard
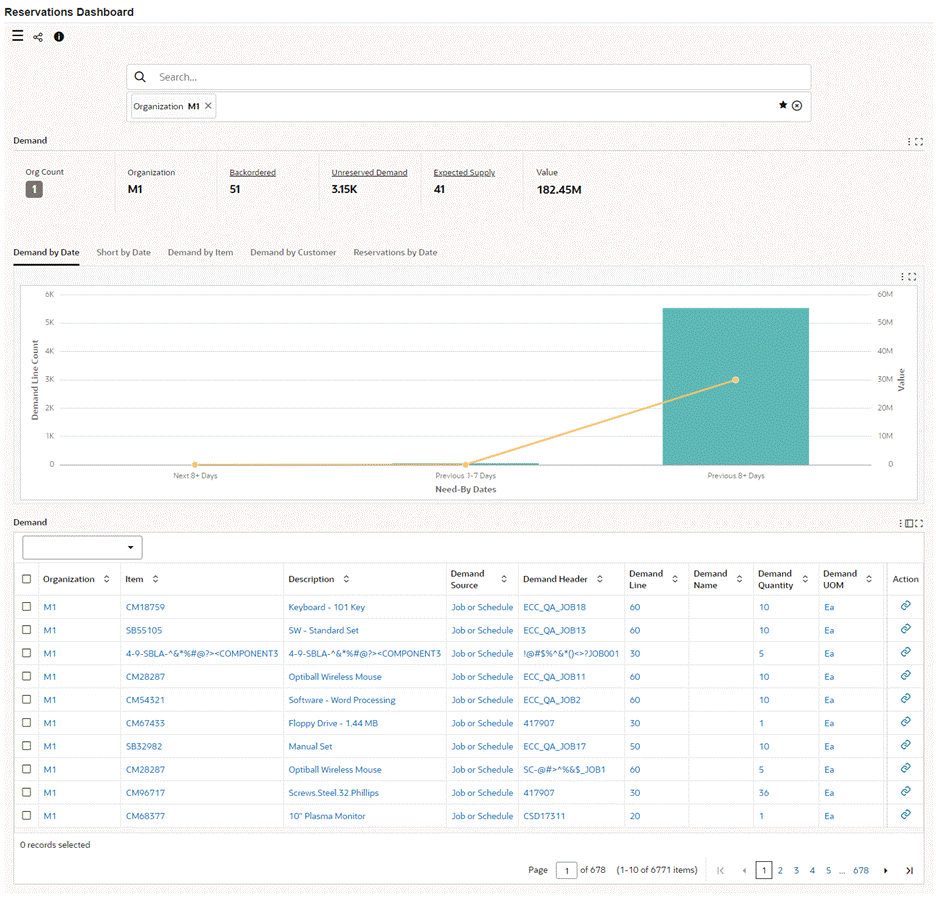
The following table describes the dashboard:
| Components | Description |
|---|---|
| Demand (summary bar) | This summary bar displays the following metrics.
|
| Demand by Date (chart) | This chart shows an analysis of the need-by date by the demand line count and value. Use this information to analyze your most immediate demands. |
| Short by Date (chart) | This chart shows an analysis of demand lines that are fully reserved and those that are short. Lines that are not fully reserved are called short signifying short of the required quantity. By default, this chart shows the analysis of need-by date by demand line count, and value. Select a dimension to view reservations that are short or by the demand source. |
| Demand by Item (chart) | This chart shows an analysis of demand by item, demand line count, and value. Select a dimension to view demand by the demand source, by reservations that are short, by customer, and by cross dock. |
| Demand by Customer (chart) | This chart shows an analysis of demand by customer, demand line count, and value. Select a dimension to view demand by demand source, short, item, and cross dock. |
| Reservations by Date (chart) | This chart shows an analysis of demands with reservations. The graph shows an analysis of the need-by date by the reservation count and the value. Select a dimension to view reservations by the demand source, item, by customer, by short, and by cross dock. |
| Demand (results table) | This table displays details for the demand lines and reservations. To navigate to the Reservations Workbench window, click the link icon in the Action column.
Note: You can use the Action link icon beginning with Oracle E-Business Suite release 12.2.10. Note: The dashboard displays the Reservations descriptive flexfield data only if the Reservations descriptive flexfield is enabled. |
| Options (table-level actions) |
|
Shipping Dashboard
See Inventory Management Command Center Overview.
Use the Shipping Dashboard to:
-
Optimize order release.
-
Prioritize late orders and backorders.
-
Coordinate releases with carrier appointments.
-
-
Review the time estimates required to complete picking for booked and released outbound sales order lines. Time estimates are available only for WMS-enabled-organizations.
-
Expedite high priority orders.
-
Schedule dock doors based on availability.
-
Complete fulfillment activities on time.
-
-
Integrate transportation activities.
-
Calculate weight and volume for tendering.
-
Modify shipments if the wrong truck arrives.
-
The Shipping Dashboard enables you to search for trips, waves, deliveries, and delivery details by entering refinement terms. You can analyze and refine the dashboard data by clicking metrics, alerts, and graphs. Use the navigation features on the dashboard to view:
-
Delivery detail counts by time period
-
Time periods that are based on scheduled ship date
-
Delivery detail counts by detail status
-
Product weight and volume
-
Currently staged material
Access the Shipping Dashboard using the following navigation:
(N) Logistics Manager (responsibility) > Command Center > Shipping Dashboard
Shipping Dashboard
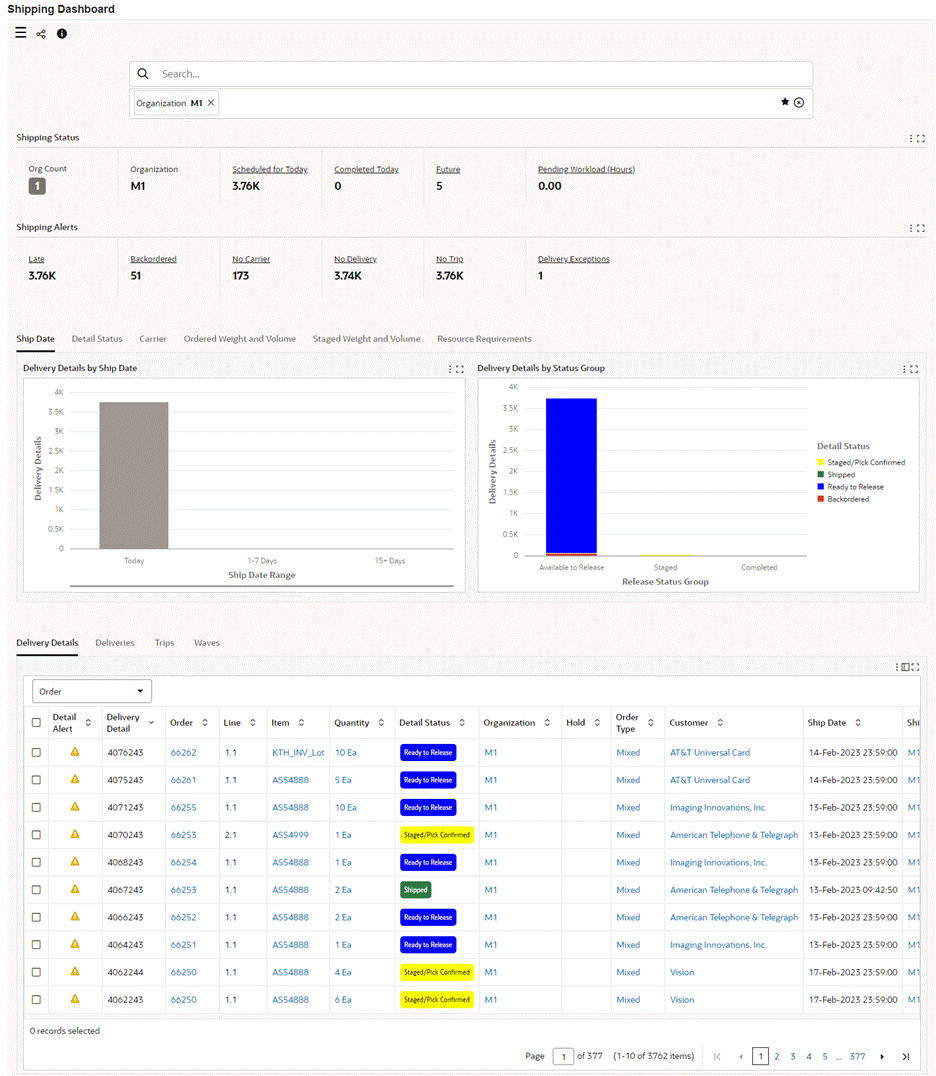
Important: To view shipped delivery details that were closed before the current day, your system administrator must set an appropriate value for the WSH: Days for Full Data Load of Shipped Details profile at the Site level and run the Delivery Details Data Load program with the full load option. Otherwise, the dashboard displays data for open delivery details only.
The following table describes the dashboard:
| Components | Description |
|---|---|
| Shipping Status (summary bar) | This summary bar contains the following key metrics. You can refine the dashboard data by clicking a metric value.
|
| Shipping Alerts (summary bar) | The Shipping Alerts summary bar contains the following key metrics. You can refine the dashboard data by clicking a metric value.
|
| Ship Date (tab) | This tab contains the following charts:
Click a data point on a chart to refine the chart and the entire dashboard. By default, the chart displays details of different statuses using the following color key:
Note: System administrators can customize these colors based on business requirements. |
| Detail Status (tab) | This tab contains the Delivery Details by Status chart, which provides a detailed view of delivery details by status, stacked by carrier. This chart shows the number of delivery details in each release status, stacked by carrier. Detail Status, Released Status Bucket and Transportation Planning are the group dimensions. Carrier, Ship-To Country, Ship Method, Trip, Customer, Item Order Type and Shipment Priority are some of the available series dimensions. |
| Carrier (tab) | This tab contains the Delivery Details by Carrier chart, which shows delivery details by carrier. A scroll bar and a zoom feature help you to view many statuses in a single chart. You can select from several series dimensions, including Trip, Ship-to-Country, Ship-to-Location, and Detail Status. By default, the chart displays details of different statuses using the following color key:
Note: System administrators can customize these colors based on business requirements. |
| Ordered Weight and Volume (tab) | This tab contains the Detail Weight (Sum), Detail Volume (Sum) by Carrier chart, which shows the product weight and volume for the lines associated with various shipping objects, like Carrier, Trip, Delivery, and Ship Method. You can use this when you tender a load and schedule a pick-up. If a carrier requires two or more appointments, then the application combines them and displays them in the graph. |
| Staged Weight and Volume (tab) | This tab contains the Detail Weight (Sum), Detail Volume (Sum) by Subinventory chart, which shows the weight and volume for staged delivery details to help you manage dock operations. The weight and volume are always associated with a subinventory. If locator control is enabled for the organization, then weight and volume can also be viewed by locator. |
| Resource Requirements (tab) | This tab contains the following charts that show the estimated picking time that is required for delivery details.
|
| Delivery Details (results table) | This table shows all delivery details that match the current refinements. Select Order, Inventory, Miscellaneous, and Additional Delivery Details from the drop-down list to view the associated data.
Note: The Additional Delivery Details option displays only if your system administrator enables the Delivery Details DFF. The Detail Alert column shows whether there is an alert on a detail that requires attention before it can be shipped. Alerts includes any exception under the Order Hold status that prevents the delivery from moving to Ship Confirmed status. The application shows the alert for any of the following conditions:
To view the Estimated Time Required (Hours) column, select Miscellaneous from the drop-down list. The Hold column shows whether there is a hold on the associated order header or lines. A red X icon indicates a hold. The Transportation Planning column shows the following details depending on the applicable conditions:
|
| Deliveries (results table) | This table shows all deliveries that match the current refinements. Select Weight Volume, Miscellaneous, or Additional Delivery Information from the drop-down list to view the associated data.
Note: The Additional Delivery Information option displays only if your system administrator enables the Deliveries DFF. The Delivery Alert column shows an alert on a delivery that requires attention before it can be shipped. The application shows this alert in any of the following conditions:
|
| Trips (results table) | This table shows all trips that match the current refinements. The Trip Alert column shows an alert on any trip that requires attention due to any of the following conditions:
|
| Waves (results table) | This table shows details of waves that match the current refinements. |
| Options (table-level actions) |
|
Space Utilization Dashboard
See Inventory Management Command Center Overview.
Use the Space Utilization Dashboard to:
-
Select the best type of storage for quantity on-hand items.
-
Floor storage for large on-hand quantities.
-
Racks and shelves for smaller quantities.
-
-
Ensure adequate space availability for storage areas.
-
Move multiple smaller quantities to a single storage locator.
-
-
Slot high velocity items for fast picking and enhanced resource utilization.
-
Minimize travel.
-
Maximize labor efficiency.
-
The Space Utilization Dashboard enables you to ensure that adequate storage space is available and that it is used effectively. You can analyze and refine the dashboard data by clicking metrics, alerts, and graphs.
Access the Space Utilization Dashboard using the following navigation:
(N) Logistics Manager (responsibility) > Command Center > Space Utilization Dashboard
Space Utilization Dashboard
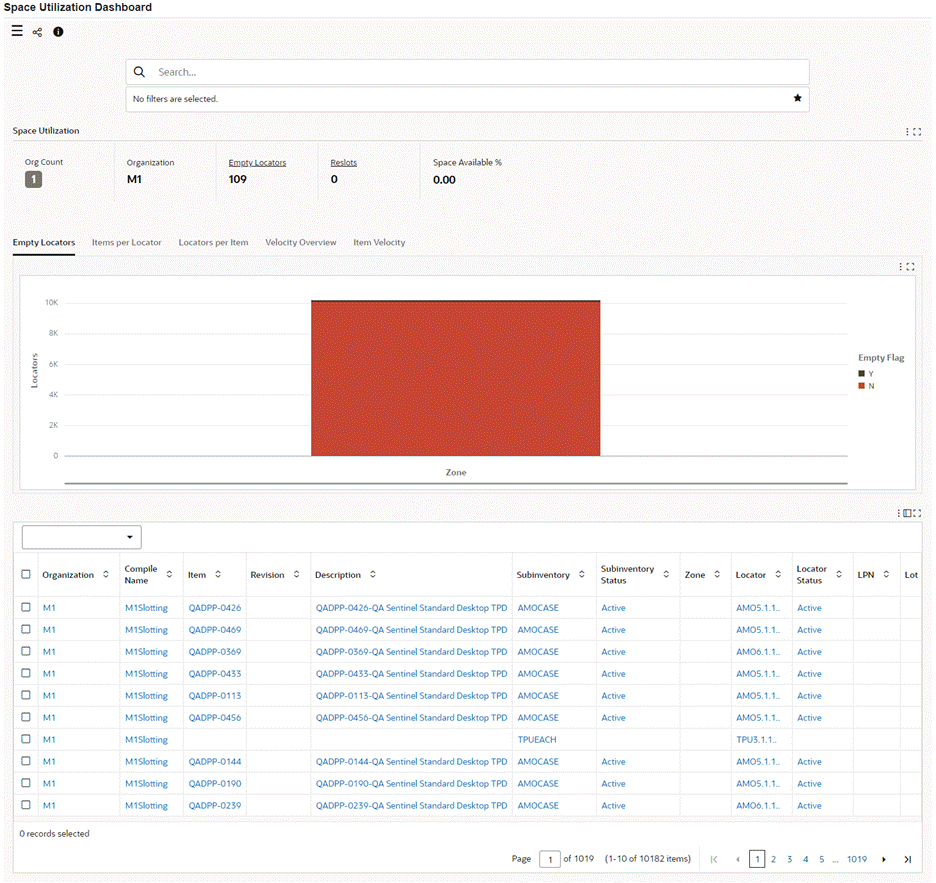
The following table describes the dashboard:
| Components | Description |
|---|---|
| Space Utilization (summary bar) | The Space Utilization summary bar contains the following key metrics. You can refine the dashboard data by clicking a metric value.
|
| Empty Locators (tab) | This tab contains a chart that shows the number of empty and non-empty locators by subinventory, zone, or locator velocity class. |
| Items per Locator (tab) | This tab contains the following charts:
|
| Locators per Item (tab) | This tab contains the following charts:
|
| Velocity Overview (tab) | This tab contains the following charts:
|
| Item Velocity (tab) | This tab contains the following charts:
|
| Results Table | This table displays details such as the organization code, subinventory code, locator code, item, item velocity, item class, locator class, and so on. |
| Options (table-level actions) | You can perform the following actions:
|
Accuracy Dashboards
The Accuracy Dashboards tab includes the following dashboards:
Cycle Counting Dashboard
See Inventory Management Command Center Overview and Accuracy Dashboards.
Use the Cycle Counting dashboard to:
-
Track open counts.
-
Track by schedule date.
-
Track by due date.
-
-
Monitor pending approvals.
-
Track value change.
-
Audit rejected counts.
-
-
Identify unscheduled items.
-
Ensure all items are counted.
-
-
Streamline inventory activities.
-
Ensure on-hand material quantities and valuations are accurate.
Use predefined refinements to search for items, description, status, hit miss, count type, header name, and other details. Additionally, refine data by selecting the metrics and alerts and portions of the graphs. The dashboard displays several regions and components. Click these regions and components to further refine your search. The enhanced navigation features on the dashboard enable you to:
-
Count on-hand inventory on a regular basis.
-
Approve adjustments as necessary.
-
Identify required resources and ensure that they are available.
-
Initiate root cause analysis when appropriate.
Access the Cycle Counting dashboard using the following navigation:
(N) Logistics Manager (responsibility) > Command Center > Accuracy Dashboards
Cycle Counting Dashboard
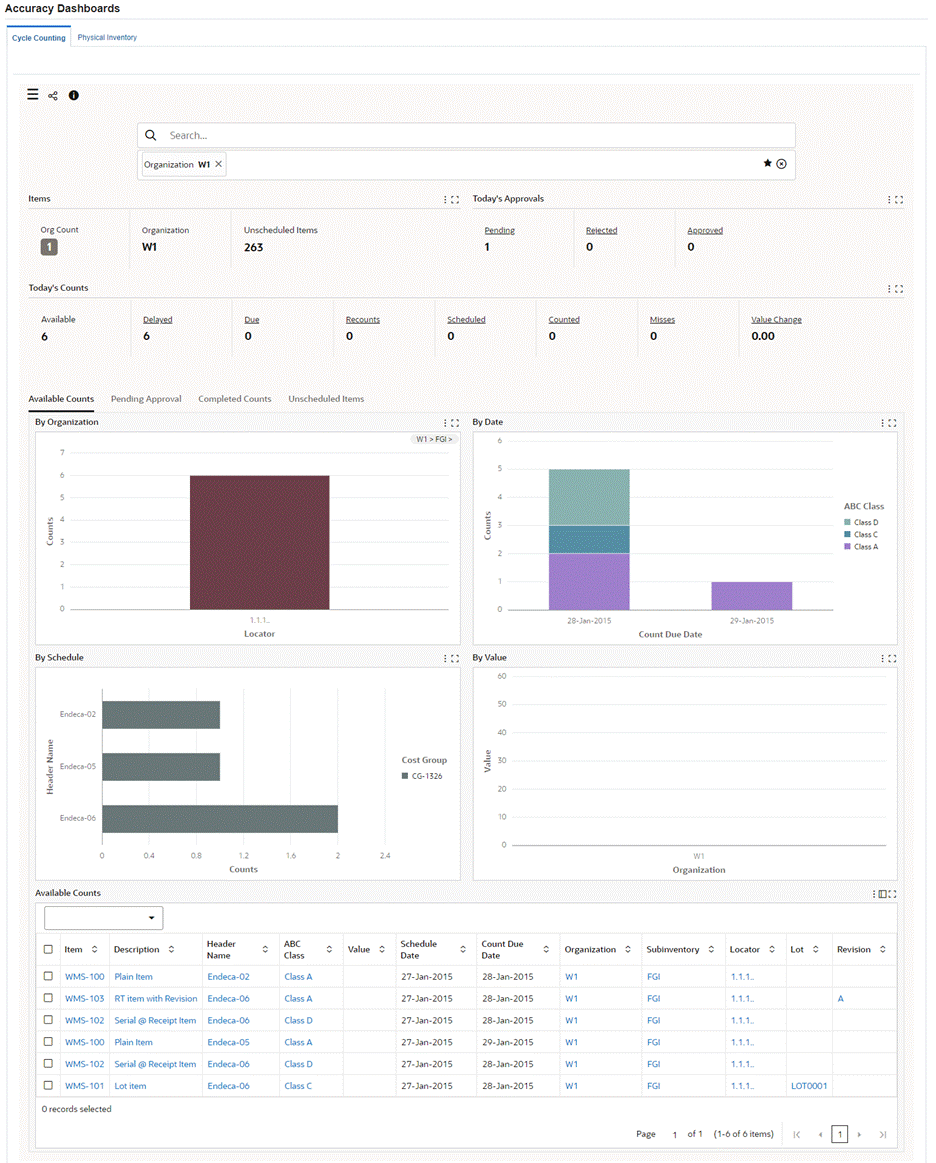
Within the Cycle Counting dashboard, you can analyze data and review summary bars, charts, and tables. The following table describes the dashboard:
| Components | Description |
|---|---|
| Items (summary bar) | The Items summary bar contains the following key metrics. You can further refine the data by clicking on a metric value.
|
| Today's Approvals (summary bar) | The Today's Approvals summary bar contains the following key metrics. You can further refine the data by clicking on a metric value.
|
| Today's Counts (summary bar) | The Today's Counts summary bar contains the following key metrics. You can further refine the data by clicking on a metric value.
|
| Available Counts (tab) | This tab contains graphs and a results table focused on counts with a status of Uncounted or Recount. You can look at the Available Counts tab as a work queue. The graphs and table in this tab expose count attributes that help prioritize and better manage the work load:
The table displays various count attributes. Note: The dashboard displays Cycle Count Headers data and the Cycle Count Entries data only if the Cycle Count Headers and the Cycle Count Entries descriptive flexfields are enabled. |
| Pending Approval (tab) | This tab contains the following graphs and results table. You can look at the Pending Approval tab as a work queue. The graphs and results table each highlight an important dimension of counts that have been processed, counted, and found to be out of tolerance. The graphs and table in this tab expose count attributes that help prioritize and better manage the work load
Note: Out of tolerance counts require approval.
The table displays various lot attributes. To view the approval status, click Approval Status to navigate to the Monitor Activities History page. To perform actions on your selection, click the Options icon. If you select two or more rows, then you can click Compare. To view and perform required actions on your notifications, click Approve Counts to navigate to the Worklist page. Note: The dashboard displays Cycle Count Headers data and the Cycle Count Entries data only if the Cycle Count Headers and the Cycle Count Entries descriptive flexfields are enabled. |
| Completed Counts (tab) | This tab contains the following graphs and results table, each highlighting an important dimension of counts that have been completed, counted, and approved, if required. This tab provides a historical context, which may be beneficial when measuring today's performance.
Note: Out of tolerance counts require approval.
The table displays various item detail attributes. You can perform the following row-level actions:
Note: The dashboard displays Cycle Count Headers data and the Cycle Count Entries data only if the Cycle Count Headers and the Cycle Count Entries descriptive flexfields are enabled. |
| Unscheduled Items (tab) | This tab displays a results table that provides details of unscheduled items. |
Physical Inventory Dashboard
See Inventory Management Command Center Overview and Accuracy Dashboards.
The Physical Inventory dashboard enables you to gain insight into on-hand quantities to manage supply and demand, maintain high service levels, and plan production.
Use the dashboard to:
-
Track tags for your physical inventory.
-
Track uncounted, counted, void, and blank tags.
-
Measure the adjustment quantity, value, and error percentage for each count.
-
-
Evaluate adjustment quantities and adjustment values.
-
Review pending, approved, and rejected adjustments.
-
Review the adjustment value and system value attributes.
-
Act on adjustments that are pending approval.
-
-
Examine negative adjustments that affect reservations and allocations.
-
Drill down to the related reservations and allocations.
-
Act on reservations using the drill-down to the Reservations Workbench.
-
Act on allocations using the drill-down to the Pending Transactions window.
-
-
Ensure that on-hand material quantities and valuations are accurate.
Access the Physical Inventory dashboard using the following navigation:
(N) Logistics Manager (responsibility) > Command Center > Accuracy Dashboards
Within the Physical Inventory dashboard, you can analyze data and review summary bars, charts, and tables.
Note: The Available Refinements component and results tables include the following descriptive flexfields:
-
Physical Inventory (at the header level)
-
Physical Inventory Tags (at the tag level)
Your system administrator must enable these flexfields so that you can select the refinements and view data.
Physical Inventory Dashboard
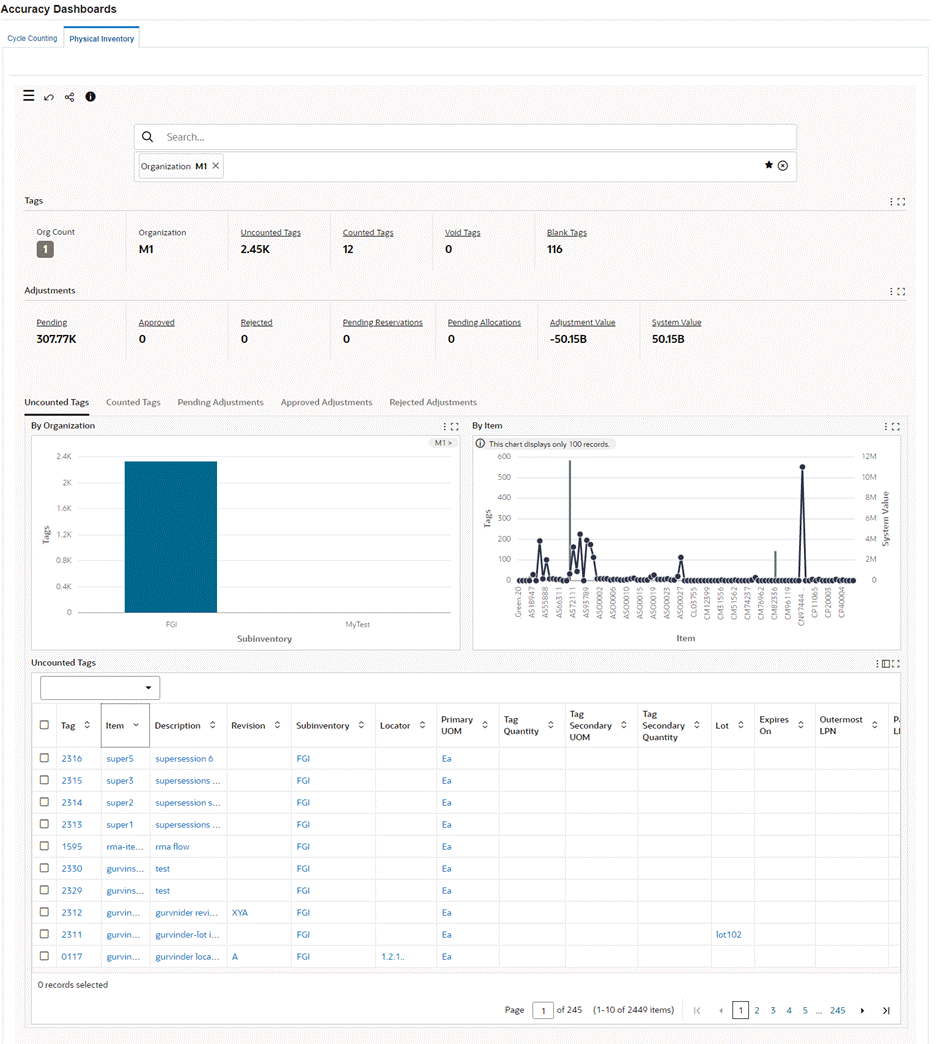
The following table describes the dashboard:
| Components | Description |
|---|---|
| Tags (summary bar) | This summary bar contains the following key metrics. You can further refine the data by clicking on a metric value.
|
| Adjustments (summary bar) | This summary bar contains the metrics related to physical inventory adjustments created by count entries. You can further refine the data by clicking on a metric value.
Important: The Adjustment Value and System Value metrics show the data only when a single organization is selected because the functional currency can differ from organization to organization. |
| Uncounted Tags (tab) | This tab contains the following graphs and a results table.
The table displays various attributes for uncounted tags. Note: The dashboard displays Physical Inventory descriptive flexfield data and the Physical Inventory Tags descriptive flexfield data only if the Physical Inventory and Physical Inventory Tags descriptive flexfields are enabled. |
| Counted Tags (tab) | This tab contains the following graphs and a results table.
The table displays various attributes for counted tags. Note: The dashboard displays Physical Inventory descriptive flexfield data and the Physical Inventory Tags descriptive flexfield data only if the Physical Inventory and Physical Inventory Tags descriptive flexfields are enabled. |
| Pending Adjustments (tab) | This tab contains the following graphs and a results table.
Note: Out of tolerance adjustments require approval. Oracle Inventory posts only those physical inventory adjustments that are approved. Adjustments must be approved or rejected before the adjustment transactions can be processed.
The results table shows details for adjustments that are pending approval. You can perform the following row-level actions:
|
| Approved Adjustments (tab) | This tab contains the following graphs and a results table.
The results table shows details for adjustments that are approved. Use this information to post the approved adjustment transactions to inventory. See Processing Physical Inventory Adjustments. |
| Rejected Adjustments (tab) | This tab contains the following graphs and a results table.
Note: Oracle Inventory does not change the system on-hand quantity if an adjustment is rejected.
Use the table to review details for the rejected adjustments. |
Activity Dashboard
See Inventory Management Command Center Overview.
Use the Activity Dashboard to ensure that activities are completed in a timely and efficient manner. The dashboard provides visibility to evaluate resource productivity. Use this dashboard to search for activity details by entering refinement terms. You can analyze and refine the dashboard data by clicking metrics, alerts, and graphs.
Use the dashboard to:
-
Track activity completed throughout the day.
-
View time spent and the number of transactions completed.
-
Compare today's activity with previous days.
-
Determine the average duration for each activity.
-
Compare worker productivity for each activity.
Access the Activity Dashboard using the following navigation:
(N) Logistics Manager (responsibility) > Command Center > Activity Dashboard
Activity Dashboard
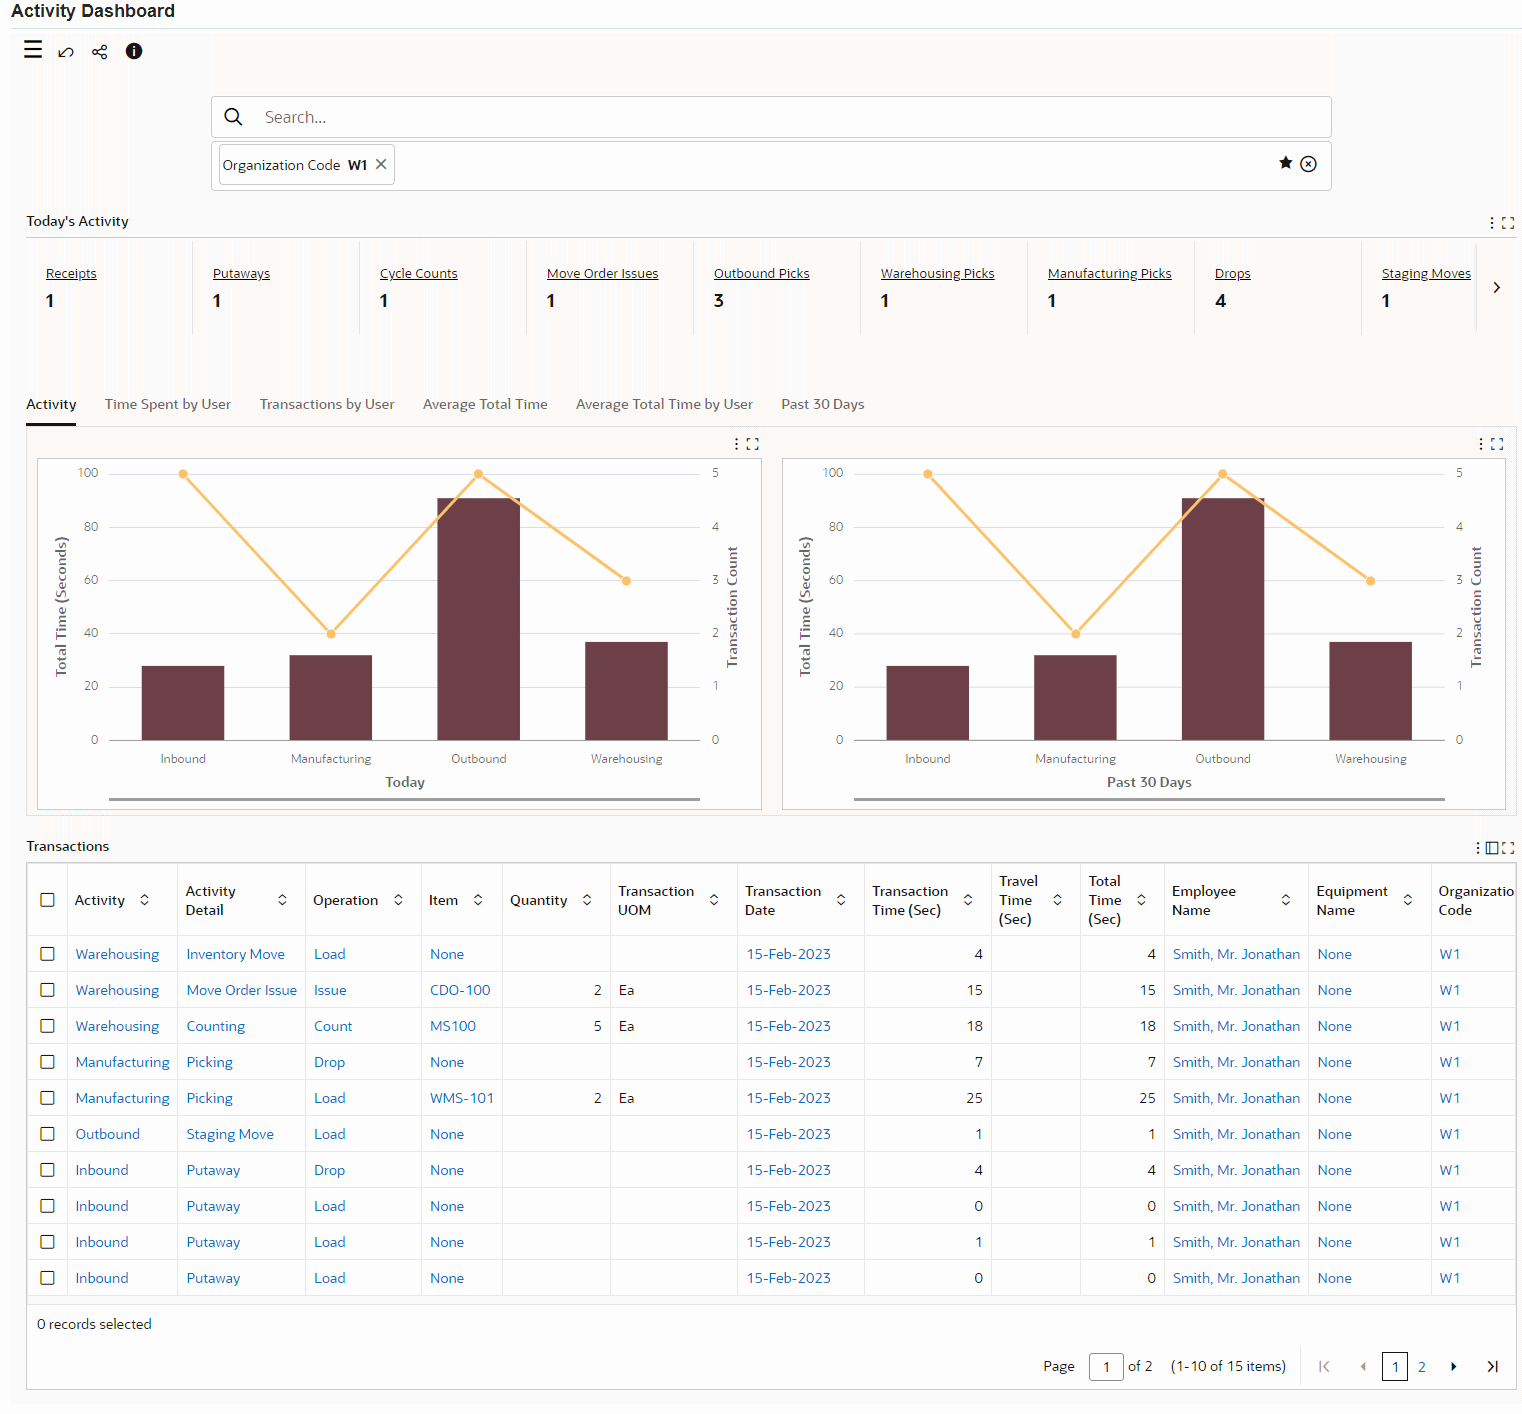
The following table describes the various regions and components on the dashboard:
Note: Today's date indicates the current system date.
| Components | Description |
|---|---|
| Today's Activity (summary bar) | The Today's Activity summary bar contains the following key metrics. You can refine the dashboard data by clicking a metric value The metrics show data for today's date, which is the current system date.
|
| Activity (tab) | This tab contains a graph that shows the total accumulated time spent on activities and the total number of tasks completed for each activity. The time is represented by the bars in the chart while the number of tasks is represented by the line. The first graph focuses on today's activity only. The second graph shows the same data summarized over the past 30 days. |
| Time Spent by User (tab) | This tab contains a graph that shows the time spent by each user on each activity. The first graph shows time spent today, while the second graph shows time spent over the past 30 days. |
| Transactions by User (tab) | This tab contains a graph that shows the number of transactions completed by each user for each activity. The first graph shows the number of transactions completed today, while the second graph shows the number of transactions completed over the past 30 days. |
| Average Total Time (tab) | This tab contains a graph that shows the average duration for the transaction types performed over the specified time period. The first graph focuses on transactions completed today, while the second graph focuses on transactions completed over the past 30 days. |
| Average Total Time by User (tab) | This tab contains a graph that shows the average time that each user spends to complete each transaction type. The first graph shows the average time for tasks completed today, while the second graph shows the user's average over the past 30 days. The averages here differ from the previous tab. The averages in this tab apply to a single user, whereas the averages in the previous tab were for all users. |
| Past 30 Days (tab) | This tab contains a graph that shows the total number of transactions and total time worked for each day over the past 30 days. Use this graph for context and reference as a means of comparing today's activity with previous days. |
| Transactions (results table) | The Transactions results table shows the details of all transactions including those transactions that are entered using the Mobile Supply Chain Applications (MSCA) page for the Warehouse Activity Tracker. |
| Options (table-level actions) | Export: Use this action to export the search results in a comma-separated values (CSV) file. |
Move Orders Dashboard
See Inventory Management Command Center Overview.
The Move Orders Dashboard enables you to track all move orders, headers, and lines. You can allocate and transact the move order lines depending on the status. Analyze and refine the dashboard data by clicking metrics, alerts, and graphs.
Use the dashboard to:
-
Gain insight into details of move orders.
-
Review the number of move order lines using the line status such as Incomplete, Pending Approval, Approved, Not Approved, Closed, Canceled, Canceled by Source, Pre Approved, or Partially Approved.
-
Analyze move orders using the move order types.
-
Track today's move orders that are approved, canceled, or closed.
-
-
Act on alerts to identify and expedite high priority tasks.
-
Focus on move order lines that are pending putaway so that the items receive priority handling to address outbound concerns.
-
Allocate or transact lines that are past the due date.
-
-
Review the move order allocations at the item and lot levels.
-
Act on move order lines by drilling down to the underlying business processes.
-
Edit or cancel move order lines.
-
Allocate the move orders.
-
Transact allocated move orders to complete transfers of items.
-
Perform reservation activities for Pick Wave and Manufacturing Pick move order types.
-
Perform receiving actions for putaway move order lines.
-
Access the Move Orders Dashboard using the following navigation:
(N) Logistics Manager (responsibility) > Command Center > Move Orders Dashboard
Note: To display the descriptive flexfields (DFF) data, your system administrator must enable the following DFFs:
-
Transfer Order Header
-
Transfer Order Lines
The dashboard displays data only for open move orders except for the Today's Activity summary bar, which shows the number of approved, canceled, and closed move orders today.
Move Orders Dashboard
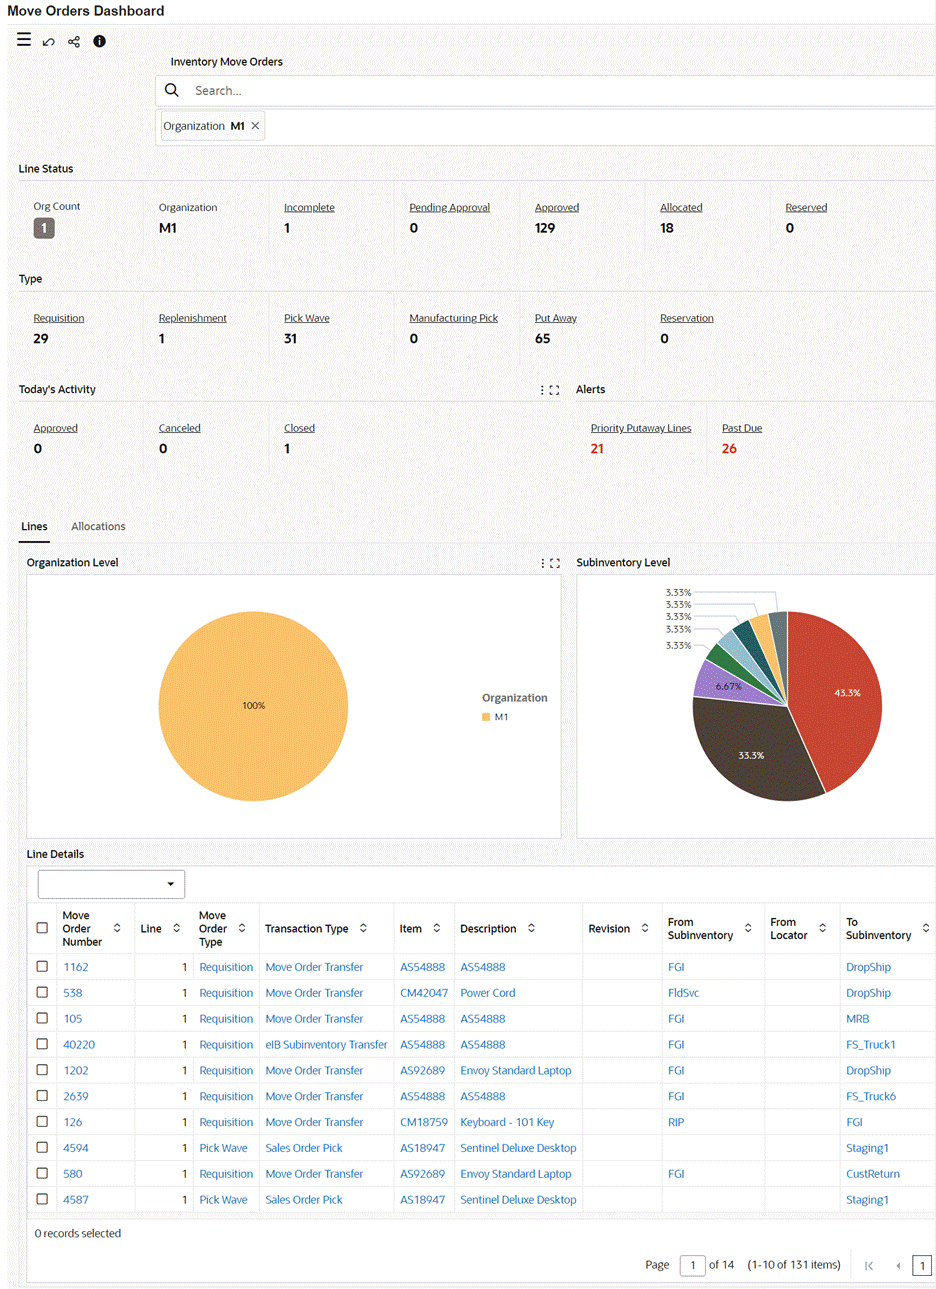
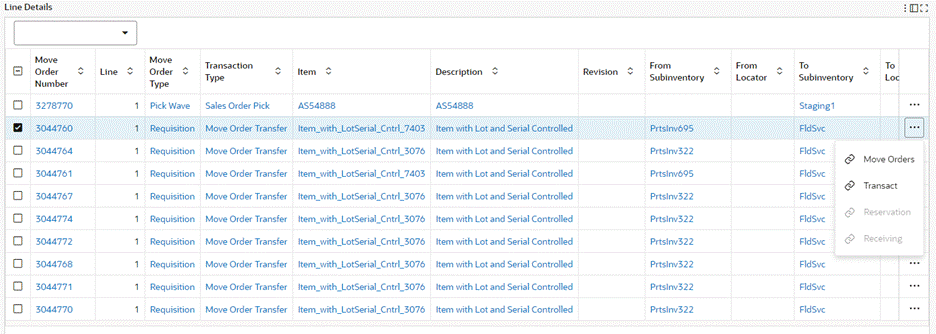
Line Details Row-Level Actions
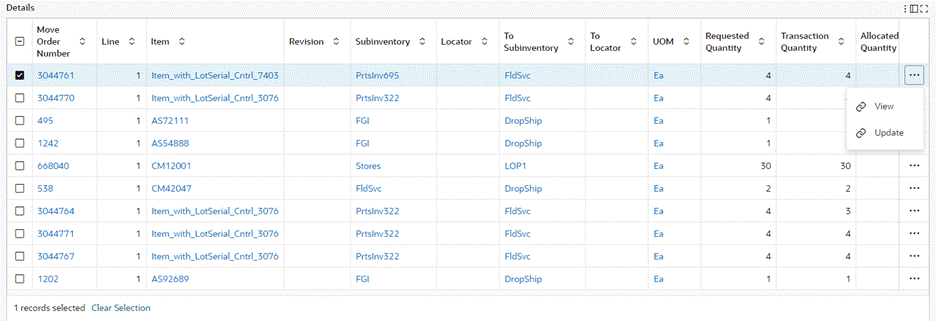
Allocation Details Row-Level Actions
The following table describes the dashboard:
| Components | Description |
|---|---|
| Line Status (summary bar) | This summary bar contains the following key metrics. You can further refine the data by clicking on a metric value.
You can review the number of move order lines that are in the following statuses:
|
| Type (summary bar) | To act on move order lines, this summary bar provides visibility into move order lines for the following types. For example, you can prioritize manufacturing picks to keep production rolling.
|
| Today's Activity (summary bar) | The Today's Activity summary bar contains the following key metrics. You can refine the dashboard data by clicking a metric value. The metrics show data for today's date, which is the current system date.
|
| Alerts (summary bar) | This summary displays the following alerts. Use these alert details to identify and to act on priority transactions.
|
| Lines (tab) | This tab contains the following graphs and a results table.
The Line Details results table shows the details for the move order lines. You can perform the following row-level actions. Select a row and then the action, which is enabled depending on the line status.
|
| Allocations (tab) | This tab contains the following graphs and a results table.
The Details results table shows the allocation details for the move order lines. You can perform the following row-level actions. Select a row and then the action, which is enabled depending on the line status.
|
Supply/Demand Dashboard
See Inventory Management Command Center Overview.
The Supply/Demand Dashboard gives you complete insight into the stock visibility across supply and demand sources to help you to identify and mitigate stockout risks.
Use the dashboard to:
-
Review available inventory stocks in subinventories and locators.
-
Review the current and projected supply quantity and demand quantity.
-
Track the supply and demand quantity mismatches.
-
Monitor inventory overstocks.
-
Identify upcoming stockouts and overstock situations.
-
Maximize operational efficiency to avoid stockouts and to maintain uninterrupted service levels.
-
Ensure enough daily supply is available to fulfill the future demand.
-
Address stockout issues by initiating inter-organization transfer of stocks.
-
Reprioritize existing reservations to resolve immediate shortage or to meet demand for unexpected large orders.
-
Access the Supply/Demand Dashboard using the following navigation:
(N) Logistics Manager (responsibility) > Command Center > Supply/Demand Dashboard
Supply/Demand Dashboard
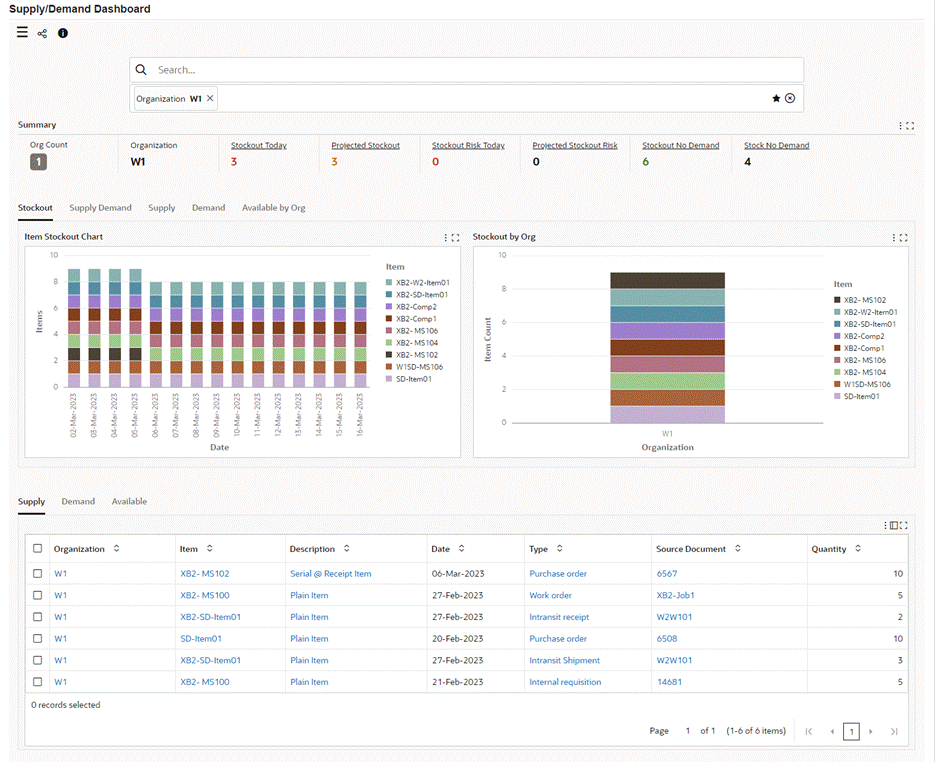
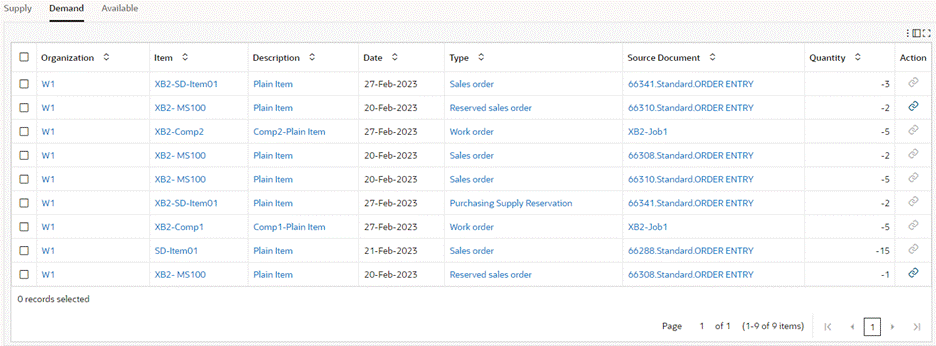
Demand Tab Row-Level Actions
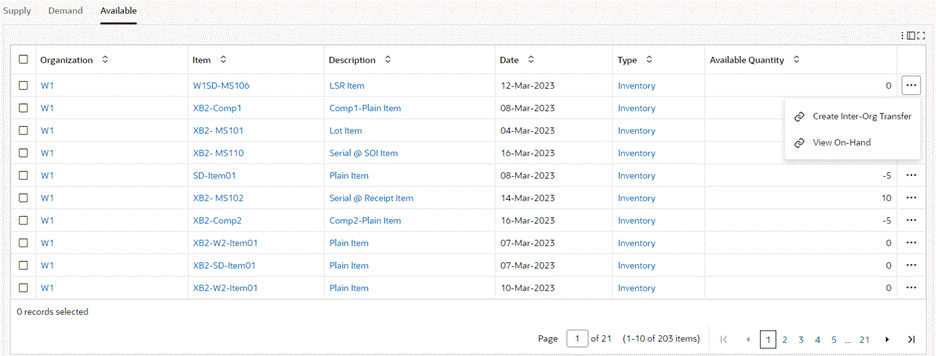
Available Tab Row-Level Actions
The following table describes the dashboard:
| Components | Description |
|---|---|
| Summary (summary bar) | This summary bar contains the following key metrics. You can further refine the data by clicking on a metric value.
Selecting the following metrics except Stock No Demand applies a refinement and makes the Stockout tab with Item Stockout and Stockout by Org charts active.
|
| Stockout (tab) | This tab includes the following charts:
|
| Supply Demand (tab) | This tab includes the following metrics and charts. To view the stock, supply, and demand information, refine the data by an item.
|
| Supply (tab) | This tab includes the following charts.
|
| Demand(tab) | This tab includes the following charts.
|
| Available by Org (tab) | This tab includes the following charts.
|
| Supply (results table) | Use this table to view the supply details for items. |
| Demand (results table) | This table displays details of items that are in demand. For a reserved sales order type, you can perform the Transfer Reservation action. When you click this action, the Search Reservations page appears with the selected item in context. To transfer reservation from low priority demand to high priority demand, click the Transfer Demand icon. |
| Available (results table) | This table displays on-hand quantity details for items. You can perform the following row-level actions. Select a row and then the action, which is enabled depending on the line status.
|
Track and Trace Dashboard
See Inventory Management Command Center Overview.
Use the Track and Trace Dashboard to get an overview of the storage and transaction history of material so that you can analyze issues in the supply chain process. The network viewer diagram on the dashboard helps you to track material and transactions to perform the trace analysis for defective and recalled material from a supply source to a destination during the investigation of vendor, distributor, or customer complaints. For example, there may be complaints from customers about shipped sales orders such as products not functioning properly or defective products. When you track and trace the defective products, these may be coming from a vendor or due to WIP.
During trace analysis, you can review details such as:
-
Vendors from whom lots or items are received
-
Users who performed receipts, warehouse moves, and outbound shipments
-
Storage and staging locations that received shipments
-
Dates on which pick, pack, move, and ship transactions were made
Use the dashboard to:
-
Track and trace all material movement, warehouse operations, user operations, and resource usage.
-
Analyze supplier details using information such as order number, item, document type, lot number, receipt date, receiving subinventory, and locator.
-
Review inbound, in receiving, and on-hand quantities for lots and items. Track lot and non-lot-controlled material.
-
Trace subinventory transfers from one subinventory to another within the same inventory organization.
-
Trace backflush transfers between subinventories in inventory organization and Oracle Work in Process (WIP) organization.
-
Trace picking, packing, and shipping activity details for sales orders.
-
Review sales orders details using customer, user, delivery, trip, carrier, ship-to location, and shipping information.
-
-
Prevent the defective material from being used or shipped.
-
Perform root cause analysis for lots and items issues.
-
Identify the reasons, activities, and attributes for transactions that have issues.
-
Drill down to related transactions to act on lots or items that are in the subinventory and in receiving locations.
-
Use the Material Workbench to update the status of material of on-hand quantities.
-
Use the Receiving Workbench to update the status of material that is awaiting inspection.
-
Quarantine material for inspection.
-
-
Access the Track and Trace Dashboard using the following navigation:
(N) Logistics Manager (responsibility) > Command Center > Track and Trace Dashboard
Track and Trace Dashboard
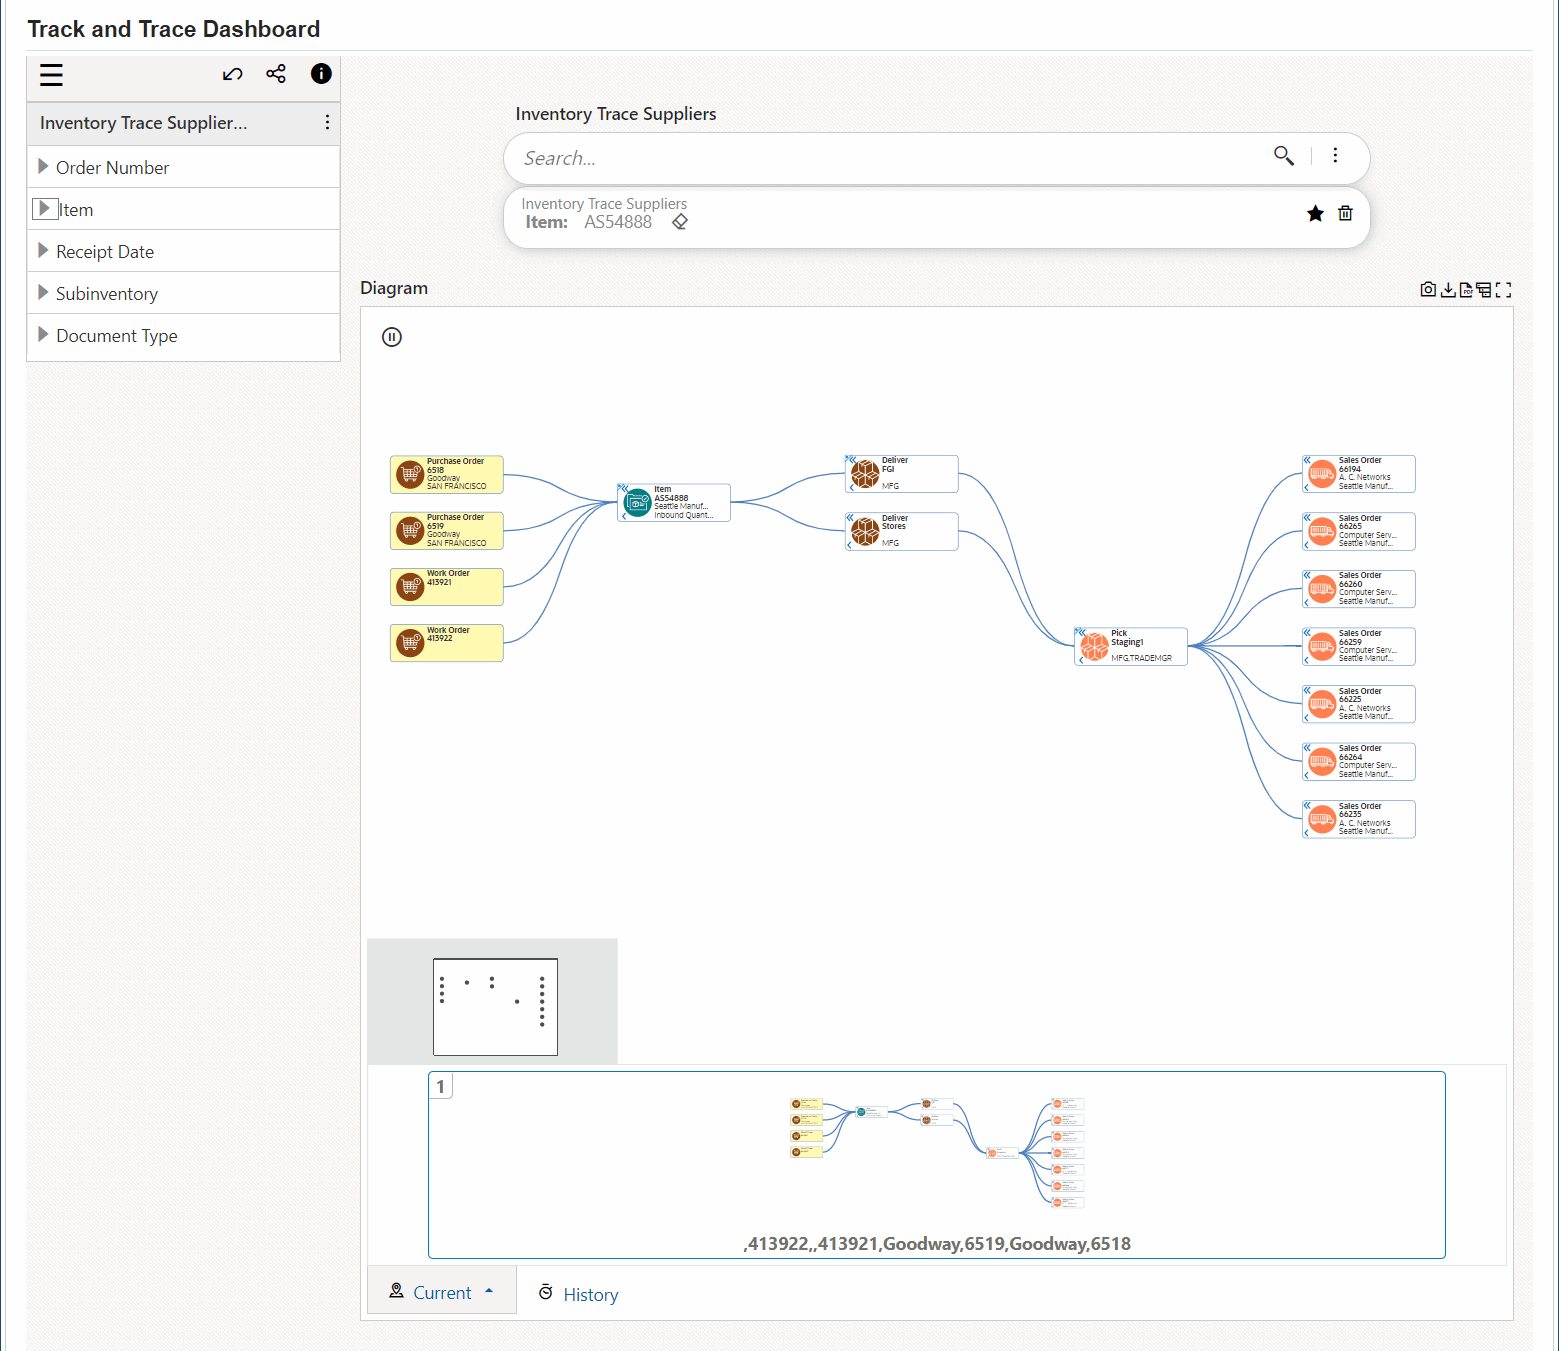
The following table describes the dashboard:
| Components | Description |
|---|---|
| Data Sets | To filter the traceability network, select refinements from the following data sets:
|
| Track and Trace (network viewer) | The Track and Trace Dashboard network viewer shows the material flow from inbound transactions to outbound transactions (sales orders) through the network nodes. The network diagram displays the following nodes:
Right-click a node to select a behavior:
|
| Actions from Nodes | To perform actions related to the nodes, right-click a node and select an action. See Performing Actions. |
Performing Actions
Important: After you perform actions, your system administrator must run the Inventory Track and Trace Data Load program with the incremental load option so that the latest track and trace data is available.
The following table describes node related actions.
| Node | Action | Description |
|---|---|---|
| Lot/Item | Invoke Receiving Dashboard | Use this action to update the status of an item or a specific lot after inspection. When you click the Invoke Receiving Dashboard action for an item and navigate to the Receiving Dashboard, the dashboard retains the item and organization refinements and displays the related data. In the Awaiting Inspection tab, click the link in the Action column to navigate to the Receiving Transactions page. See Receiving Dashboard.
Note: You can use the Receiving Transactions HTML feature beginning with Oracle E-Business Suite release 12.2.4. |
| Lot/Item Deliver Move Pick Pack |
Update On-Hand Quantity | Use this action to navigate to Material Workbench to view and update the receiving material, on-hand quantities, and intransit material. The Material Workbench page displays refinements that are specific to the node from which you navigate.
Note: You can use the Material Workbench HTML feature beginning with Oracle E-Business Suite release 12.2.10. |
Network Viewer Diagram Examples
Example: Track and Trace Problem to the Pick Location
In this example, two different customers have reported problems with sales orders: 66048 and 66049. The inventory manager uses the network diagram to review the supply chain activities and traces the problem to the pick location.
The trace analysis steps that the inventory manager performs are as follows:
-
Verifies recall details using the diagram nodes. The diagram shows different vendors from whom the inbound supplies are received and locations where the picking and shipping activities are performed. Views the network relationship from the source (purchase orders) to outbound sales orders.
Network Relationship from Source (Purchase Orders) to Outbound Sales Orders

-
Identifies that there is a common picking location for the shipments.
-
Right-clicks the Sales Order Pick node and selects the Show Detail action. The Details dialog box appears.
Details Dialog Box
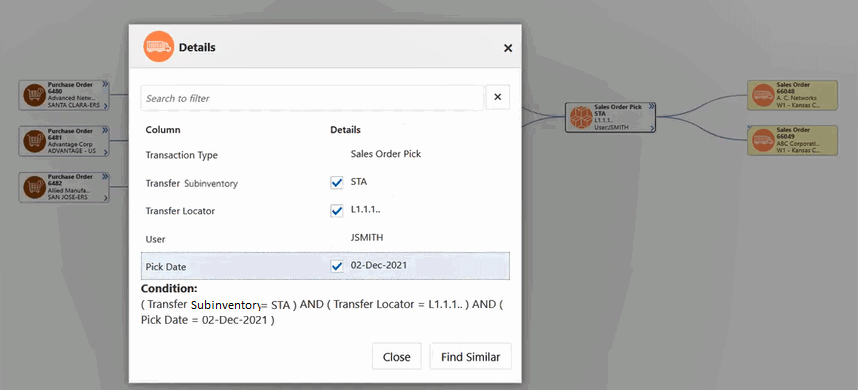
-
Clicks Find Similar to get details of comparable outbound sales orders from the picking location on the specific date.
The Find Similar action fetches similar outbound sales orders to other customers that match the pick date.
Similar Outbound Sales Orders
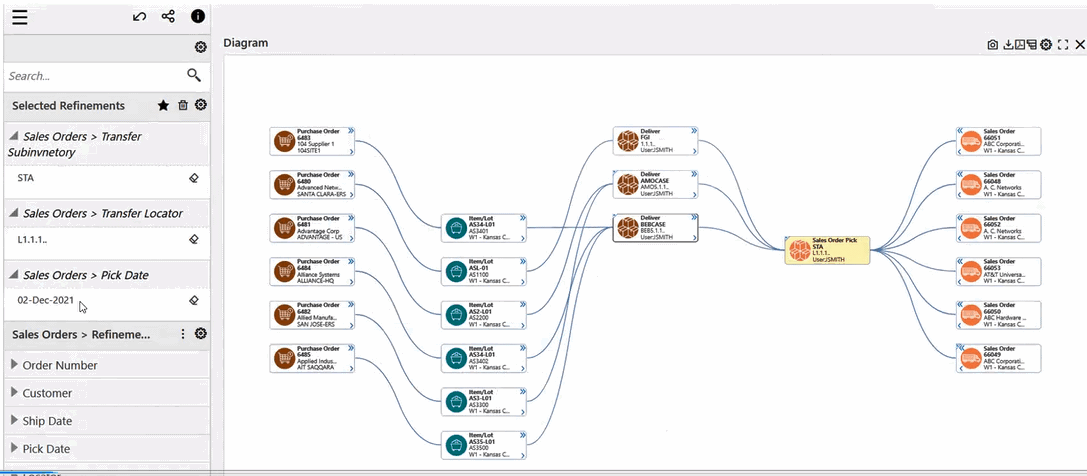
-
Clicks the Sales Order Pick grouping node to view details for individual shipments or picking action for other customers.
Sales Order Pick Grouping Node
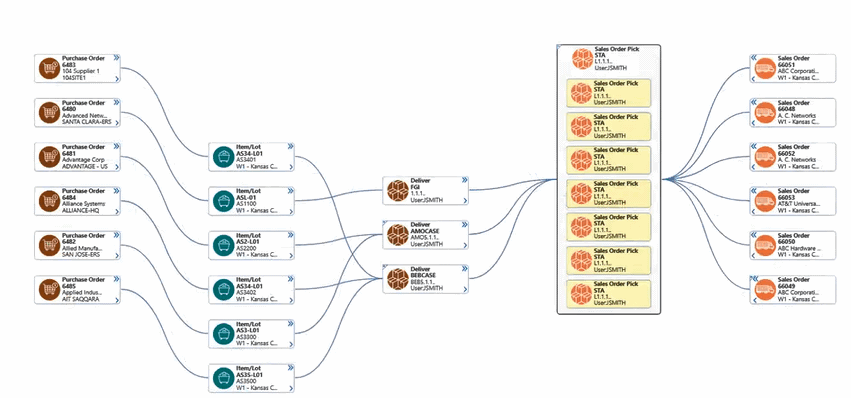
-
Traces the problem to the pick subinventory location.
-
Right-clicks the Sales Pick node and selects Update On-Hand Quantity to act on the material.
Example: Track and Trace Problem to the Vendor
In this example, customers have raised concerns with defective items. The inventory manager uses the network diagram to perform the trace analysis and identifies that the issue is at the inbound supply stage. Reviews the material movement from the source of supply to outbound sales orders.
Material Movement from the Source to Outbound Sales Orders
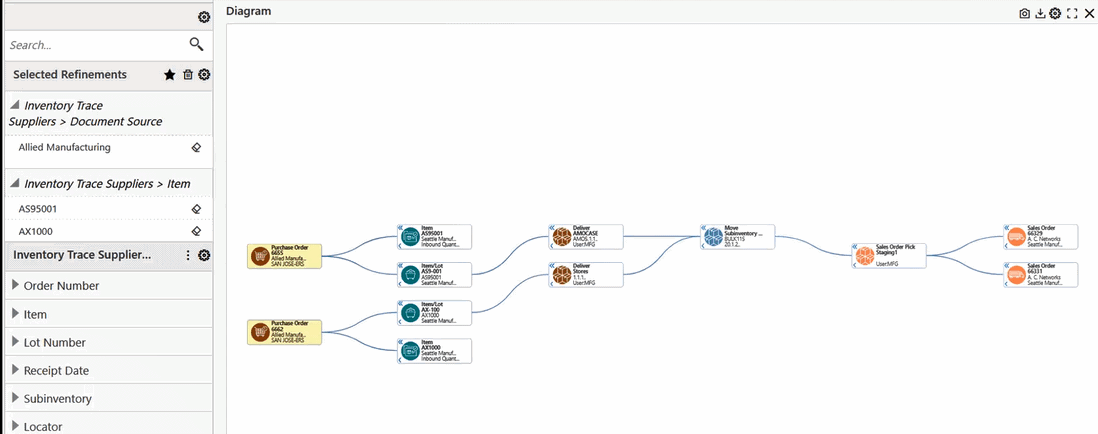
The trace analysis steps the inventory manager performs are as follows:
-
Reviews move and pick information.
-
Reviews delivery details such as location, date, user, and all the receipts that are received in the location.
-
Reviews details for inbound material.
-
Reviews details for lots in receiving.
-
Understands that there are no problems in all the above stages.
-
Traces the problem to the inbound material.
-
To prevent usage of the material, updates the status of the material to Reject on the Receiving Transaction Details page.
Transaction Management Dashboard
See Inventory Management Command Center Overview.
The Transaction Management Dashboard provides complete insight into the unprocessed transactions and transactions with errors in the following interfaces:
-
Transaction Open Interface
-
Pending Transactions
-
Receiving Open Interface
-
Cycle Count Open Interface
-
Reservations Interface
-
Object Genealogy Interface
Use the dashboard to:
-
Review and examine transactions in an organization, by status, by transaction type, by age, or by an item value.
-
Identify transactions that delay inventory material movement.
-
Analyze reasons for errors.
-
Drill down to view error details for transactions.
-
-
Ensure proper processing of interface data.
-
Take corrective actions such as processing pending and unprocessed transactions.
-
Correct errors by navigating to the underlying business processes in Oracle Inventory and resubmit records for processing. For example, you can update the item attributes using the Organization Items window or correct errors related to lots or transactions in the Item Lots window.
-
If the following descriptive flexfields are set up, then you can select the flexfield segments in the Available Refinements component:
-
Transaction Interface
-
Receiving Transactions Interface
-
Cycle Count Entries Interface
-
Reservations Interface
Access the Transaction Management Dashboard using the following navigation:
(N) Logistics Manager (responsibility) > Command Center > Transaction Management Dashboard
Transaction Statuses in Interfaces
To load and display transactions from interfaces on the Transaction Management Dashboard, the Inventory Transaction Management Data Load concurrent program considers transaction statuses that are listed in the following table.
| Interface | Transaction Status |
|---|---|
| Transaction Open Interface | Ready Not Ready Error |
| Pending Transactions | Ready Not Ready Error |
| Receiving Open Interface | Pending Error |
| Cycle Count Open Interface | Successful Processed with Errors Marked for Recounting Marked for Reprocessing |
| Reservations Interface | Active Inactive Error |
| Object Genealogy Interface | Pending Successful Error |
Transaction Management Dashboard
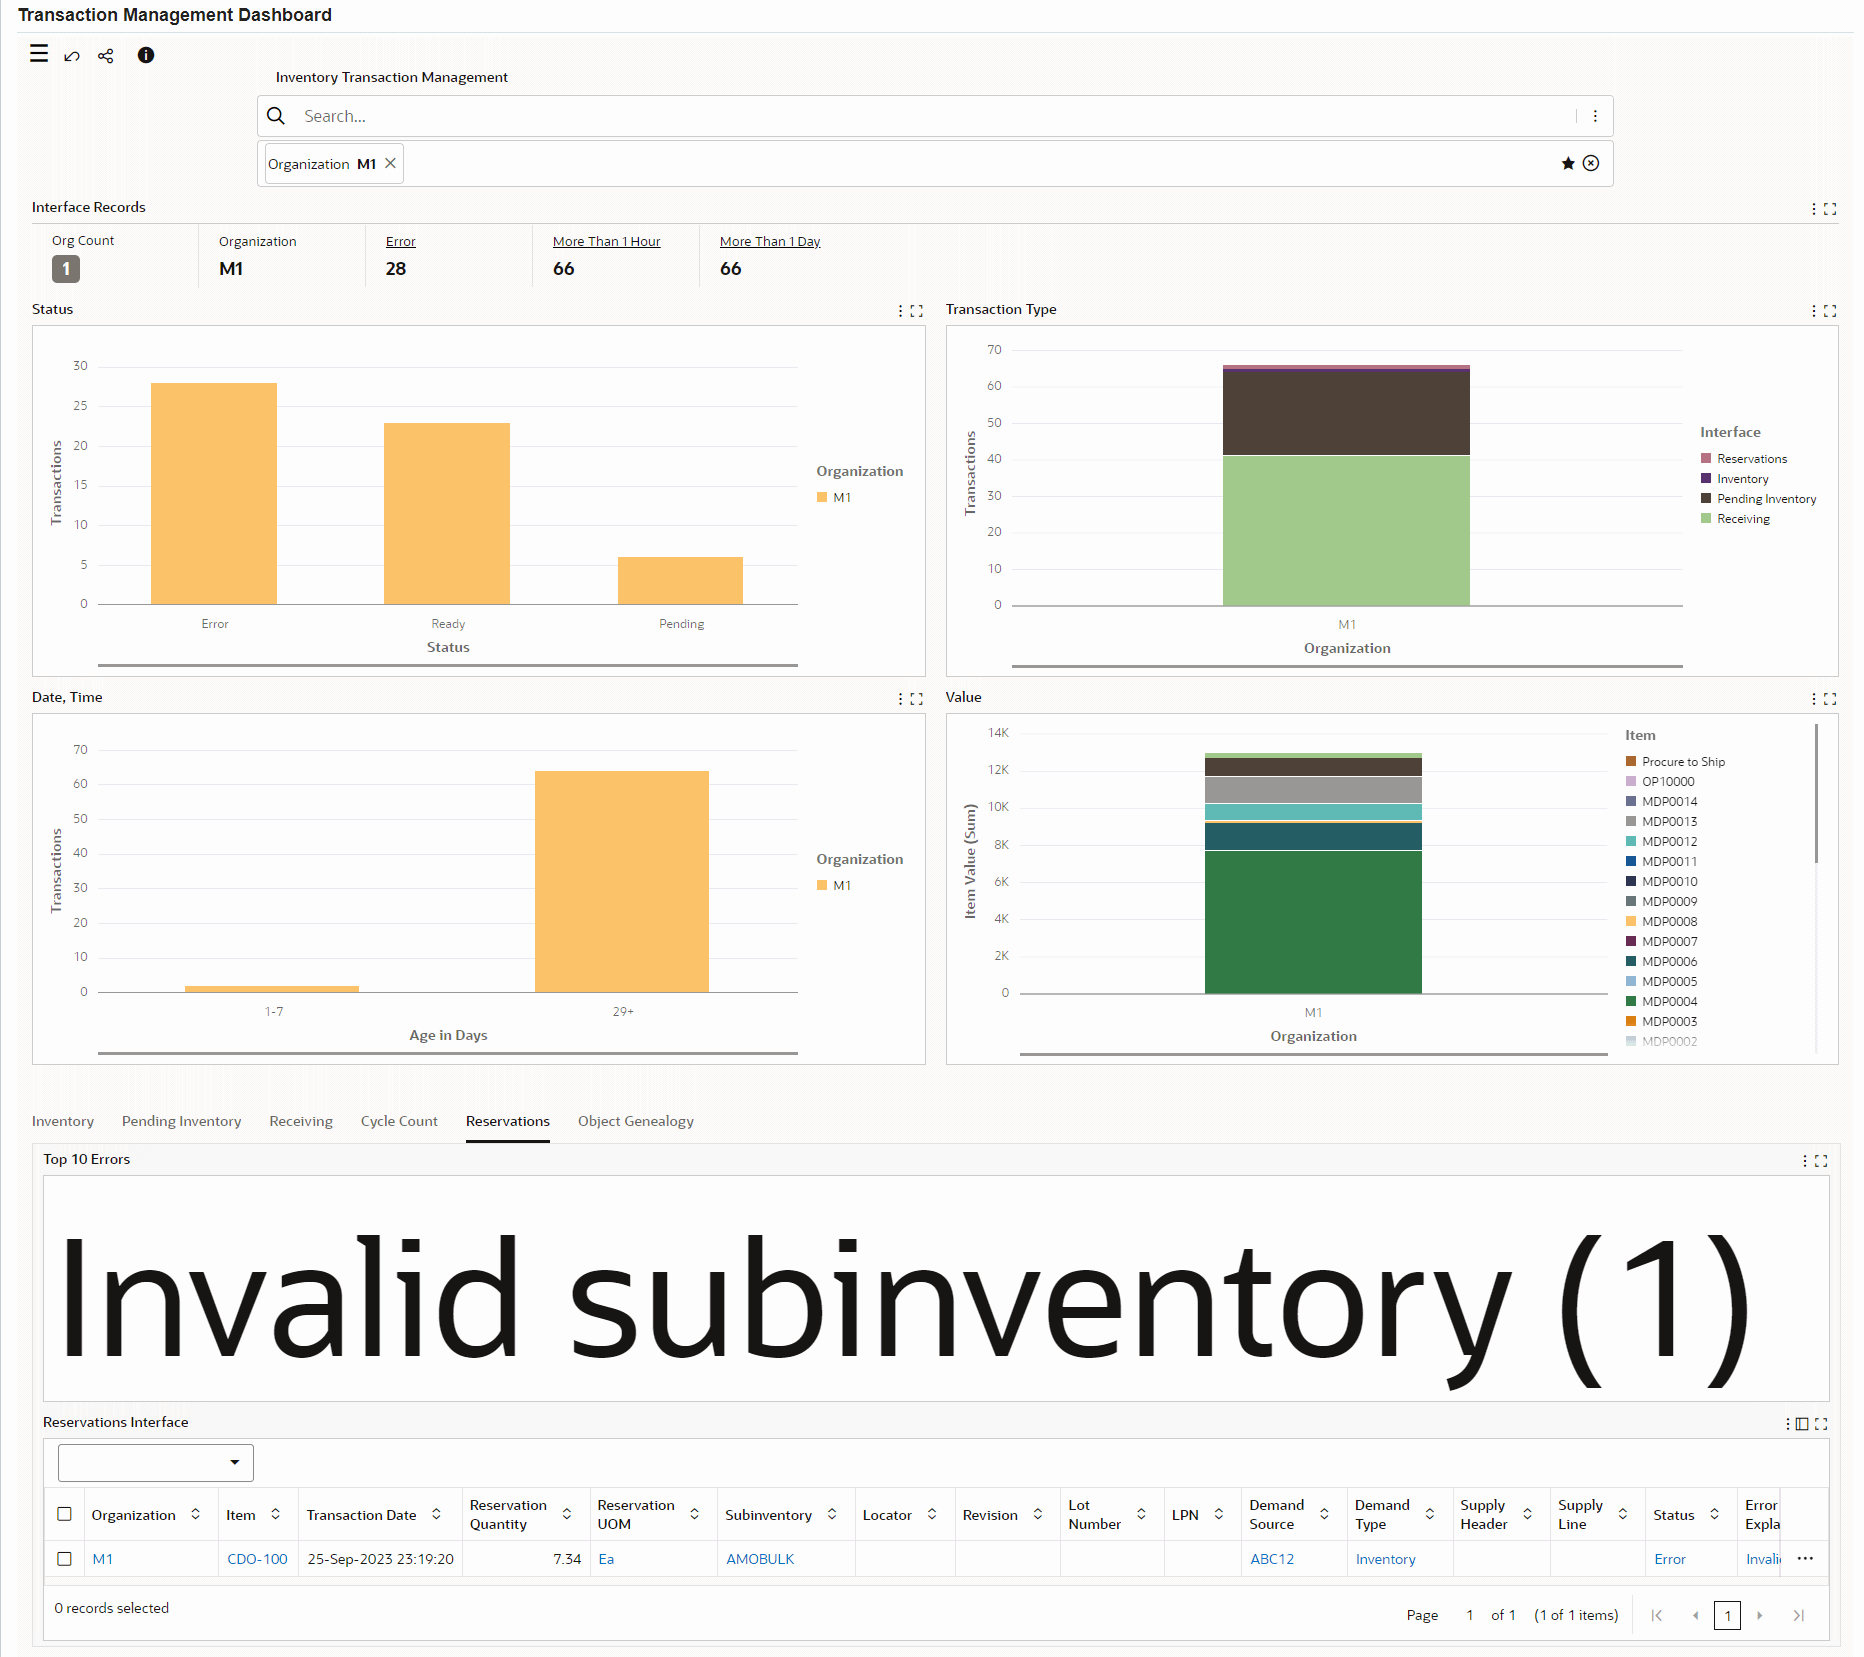
The following table describes the various regions and components on the dashboard:
| Components | Description |
|---|---|
| Interface Records (summary bar) | This summary bar contains the following key metrics. To refine the data, click a metric value.
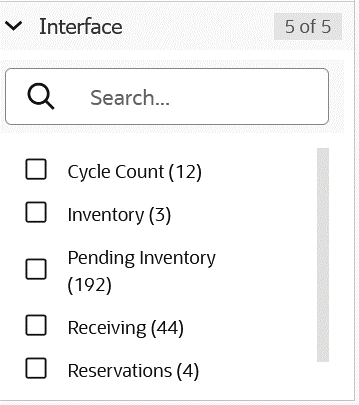
Note: *These two metrics are not applicable to the Object Genealogy interface because the data of this interface is not based on the transaction date. To identify the interface for transactions, click Available Refinements, and then Interface. The Interface attribute lists each interface with the count of transactions. You can further refine your search by selecting a specific interface. Interface Attribute
Use the data from these metrics to prioritize and process transactions. |
| Status (chart) | By default, this chart shows the number of transactions by status in an organization. Select a different group dimension to view the number of transactions by item in an organization. |
| Transaction Type (chart) | This chart shows the number of transactions by transaction type in an organization. |
| Date, Time (chart) | By default, this chart shows the number of transactions for an organization using the following predefined age in days bucket:
You can also select the age in minutes or age in seconds bucket. To view transactions on a specific date, select the Transaction Date group dimension. Use the chart information to prioritize transactions for processing. |
| Value (chart) | This chart shows the sum of item value of transactions for items. The Value chart is specific to an organization.
Note: The Date, Time and Value charts for Object Genealogy do not display data because object genealogy is a hierarchical entity and is not based on quantity and item value. |
| Top 10 Errors (tag cloud) | This tag cloud shows the top 10 processing errors in the following interface tables. You must select an organization to view data in this tag cloud.
For each error explanation, by default, you can view the error count. To view the value of top 10 items with transaction errors, select the Item Value metric. Click an error in the tag cloud to view error details in the relevant results table. |
| Transactions Interface, Pending Inventory, Receiving Interface, Cycle Count Interface, Reservations Interface, Object Genealogy Interface (results tables) | These tables show data for transactions with the status of the transaction in the following interfaces:
You can perform row-level and table-level actions. See: |
Using Actions to Update Interface Transaction Records
To update an interface transaction record, use the actions that are available from the results tables in the following sequence:
-
In the required results table, select the transaction record that you want to modify and then the appropriate row-level action. This action takes you to the corresponding Oracle Inventory window. See Row-Level Actions in the Results Tables.
-
Update the transaction record in the Oracle Inventory window.
-
On the Transaction Management Dashboard, in the required result table, select one or more rows and click the Options icon.
-
Select the relevant process action to submit the concurrent request. See Table-Level Actions in the Results Tables.
System Administrator Tasks
-
Review the concurrent request using the following navigation:
Manufacturing and Distribution Manager (responsibility), Standard > Other > Concurrent > Find Requests
-
Run the Inventory Transaction Management Data Load with the Incremental Load option.
Example: Investigating a Transaction with an Error
The following example explains how you can use the Transaction Management Dashboard components to examine and resolve a transaction with an error.
In this example, the locator details for a transaction record in an inventory organization are incorrect. Therefore, the transaction record in the Transaction Open Interface has the "Locator is not valid" error.
To identify and resolve the error:
-
In the Interface Records summary tab, click the Error metric.
-
In the Inventory tab, Top 10 Errors tag cloud, click the "Locator is not valid. Please re-enter" error cloud. The Transactions Interface results table displays all the transaction records with this error.
-
In a transaction record row, click the row-level Actions icon and then select the Transaction Open Interface action. The Transaction Interface window opens with the Item in context.
-
Update the locator details in the Transaction Interface window.
-
Navigate back to the Transaction Management Dashboard.
-
Scroll to the Transactions Interface results table.
-
Submit the Launch Process Transactions Interface table-level action for the transaction that you updated.
Row-Level Actions in the Results Tables
To perform the following actions, click the row-level Actions icon in the results tables and select an action.
Transactions Interface Row-Level Actions

Pending Inventory Row-Level Actions

Receiving Interface Row-Level Actions

Cycle Count Interface Row-Level Actions

Reservations Interface Row-Level Actions

Object Genealogy Interface Row-Level Actions
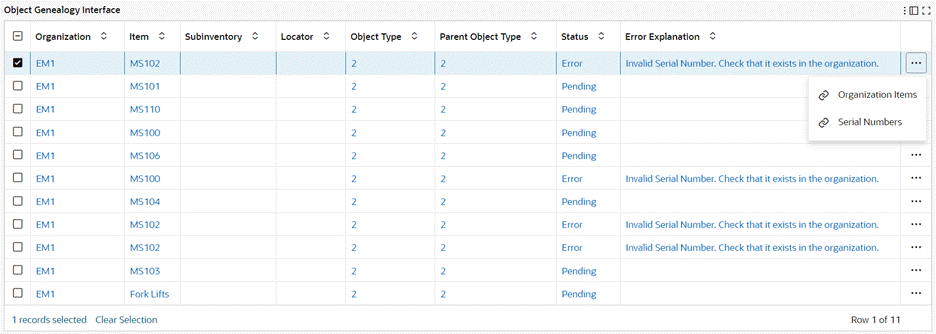
The following table describes the actions that are available from the rows of the results tables.
| Results Table | Action | Description |
|---|---|---|
| Transactions Interface | Transaction Open Interface | To view, edit, and correct a transaction, click Transaction Open Interface to navigate to the Transaction Open Interface window. |
| Transactions Interface Pending Inventory Receiving Interface Cycle Count Interface Reservations Interface Object Genealogy Interface |
Organization Items | To update attributes of an organization-level item, click Organization Items to navigate to the Organization Item window. |
| Transactions Interface Pending Inventory Receiving Interface Cycle Count Interface Reservations Interface |
Lot Numbers | The Lot Numbers action is available only for the lot-controlled items. To modify the attributes of a lot-controlled item, click Lot Numbers to navigate to the Item Lots window. |
| Transactions Interface Pending Inventory Receiving Interface Cycle Count Interface Reservations Interface Object Genealogy Interface |
Serial Numbers | The Serial Numbers action is available only for the serial-controlled items. When you click the Serial Numbers link for a transaction record, the Serial Number window opens with the selected transaction's Organization and Item in context. |
| Pending Inventory | Pending Transactions | To edit and correct a pending transaction, click Pending Transactions to navigate to the Pending Transactions window. |
| Receiving Interface | Receiving Interface | To view details for a receiving transaction, click Receiving Interface to navigate to the Transaction Statuses window. |
| Cycle Count Interface | Cycle Count Interface | To update cycle count entry information or correct an error, click Cycle Count Interface to navigate to the Inquiry/Update Cycle Count Entries Open Interface window. |
| Reservations Interface | Reservations Interface | To process an unprocessed reservation request or a reservation request with an error, click Reservations Interface to navigate to the Reservations Interface window. |
Handling Errors in the Object Genealogy Interface: Because there is no window or page to correct transactions with errors in the Object Genealogy Interface, review these transactions in the interface table. To correct an error, search for the specific lot or serial number in Oracle Inventory.
Table-Level Actions in the Results Tables
Transactions Interface Table-Level Actions

Pending Inventory Table-Level Actions

Receiving Interface Table-Level Actions

Cycle Count Interface Table-Level Actions

Reservations Interface Table-Level Actions

Object Genealogy Interface Table-Level Actions

Important: After you update transactions in the Oracle Inventory windows, you must run the concurrent requests that are available from the Options icon in the results tables. Select one or more rows and click the Options icon to act on your selection.
| Results Table | Action | Description |
|---|---|---|
| Transactions Interface | Launch Process Transactions Interface | This concurrent request processes material transactions after changes to these transactions in any of the transaction windows in Oracle Inventory. In the result table, even if you select one or more records for the action, the application submits the concurrent request for all the Transaction Open Interface transactions that you have updated in Oracle Inventory. |
| Pending Inventory | Launch Process Transactions Interface | In the result table, even if you select one or more records for the request, the application submits the concurrent request for all the Pending Transactions Interface records that you have updated in Oracle Inventory. |
| Receiving Interface | Launch Receiving Transaction Processor | This concurrent request processes pending or unprocessed receiving transactions. In the result table, even if you select one or more records for the action, the application submits the concurrent request for all the Receiving Open Interface records that you have updated in Oracle Inventory. |
| Cycle Count Interface | Import Cycle Count Entries from Open Interface | This process allows you to import cycle count entries open interface records into the database. In the result table, when you select this action, the concurrent request processes cycle count headers of the selected records. |
| Reservations Interface | Launch Reservations Interface Manager | This request processes reservation requests. In the result table, even if you select one or more records for the action, the application submits the concurrent request for all the Reservations Interface records that you have updated in Oracle Inventory. |
| Object Genealogy | Launch Asset Genealogy Import Program | The Asset Genealogy Import process reads information within the MTL_OBJECT_GENEALOGY_INTERFACE table, and then imports that information into the production tables. Refer to the Oracle Enterprise Asset Management Implementation Guide for more information. When you select this action, the concurrent request processes the selected records of the specific Batch ID. |
Replenishment Dashboard
See Inventory Management Command Center Overview.
The Replenishment Dashboard enables you to gain insight into the replenishment processes across inventory for different types of planning. Use the dashboard data to reassess inventory planning to ensure sufficient supply of material is available.
Use the dashboard to:
-
Review inventory health of items that are tracked in the following replenishment processes:
-
Min-max planning
-
Reorder point planning
-
Replenishment counting
-
-
Prioritize low stock for replenishment and manage surplus stock for efficient min-max planning.
-
Manage inventory replenishment by gaining insight into the replenishment count data for a source type.
-
Process replenishment counts to create requisitions for items that need to be ordered or move orders for items to be replenished from a subinventory.
-
Review the stock level for an item at a reorder point and analyze the stock status for each source type.
-
Monitor supply information in the min-max, reorder point, and replenishment counting replenishment processes.
-
Review late supply metric to proactively act on supply issues.
-
Analyze the item's supply information.
-
Track the supply quantity at each supply status.
-
Access the Replenishment Dashboard using the following navigation:
(N) Logistics Manager (responsibility) > Command Center > Replenishment Dashboard
Important: The Replenishment Dashboard displays data only for those items for which the following replenishment planning processes are enabled:
-
Min-max planning
-
Reorder point planning
-
Replenishment counting
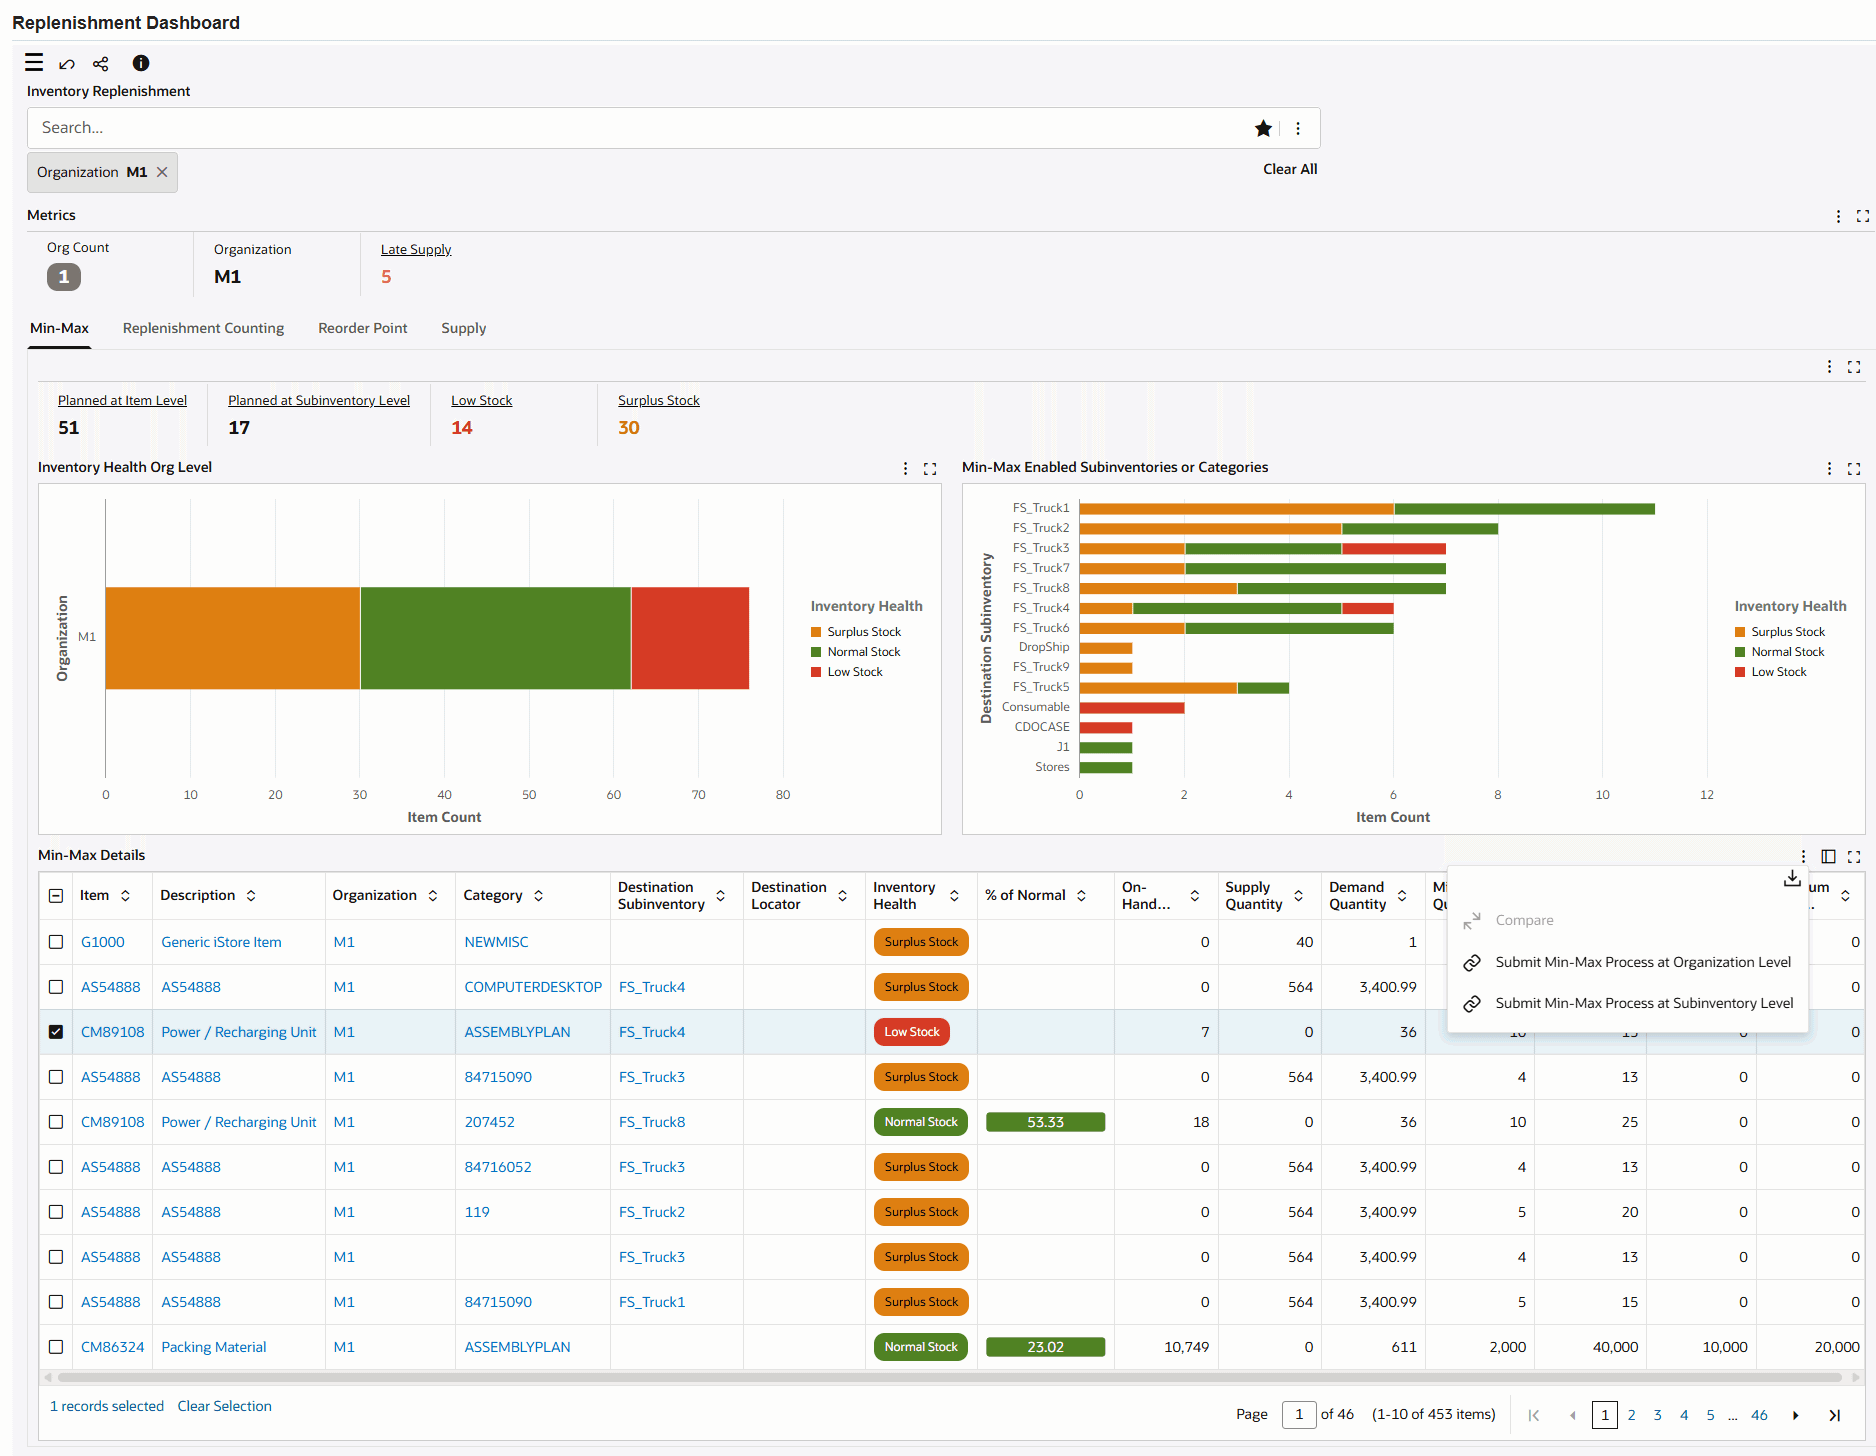
Replenishment Dashboard
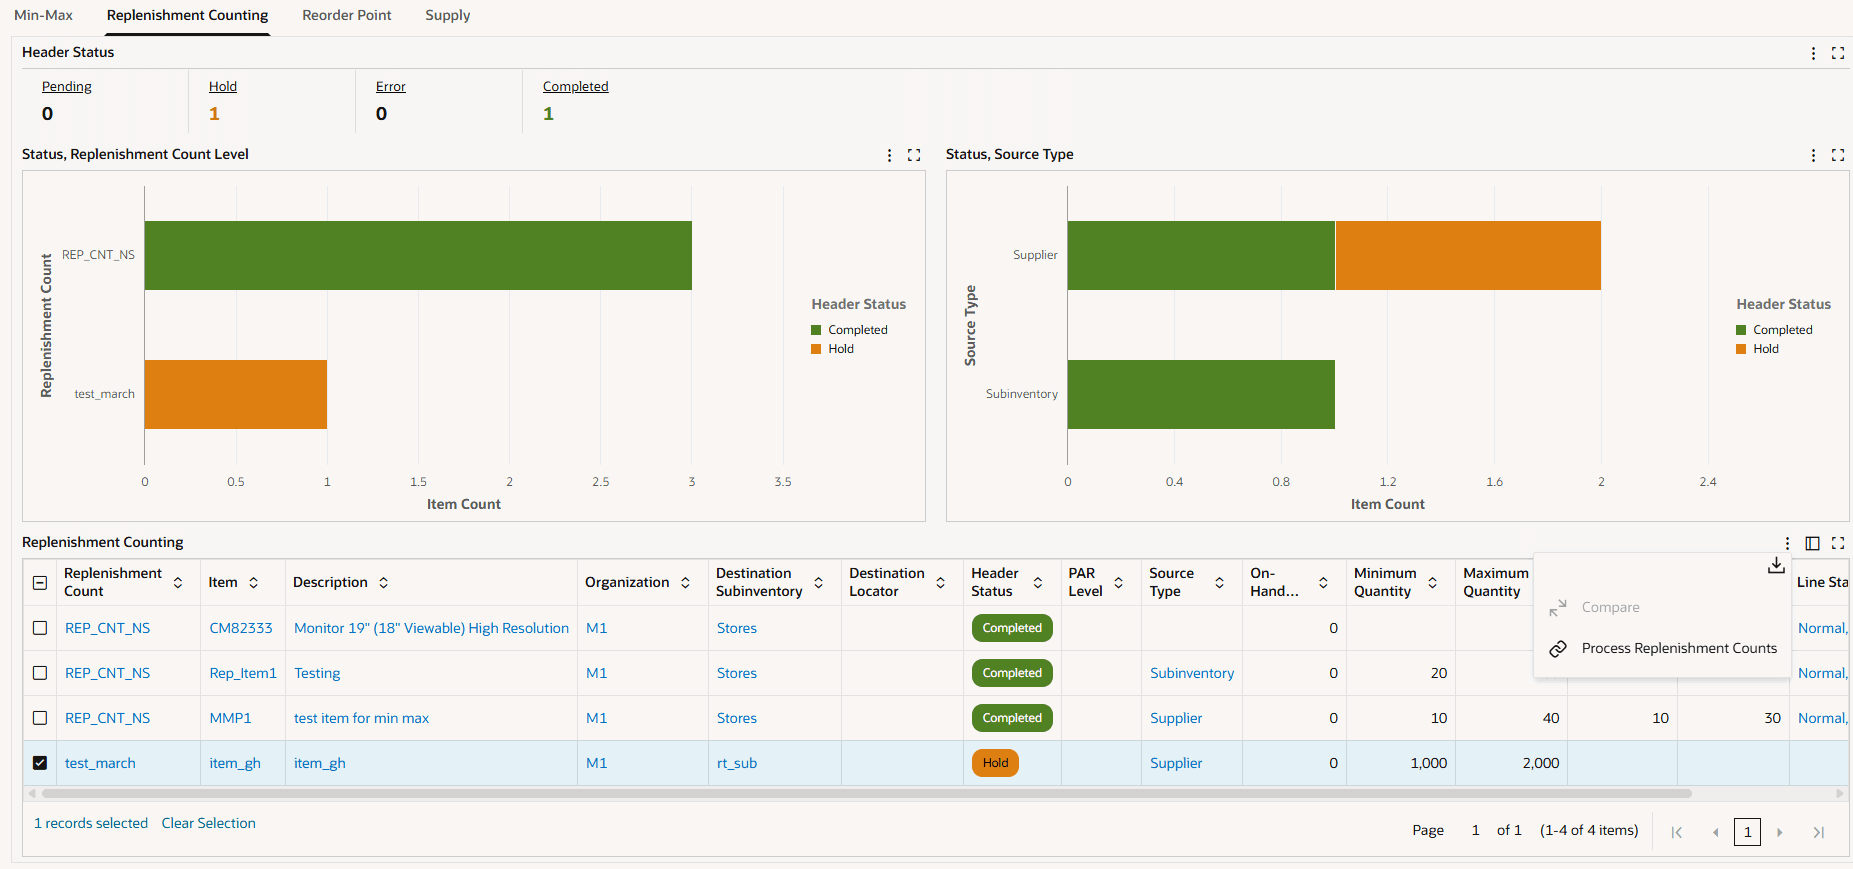
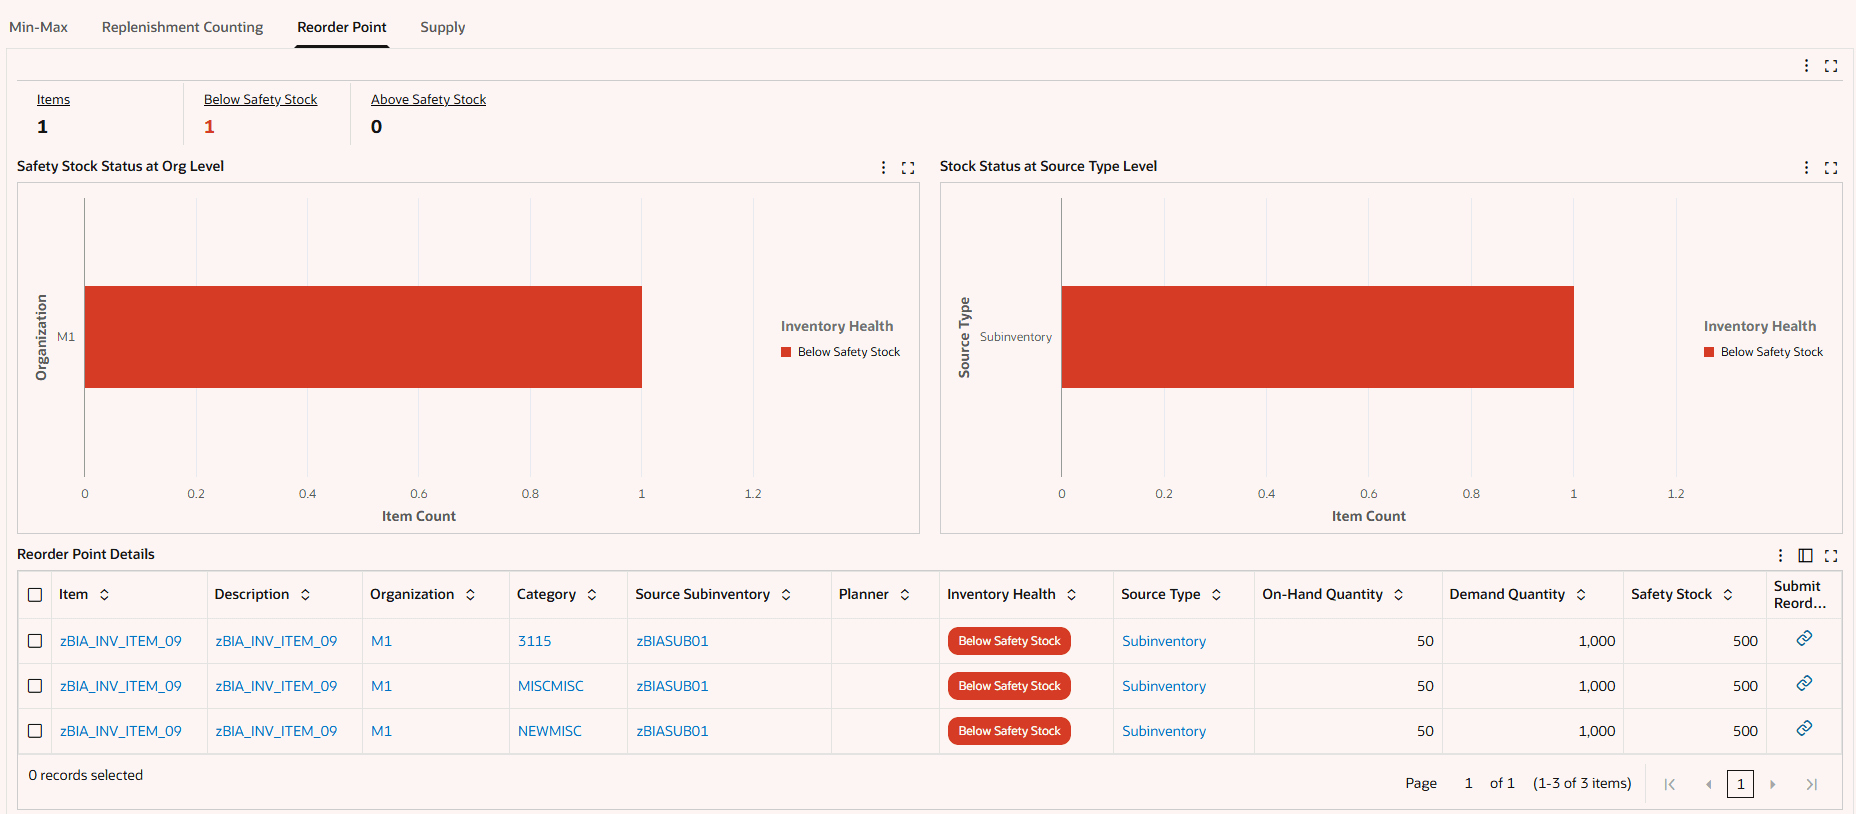
Replenishment Counting Tab
Reorder Point Tab
Supply Tab
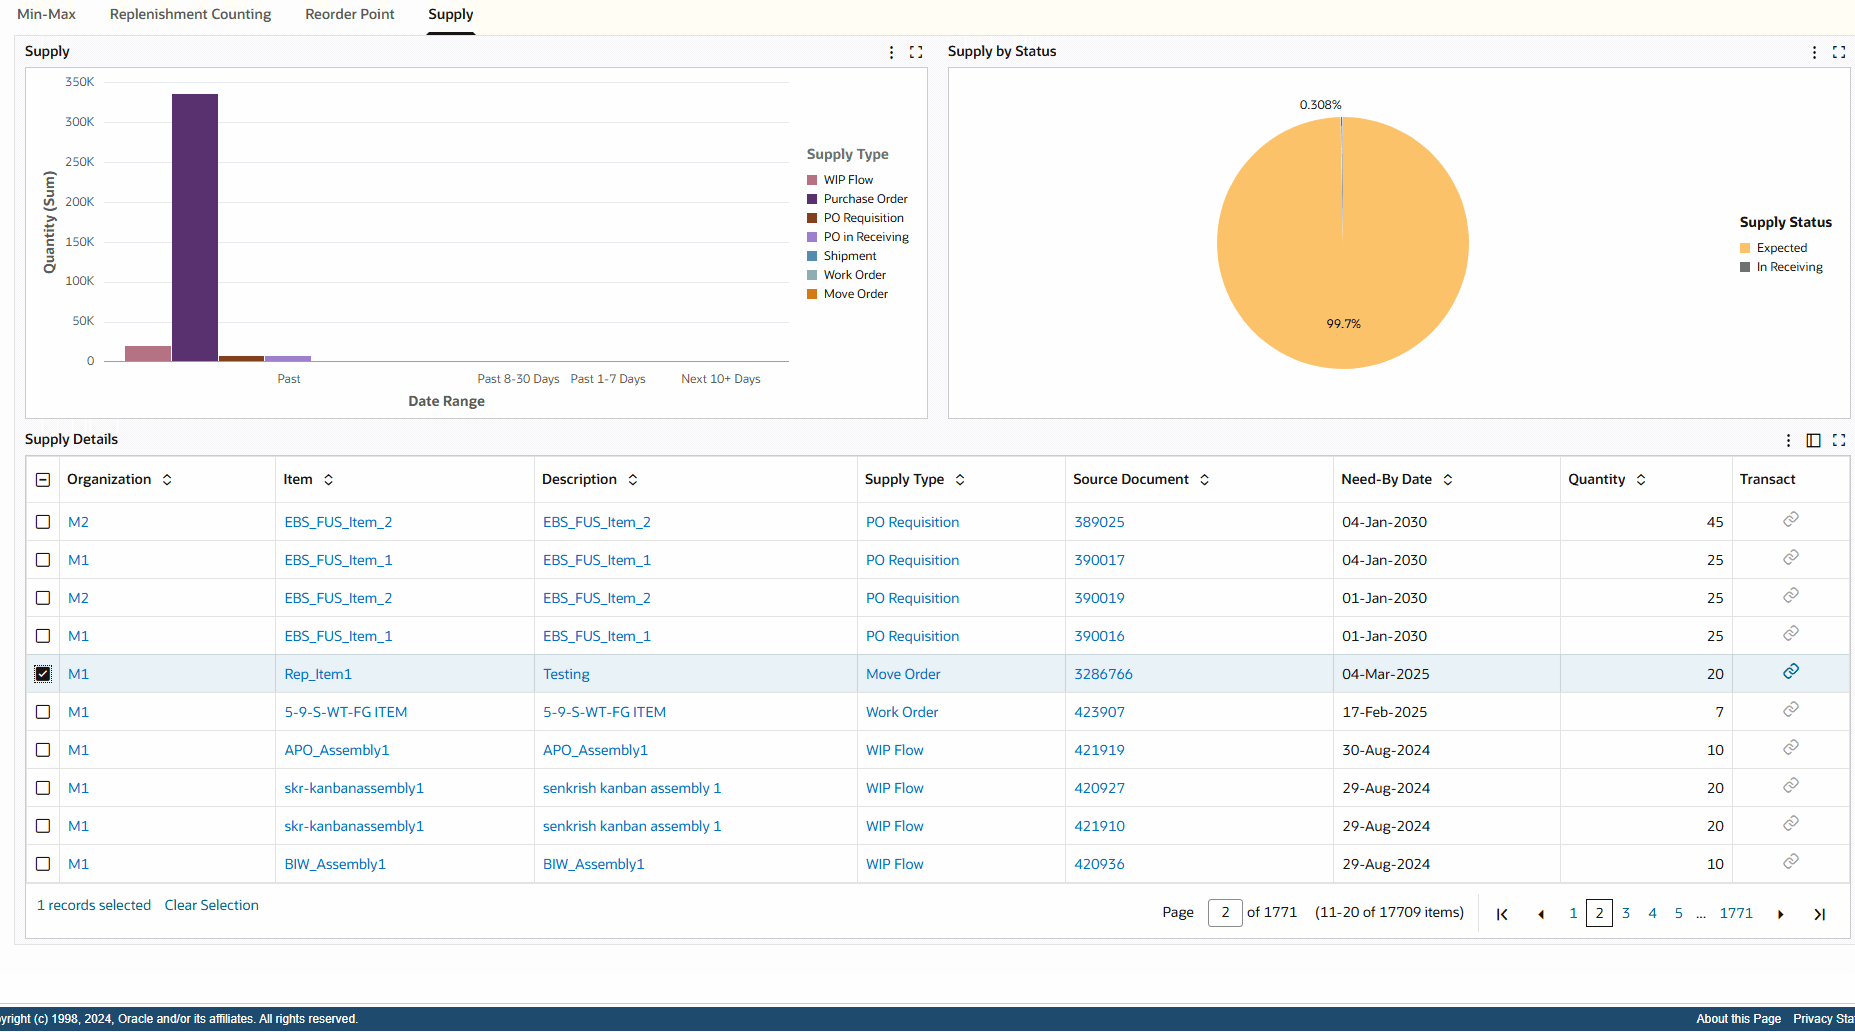
The following table describes the dashboard:
| Components | Description |
|---|---|
| Metrics (summary bar) | This summary bar displays the following metrics.
|
| Min-Max (tab) | This tab shows data for all the items with min-max planning enabled at the item and subinventory levels. Metrics Selecting the following metrics applies a refinement.
Charts This tab shows the following charts:
Min-Max Details (results table) Review the minimum and maximum inventory details for items such as category, destination subinventory, destination locator, on-hand quantity, demand quantity, minimum quantity, and maximum quantity. To perform a table-level action, select one or more rows and choose from the following actions that are available from the Options icon:
|
| Replenishment Counting (tab) | This tab displays data for items that are:
Metrics The tab includes the Header Status (metrics). Selecting the following metrics applies a refinement. These metrics show the status type for replenishment count headers.
Charts This tab shows the following charts:
Replenishment Counting (results table) Review the replenishment counting details such as the item, to subinventory, to locator, header status, line status, PAR level, and source type. To perform a table-level action, select one or more rows and choose from the following actions that are available from the Options icon:
|
| Reorder Point (tab) | This tab shows data for all the items with reorder point planning enabled at the item level. Important: If the safety stock is not defined at the item level for an item, then for that item the safety stock is considered zero (0). Metrics Selecting the following metrics applies a refinement.
Charts This tab shows the following charts:
Reorder Point Details (results table) Review the reorder point information for items such as source subinventory, inventory health, source type, on-hand quantity, demand quantity, and safety stock. You can perform the following actions:
|
| Supply (tab) | This tab tracks the replenishment supply information and includes the following charts.
Supply Details (results table) Use this table to review the supply details for items such as supply type, source document, need-by date, and quantity. You can perform the following actions:
|
Important: After the concurrent programs are submitted successfully, your system administrator must run the Inventory Replenishment Data Load program using the incremental load option. This action ensures that the latest replenishment data is available on the dashboard.
Items Dashboard
See Inventory Management Command Center Overview.
Use the Items Dashboard to efficiently find items to expedite business processes. The dashboard provides visibility over the key attributes of the item master. The dashboard enables you to discover similar, alternate items across organizations and enable parts reuse. You can identify and compare alternate suppliers and manufacturers for parts, resolve item catalog attribute setups causing transaction issues, and track items with pending revision and future effective date. Search for items by entering refinement terms, and analyze and refine the dashboard data by clicking metrics, alerts, and graphs.
Use the dashboard to:
-
Manage direct procurement spend.
-
Find parts, suppliers, and alternates for effective sourcing decisions.
-
Instantly detect duplicate items to optimize inventory across organizations.
-
-
Control product design costs.
-
Compare specifications and costs for better parts reuse.
-
Efficiently manage new product introductions.
-
-
Reduce item administration cost.
-
Expedite item setups to resolve transaction issues.
-
Instantly discover and rectify item catalog discrepancies.
-
Access the Items Dashboard using the following navigation:
(N) Manufacturing and Distribution Manager (responsibility) > Inventory > Items > Items Dashboard
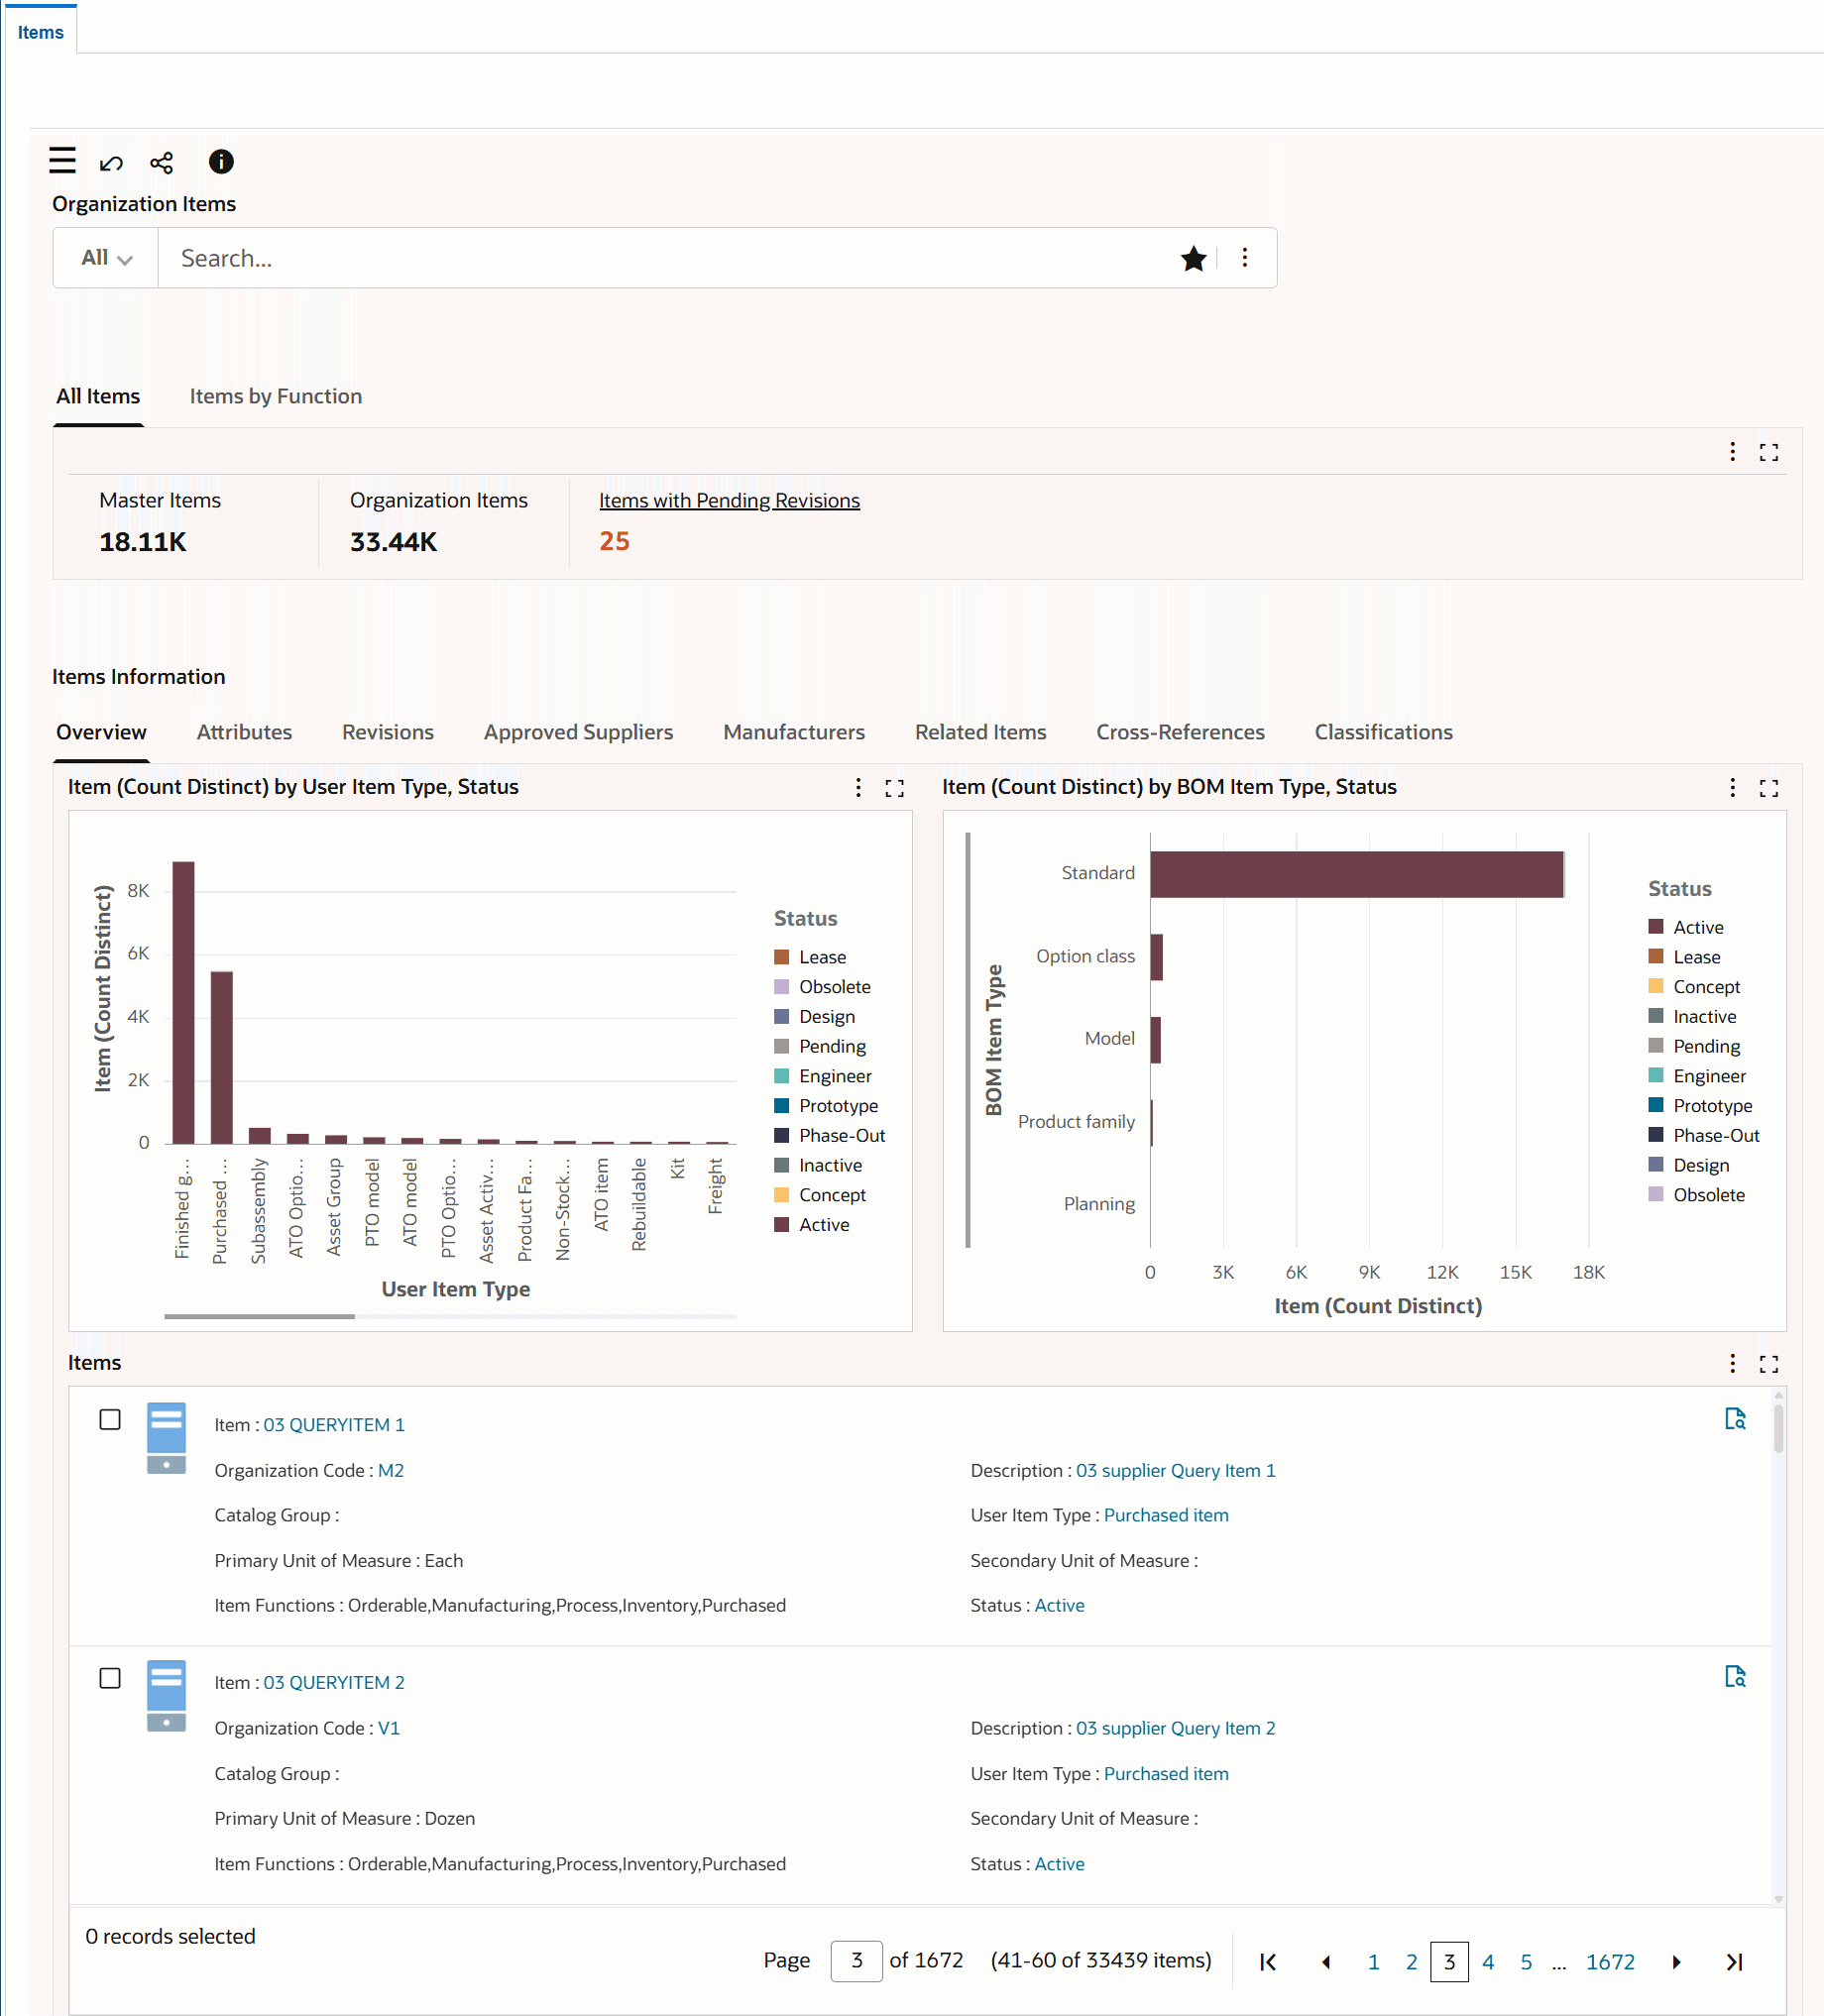
Items Dashboard
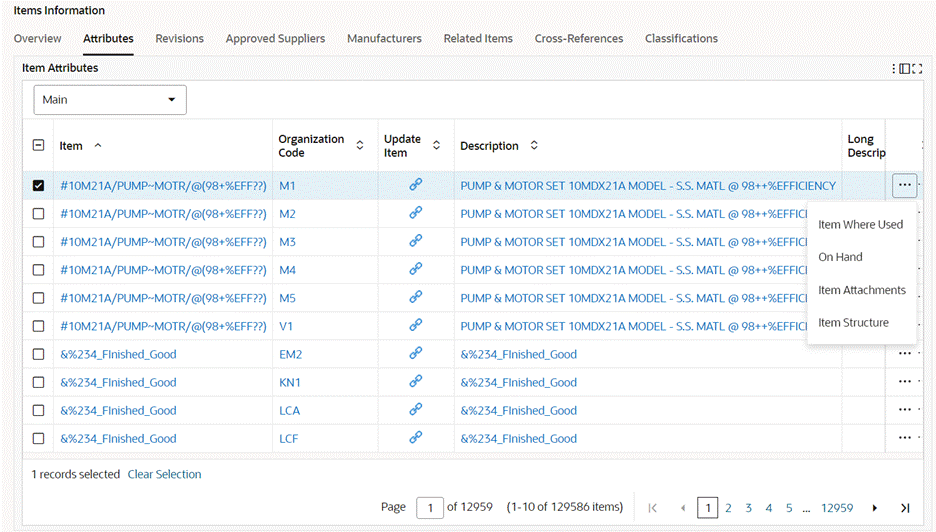
Attributes Tab Row-Level Actions
Note: If suppliers with an item-supplier combination are debarred, that is, the Disabled checkbox is selected in the Purchasing, Approved Supplier List window, then the Items Dashboard does not include these suppliers in the calculation of metrics and charts.
The following table describes the dashboard:
| Components | Description |
|---|---|
| All Items (tab) | This tab contains the following key metrics. You can refine the dashboard data by clicking a metric value.
|
| Items by Function (tab) | This tab contains the following key metrics. You can refine the dashboard data by clicking a metric value.
|
| Items Information (region) Overview (tab) |
This region contains the Overview tab with the following charts:
The record detail section displays key attributes of an item. To view further details of the item, click the Record Details icon. |
| Items Information (region) Attributes (tab) |
This tab contains a table that shows the item attributes. Select an item attribute group from the list to display the details of the selected item attribute group. To update an item's specifications or other related details, click the link icon in the Update Item column to navigate to the Update Overview page. To perform the following actions, click the row- level Actions icon and select an action:
|
| Items Information (region) Revisions (tab) |
This tab contains a table that shows the current, past, and future revisions, organization, revision label and its effective date details, and the revision reason. You can perform the follow row-level actions:
Select an item attribute group from the list to display the details of the selected item attribute group. |
| Items Information (region) Approved Suppliers (tab) |
This tab contains a tag cloud that shows the top ten suppliers. The record details section displays the approved supplier, supplier status, organization code and supplier item details for an item. |
| Items Information (region) Manufacturers (tab) |
This tab contains a tag cloud that shows the top ten manufacturers, and a grid that shows manufacturers. The record details section displays the organization, manufacturer, manufacturer part number, and item manufacturers additional information. To view further details of the item, click the Record Details icon. |
| Items Information (region) Related Items (tab) |
This tab contains a tag cloud that shows the top 10 relationship item types, and a grid that shows related items. The record details section displays the organization, related item, manufacturer part number, and item related additional information. To view further details of the item, click the Record Details icon. |
| Items Information (region) Cross-References (tab) |
This tab contains a tag cloud that shows the top 10 item cross-reference types, and a grid that shows cross-references. To view further details of the item, click the Record Details icon. The record details section displays the organization, cross reference, cross reference type, and item cross-reference additional information. |
| Items Information (region) Classifications (tab) |
This tab contains a tag cloud that shows the top 10 categories, and a grid that shows the categories. To view further details of the item, click the Record Details icon. The record details section displays the item, item description, organization, category set name, category name, category set description, and item category additional information. |
| Options (table-level actions) |
|
Kanban Dashboard
As a Kanban planner or an inventory control supervisor, use the Kanban Dashboard to:
-
Review Kanban pull sequence metrics.
-
Review Kanban card metrics.
-
Track and monitor inventory health using the Inventory Health tab.
-
Review inventory health of Kanban items periodically at various points of use in the organization and identify the pull sequences with low, normal or excess stock.
-
Review the material replenishment history for an item pull sequence and monitor on hand, safety stock, and daily demand quantities.
-
-
View and monitor the replenishment lead time using the Replenishment Lead Time tab.
-
Review replenishment lead time performance.
-
Review the replenishment lead time trend for an item pull sequence by each replenishment cycle of a Kanban card.
-
Visualize total lead time for every replenishment cycle for each Kanban card, by stacking elapsed time in each supply status change of the card.
-
Handle supply exception due to longer replenishment lead time situations.
-
-
Analyze demand requirements using the Kanban Demand tab.
-
Monitor demand for pull sequences at various points of use in the organization
-
Review the material replenishment history for an item pull sequence and track on hand, safety stock, and daily demand quantities.
-
Proactively identify potential future stockout situation due to changes in demand.
-
-
Monitor unmoved cards using the Kanban Cards tab.
-
View the count of Kanban cards by card and supply statuses.
-
Find Kanban cards that have been in a particular supply status for an extended period of time.
-
Use the tile view to review details of Kanban cards and compare one or more Kanban cards by different attributes.
-
Review the replenishment cycle time details for a Kanban card.
-
View the replenishment elapsed time by supply status changes for all replenishments.
-
Use the timeline view of replenishment events.
-
Monitor the replenishment activity details of all replenishments.
-
-
Change the supply status of a single Kanban card or multiple Kanban cards.
-
Take action to follow-up with supply source to ensure timely replenishments.
-
-
View the Replenishment Chain network diagram and use the information to take necessary action.
-
Navigate to other Electronic Kanban Oracle application pages.
You can search using the available refinements for Kanban pull sequences, Kanban cards, Kanban lead time, and Kanban demand. For example, you can select to refine your search using item, point of use, inventory health, source type, lead time, card number, unmoved status, current activity, source, planning, demand report, and so on.
From the eKanban Super User responsibility, navigate to the Kanban Dashboard:
(N) Home (OAF)> Kanban Dashboard (tab)
Kanban Dashboard
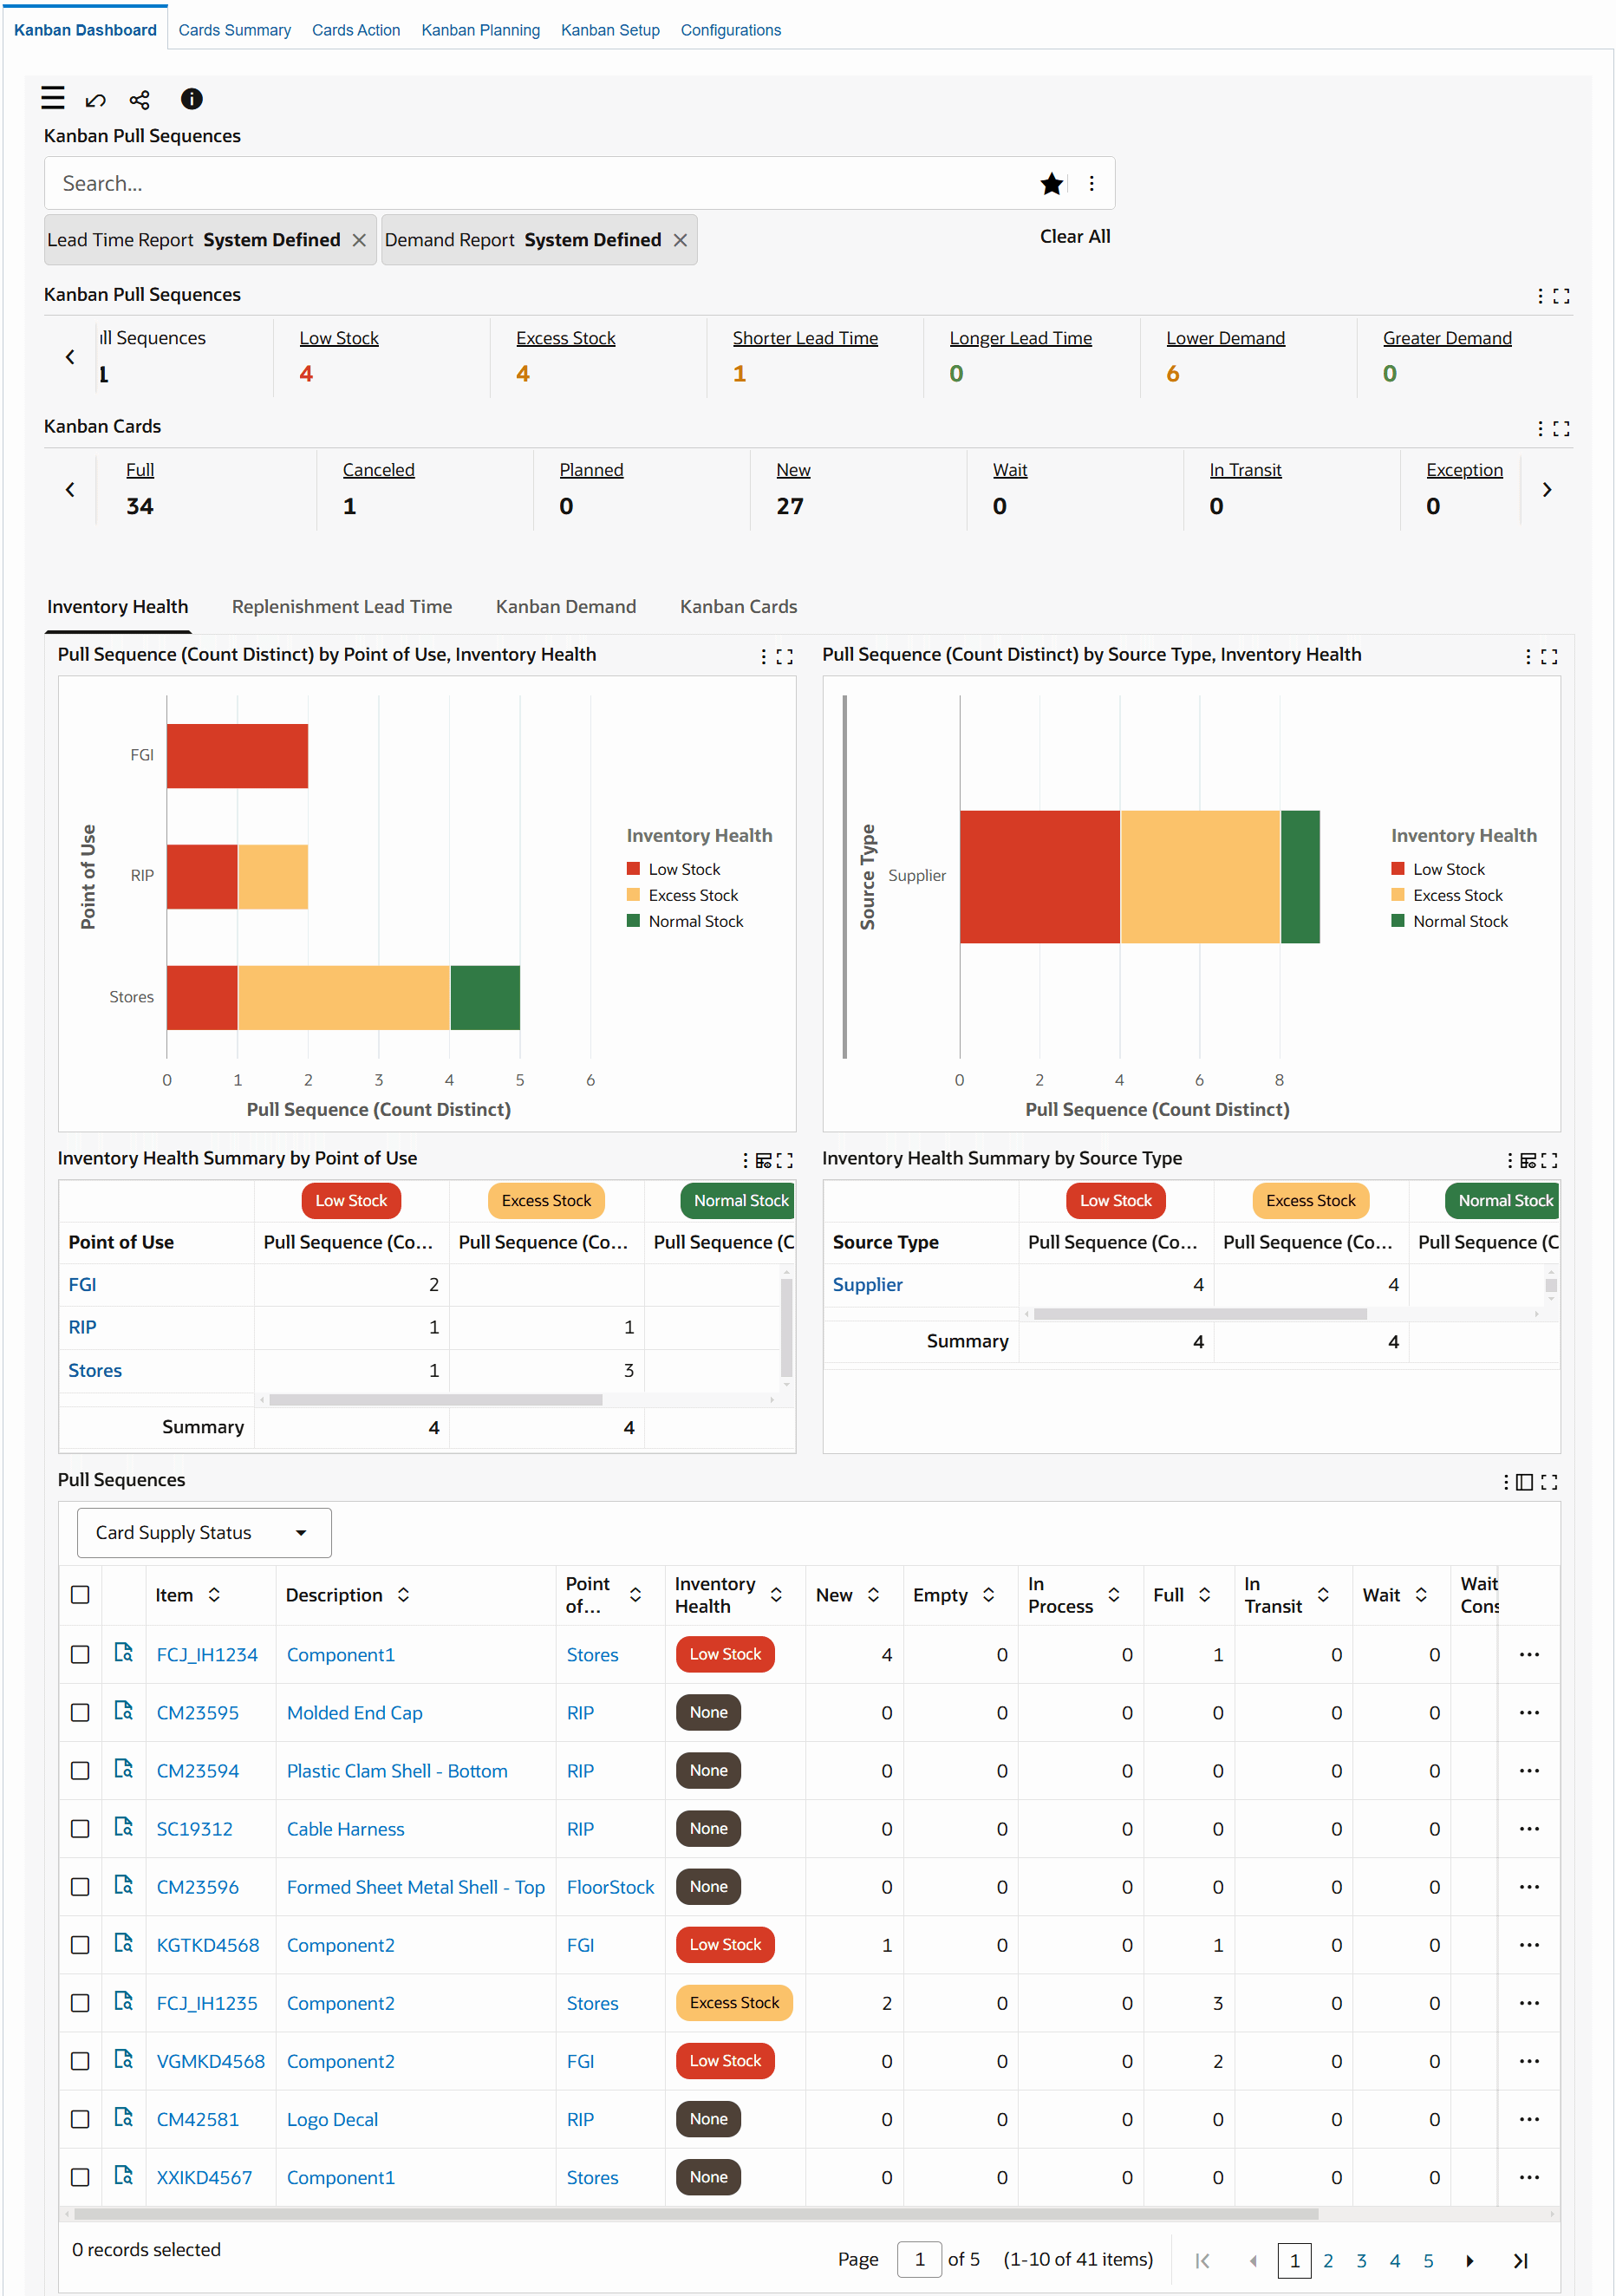
The following table describes the Kanban Dashboard components:
| Component | Description |
| Kanban Pull Sequences (summary bar) | The Kanban Pull Sequences summary bar displays the following metrics:
Click a metric to refine the information in the dashboard. |
| Kanban Cards (summary bar) | The Kanban Cards summary bar displays the following metrics:
Click any of the metrics to view card information in the Kanban Cards tab. |
| Inventory Health (tab) | The Inventory Health tab provides charts and grids that give you insights into the inventory levels versus the safety stocks and enable you to identify the stock positions and take action to meet any demand. You can view the material replenishment history for an item pull sequence in the View Replenishment History chart. For details, see Inventory Health Tab. |
| Replenishment Lead Time (tab) | The Replenishment Lead Time tab provides charts and tables that give you insights into the calculation of the actual lead time of replenished cards for each pull sequence and compares it with the planning lead time. You can use the information in this tab to identify the items with longer lead time and plan the replenishments. You can view the replenishment cycle time trend for an item pull sequence in the View Replenishment Lead Time chart. For details, see Replenishment Lead Time Tab. |
| Kanban Demand (tab) | The Kanban Demand tab provides charts and tables that give you insights into the calculation of the actual demand for each item based on the number of card replenishments and then compares it with demand calculated from the planning logic. You can use this tab to identify the items with greater demand and plan the replenishments accordingly. You can view the replenishment history for an item pull sequence in the View Replenishment History chart. For details, see Kanban Demand Tab. |
| Kanban Cards (tab) | The Kanban Cards tab provides charts and tables that give you insights into the cards that have been in a specific supply status for an extended length of time. You can use this tab to identify such cards and update the status. Use the tile view to review Kanban cards. In the Kanban Cards table, click the View Replenishment History row action to navigate to the following tabs and review information:
For details, see Kanban Cards Tab. |
Inventory Health Tab
The Inventory Health tab displays the inventory levels as compared to the safety stocks. Based on the percentage of the actual inventory to safety stock, inventory health can be categorized into Low Stock, Normal Stock, or Excess Stock.
Inventory Health Metrics Calculations
The following parameters are used in the calculation:
-
Inventory Health Threshold - Bad
The percentage of safety stock inventory considered unacceptable for the Inventory Heath. A value below this threshold is considered at a Low Stock status (Red).
-
Inventory Health Threshold - Good
The percentage of safety stock inventory considered acceptable for the Inventory Heath. A value equal to or greater than this threshold is considered as Excess Stock (Yellow).
Values that are greater than or equal to the Inventory Health Threshold - Bad, or less than the Inventory Health Threshold - Good, are considered as Normal Stock (Green).
Inventory health is displayed as None (Gray) when the parameters are not set up and safety stock days, average daily demand are not defined in the pull sequence. You can define the Average Daily Demand with a specific average demand using the Update Production action in the Planning Workbench. See Viewing and Updating Pull Sequence Planning, Oracle Electronic Kanban User's Guide.
Example: Inventory Health Calculation
The following example explains the inventory health calculation.
In this example, Parameters are set as follows on the Configurations tab, Parameters page. See Configuring Kanban Parameters, Oracle Electronic Kanban User's Guide.
For inventory health threshold:
-
Inventory Health Threshold - Bad: 75 % of safety stock
-
Inventory Health Threshold - Good: 125 % of safety stock
For an item pull sequence:
-
Card Size: 100
-
Safety Stock Days: 2
-
Average Daily Demand: 100
-
Safety Stock: 200 (Average Daily Demand x Safety Stock Days)
Inventory Health calculations is based on the parameters and pull sequence setup:
-
Low Stock (Red) is when inventory is below 75 % of 200 or 150
-
Excess Stock (Yellow) is when inventory is greater than 125% of 200 or 250
-
Normal Stock (Green) is when inventory is between 75% and 125 % of 200, which is between 150 and 250
The following table shows the Inventory Health, which is displayed based on the Cards in Supply Status set to Full.
| Case | Cards in Supply Status Full | Quantity | Inventory Health |
|---|---|---|---|
| 1 | 1 | 100 | Low Stock (Red) |
| 2 | 2 | 200 | Normal Stock (Green) |
| 3 | 3 | 300 | Excess Stock (Yellow) |
Also, Custom Extension is available to define specific values at the Pull Sequence level to override the parameters that are set at the Organization level. See Configure Inventory Health Analytic, Oracle Electronic Kanban User's Guide.
Inventory Health Tab Components
Inventory Health Tab
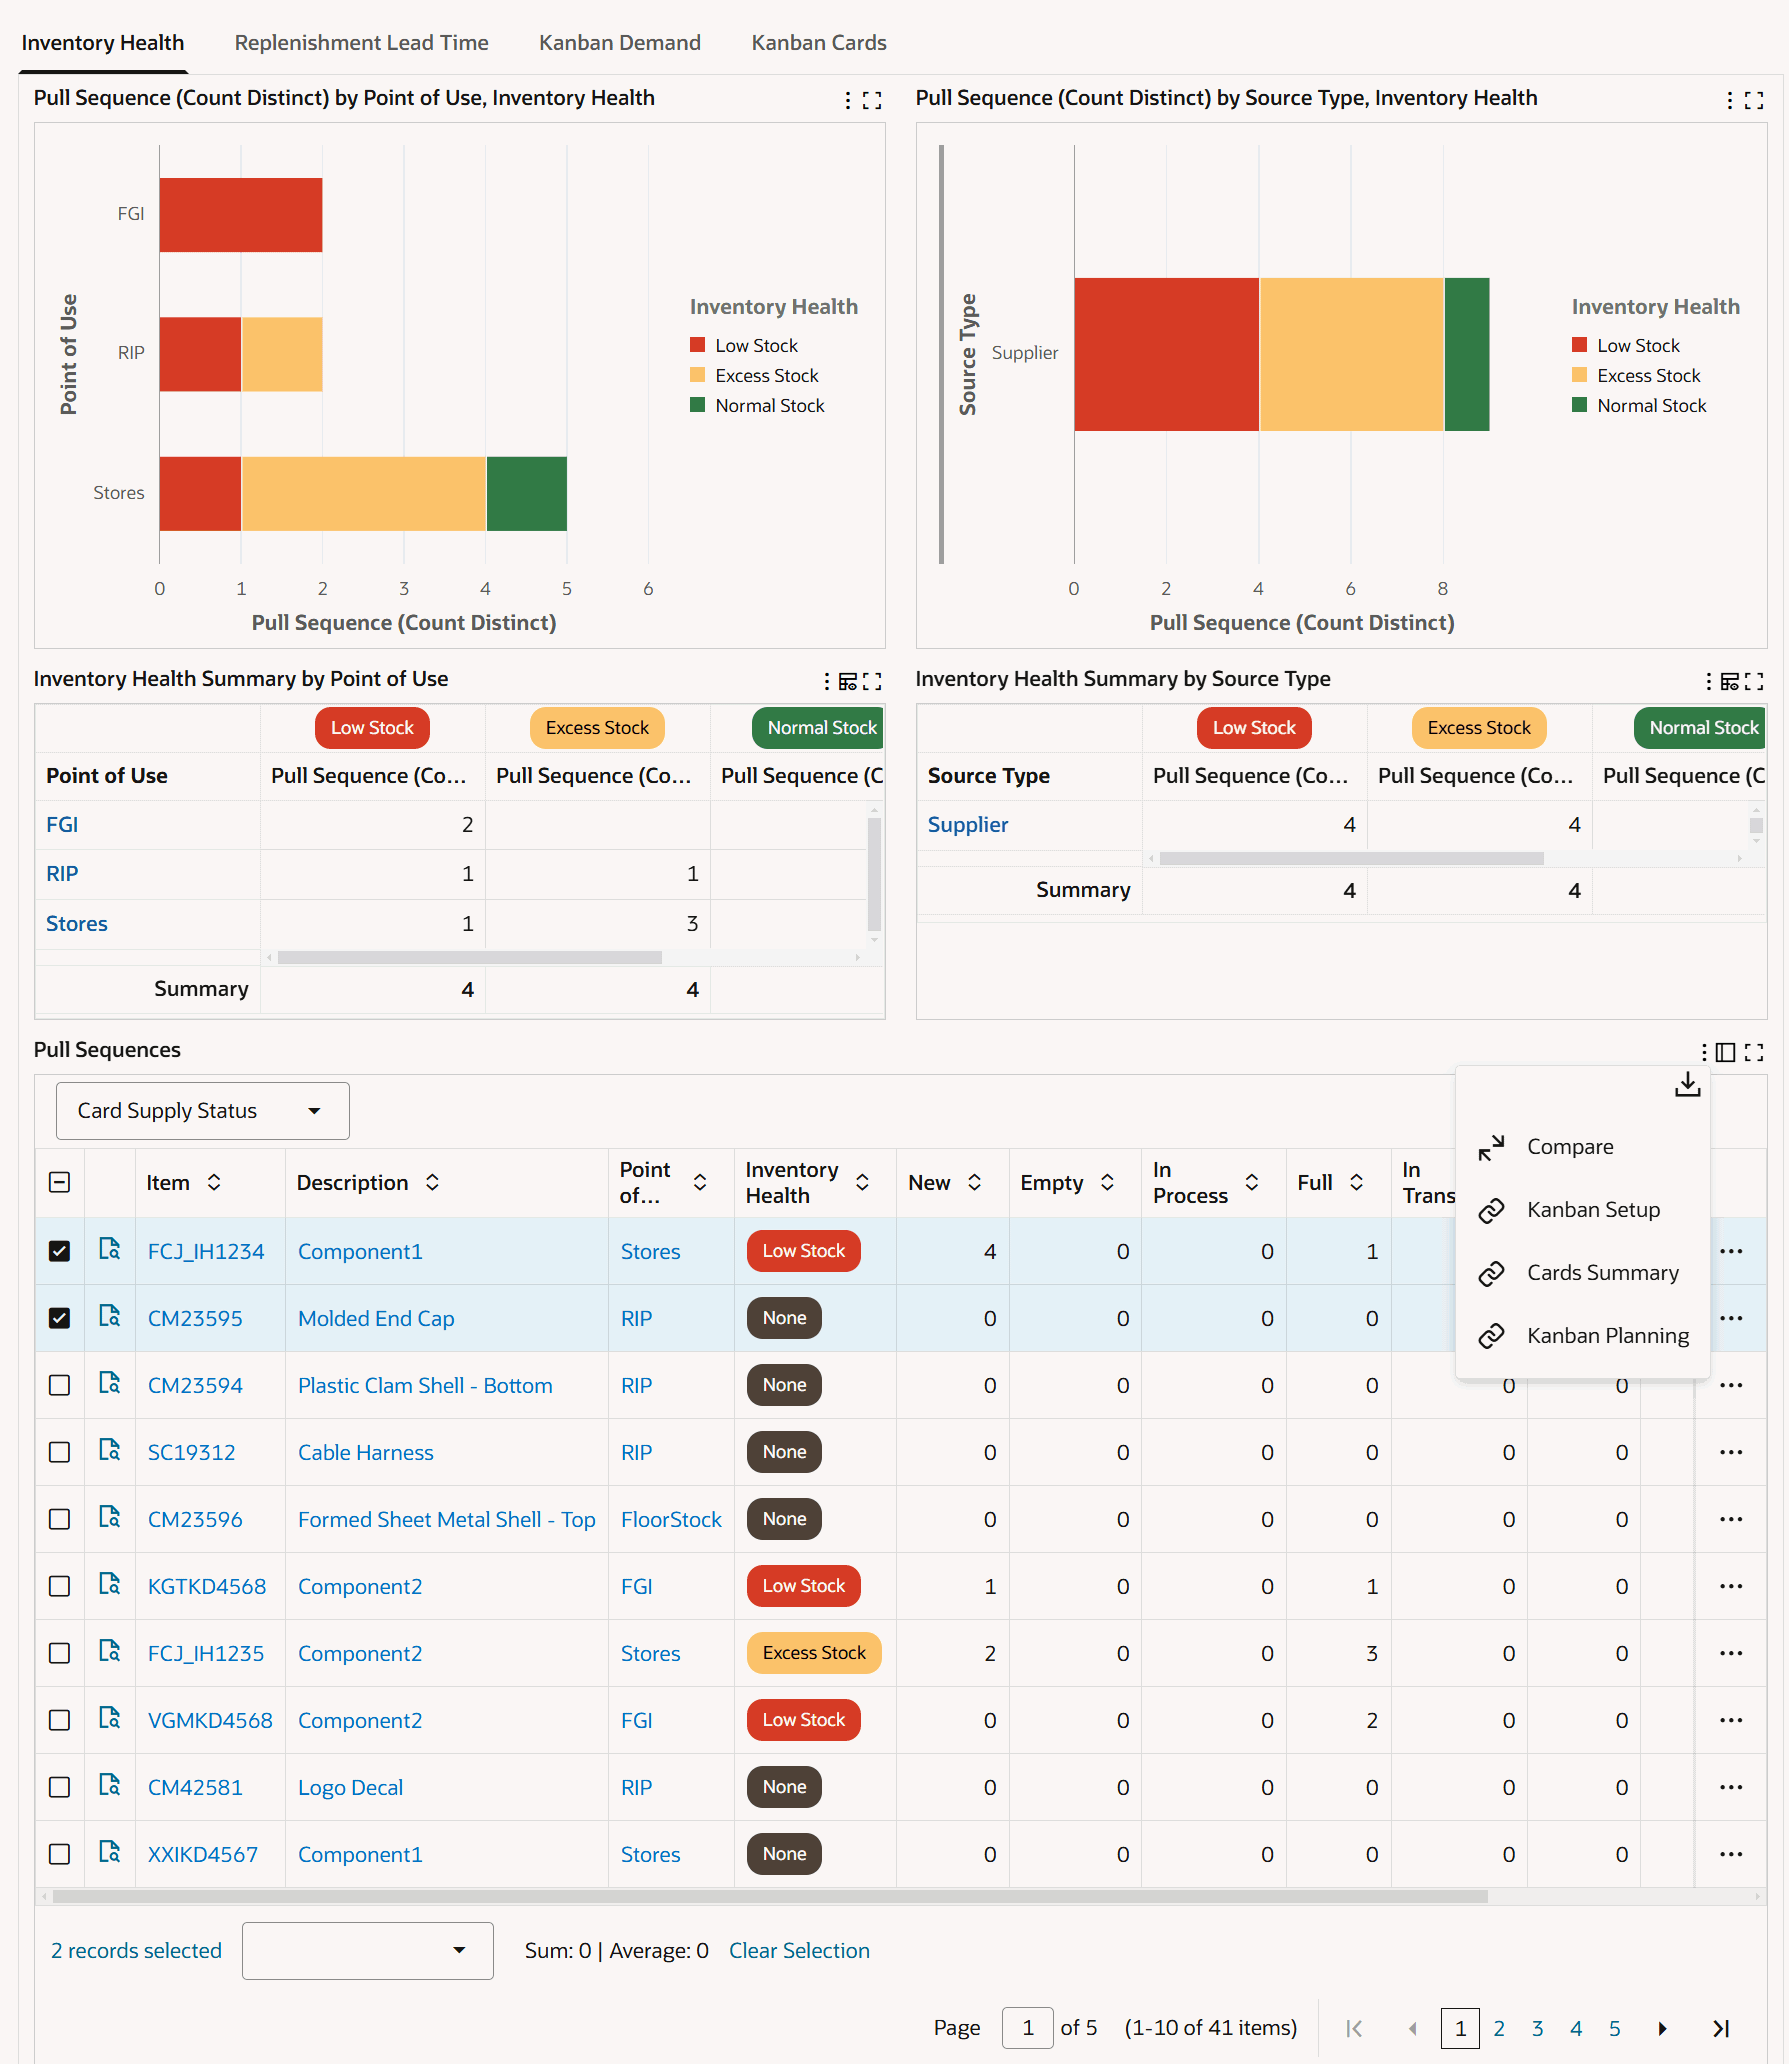
Inventory Health Tab - Row-Level Actions
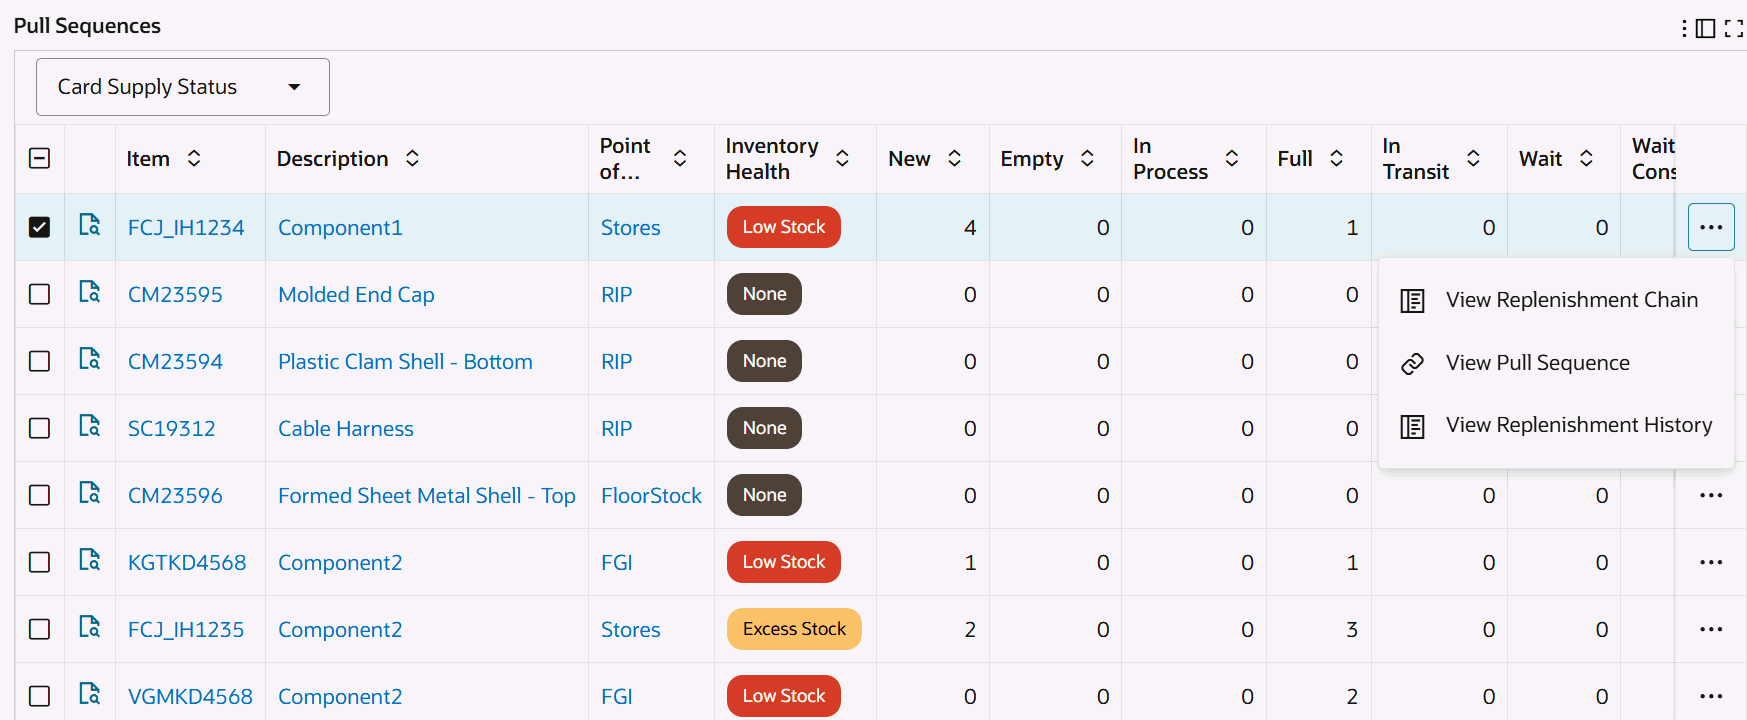
The following table describes the Inventory Health tab components:
| Component | Description |
| Pull Sequence (Count Distinct) by Point of Use, Inventory Health (chart) | This chart displays the inventory health of pull sequences by point of use. Click the Options icon to select Inventory Health or Point of Use from the Dimension menu. Select Point of Use from the Group Dimensions menu. |
| Pull Sequence (Count Distinct) by Source Type, Inventory Health (chart) | This chart displays the inventory health of pull sequences by source type. Click the Options icon to select Inventory Health or Source from the Dimension menu. Select Source Type, Source, Supplier, Source Subinventory, or Source Organization from the Group Dimensions menu. |
| Inventory Health Summary by Point of Use (pivot table) | Use this table to analyze the inventory health of pull sequences by point of use. |
| Inventory Health Summary by Source Type (pivot table) | Use this table to analyze the inventory health of pull sequences by source type. |
| Pull Sequences Results Table (tab layout) | On the Inventory Health tab's Pull Sequences results table, you can select from the following attribute groups to display details by:
Click the Record Details icon for a selected item to view the Details dialog box. Row-Level Actions You can perform the following row-level actions. Select a row, click the Actions icon and select from the following:
Table-Level Actions To perform a table-level action, select one or more rows and choose from the following actions available from the Options icon in the Inventory Health tab's results table:
|
See:
Replenishment Lead Time Tab
The Replenishment Lead Time tab shows the actual lead time of replenished cards for each pull sequence, and compares it with lead time setup in the Planning tabbed region for the pull sequence. See Planning Workbench, Oracle Electronic Kanban User's Guide.
Replenishment Lead Time Metrics Calculations
The dashboard displays the number of pull sequences, taking into account the tolerance value, for:
-
Shorter Lead Time (Yellow) - Actual Lead Time is less than Planned Lead Time
-
Longer Lead Time (Red) - Actual Lead Time is greater than Planned Lead Time
-
Normal Lead Time (Green) - Actual Lead Time is equal to Planned Lead Time
Note: Lead Time will be displayed as None (Gray) when the parameters are not set up and lead time is not defined in the pull sequence or if there are no replenishment cycles completed within the defined range of days.
You can define the default time period and set the value for tolerance using the Electronic Kanban parameters for lead time calculations:
-
Actual vs Planned Lead Time - Default Number of Days
The number of days used to calculate the lead time between actual lead time and planning days for replenished cards and pull sequences.
-
Actual vs Planned Lead Time - Equality Tolerance
The tolerance or margin percentage in the calculation between actual and planned demand lead time.
The following parameter values are used in the "System Defined" report:
-
Actual vs Planned Lead Time - Default Number of Days: Defaults the report range start date based on the number of days from the end date and range end date is defaulted with the current date.
-
Actual vs Planned Lead Time - Equality Tolerance: Defaults the equality tolerance for lead time calculations.
Note: You can also define custom reports with different range start date, range end date and equality tolerance for replenishment lead time calculations.
Example: Replenishment Lead Time Calculation
The following example explains the replenishment lead time calculation.
In this example, Parameters are set as follows on the Configurations tab, Parameters page. See Configuring Kanban Parameters, Oracle Electronic Kanban User's Guide.
For lead time:
-
Actual vs Planned Lead Time - Default Number of Days: 10
-
Actual vs Planned Lead Time - Equality Tolerance: 5
For an item pull sequence:
-
Number of cards: 2
-
Planned Lead Time: 2
The Lead Time calculations is based on the parameters and pull sequence setup.
-
Longer Lead Time (Red) is when replenishment lead time is greater than +5 % of 2 days or 2.1
-
Shorter Lead Time (Yellow) is when replenishment lead time is lesser than -5 % of 2 days or 1.9
-
Normal Lead Time (Green) is when replenishment lead time is between -5% and 5% of 2 days which is between 1.9 and 2.1
Actual Lead Time Calculations
Assume that the number of replenishments in the last 10 days (based on the parameter setting) is 5.
The following table shows the calculation of replenishment lead time and days.
| Replenishment Lead Time | Days |
|---|---|
| Card 1, cycle 1 | 2.5 |
| Card 2, cycle 1 | 2.5 |
| Card 1, cycle 2 | 2.5 |
| Card 2, cycle 2 | 1.8 |
| Card 1, cycle 3 | 2.7 |
| Average Lead Time | (2.5+2.5+2.5+1.8+2.7)/5 = 2.4 days |
In this example, the "System Defined" report shows the pull sequence with Longer Lead Time (Red).
Replenishment Lead Time Tab Components
Replenishment Lead Time Tab
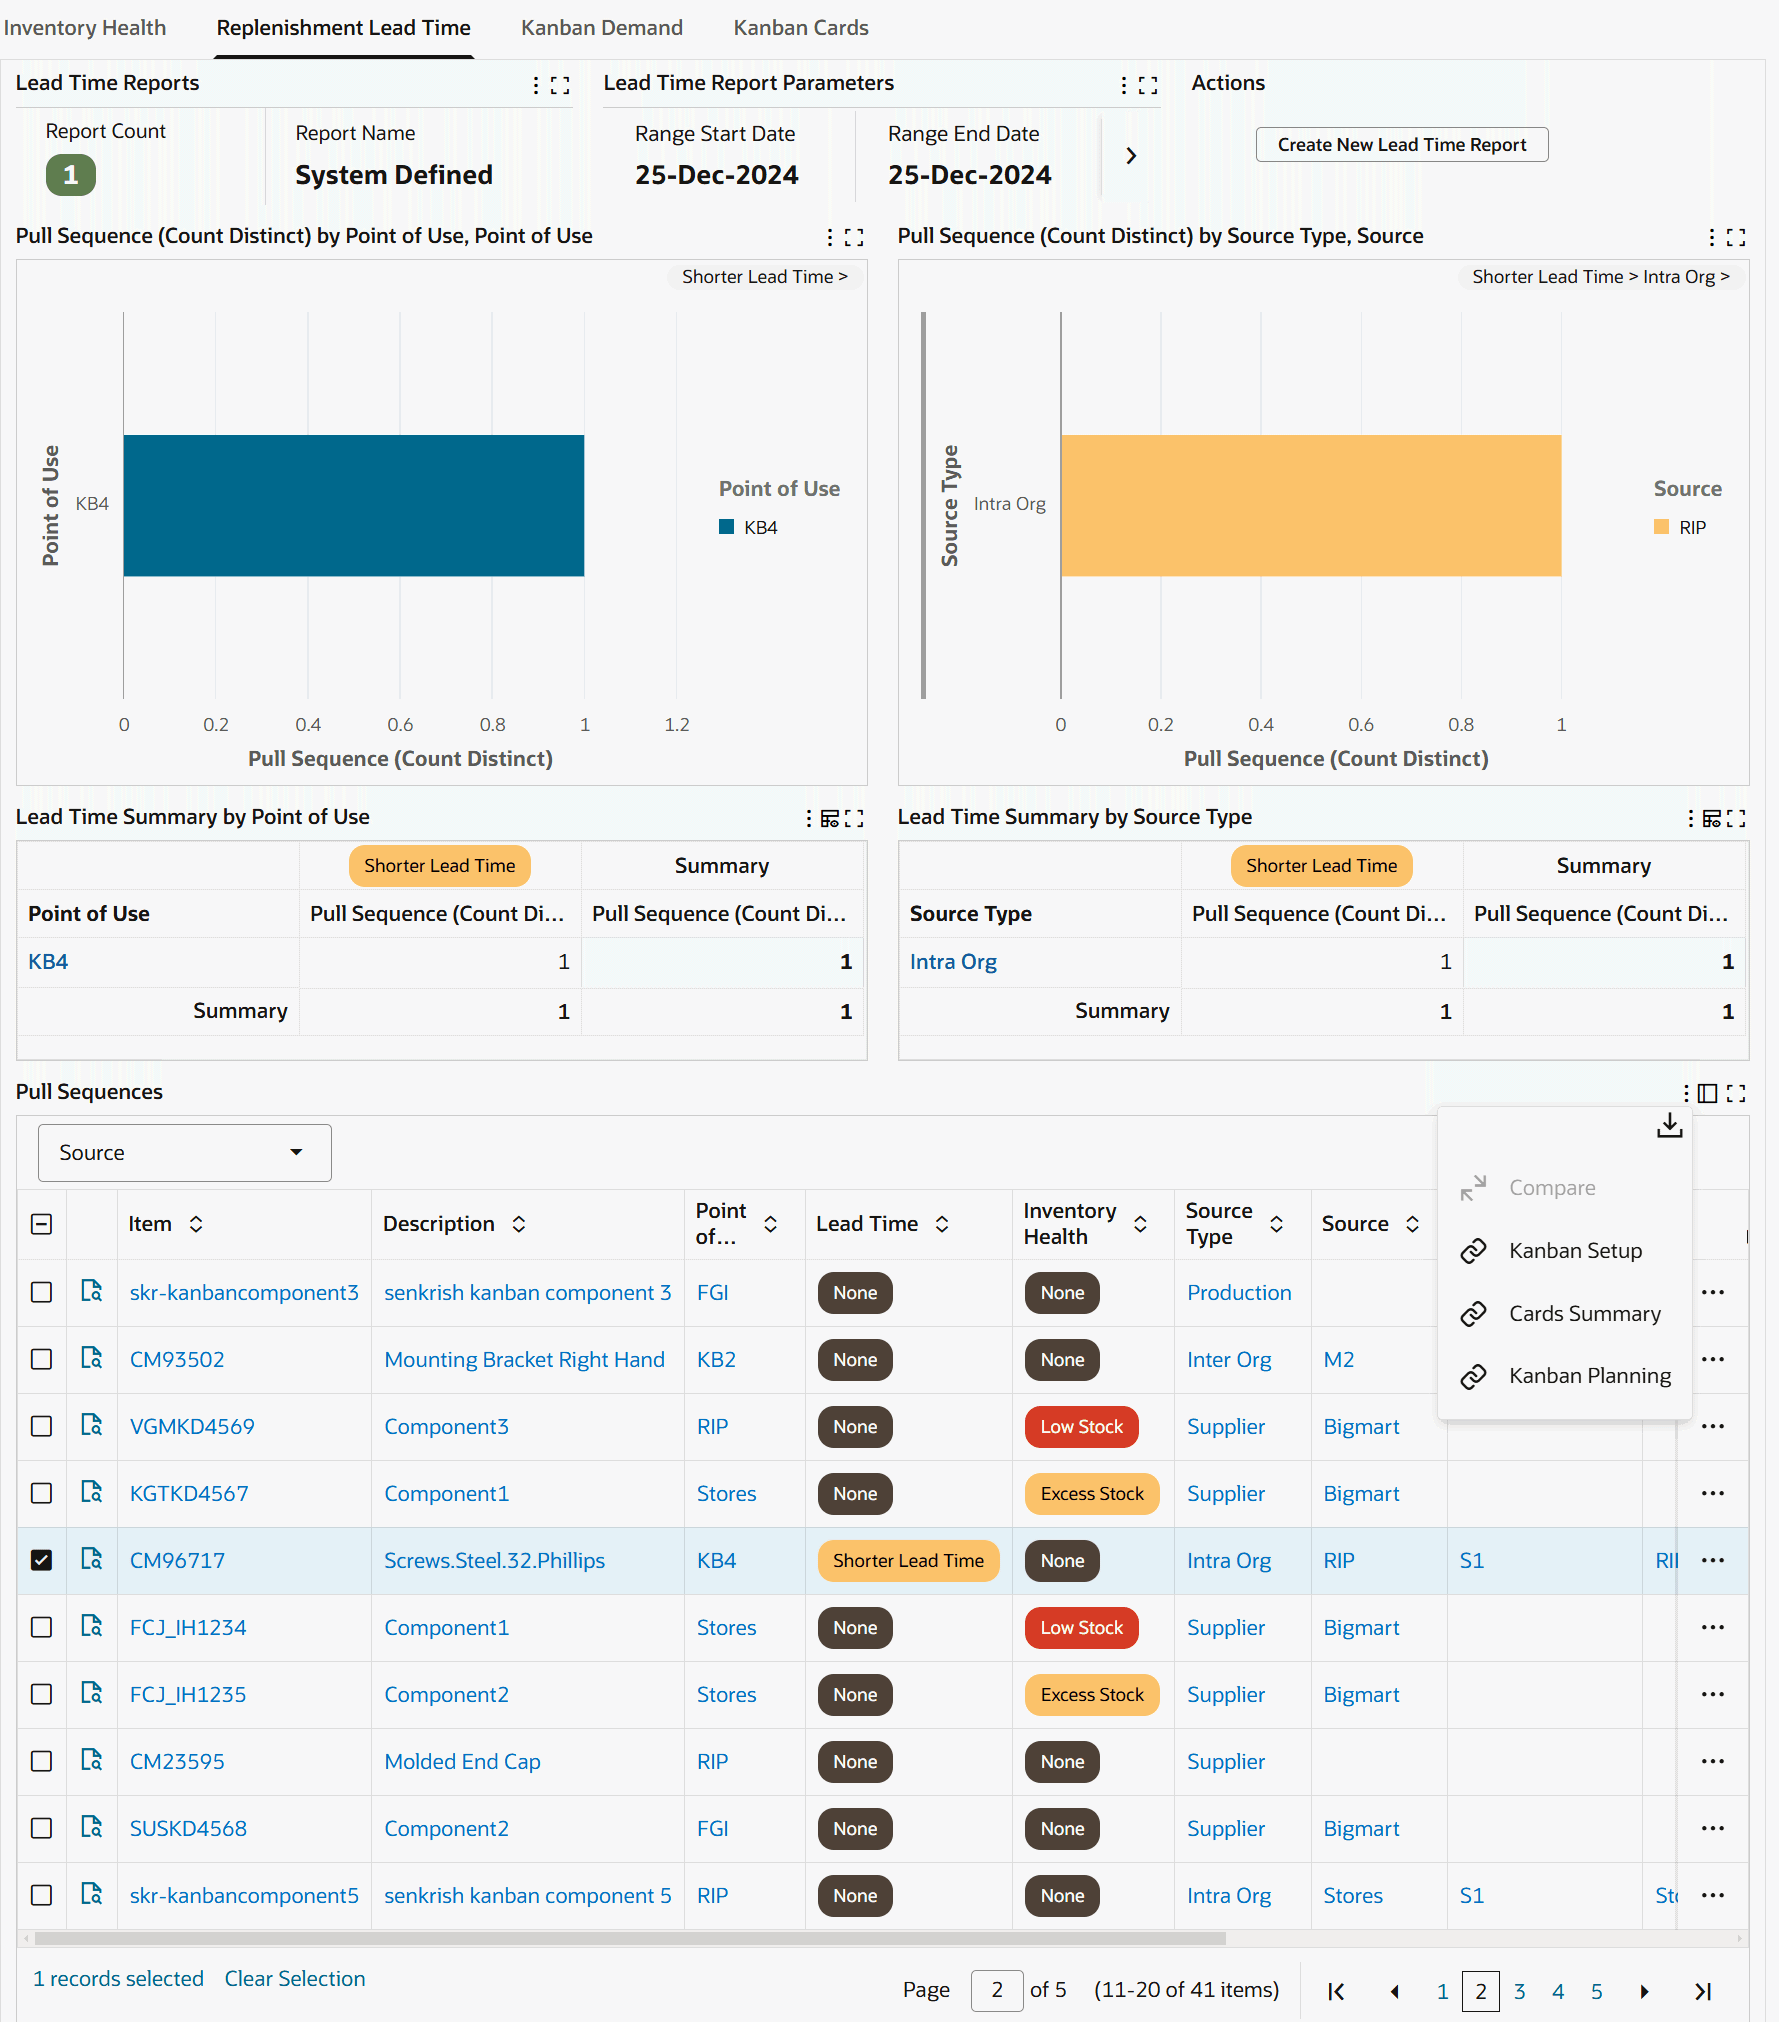
Replenishment Lead Time Tab - Row-Level Actions
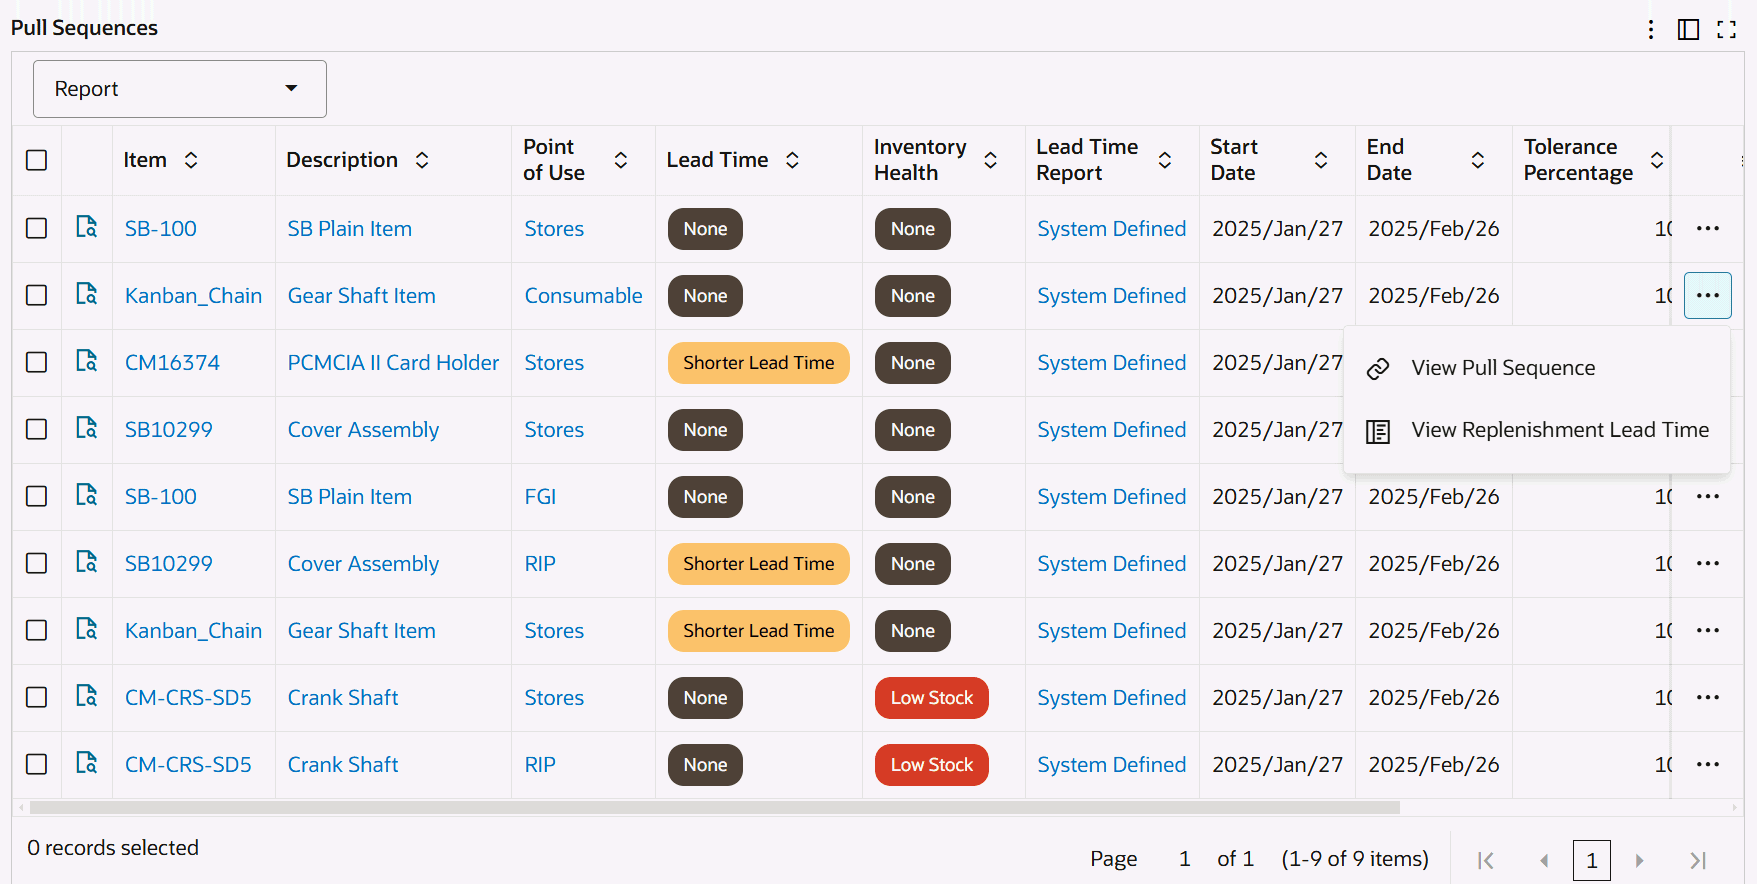
Replenishment Lead Time Chart
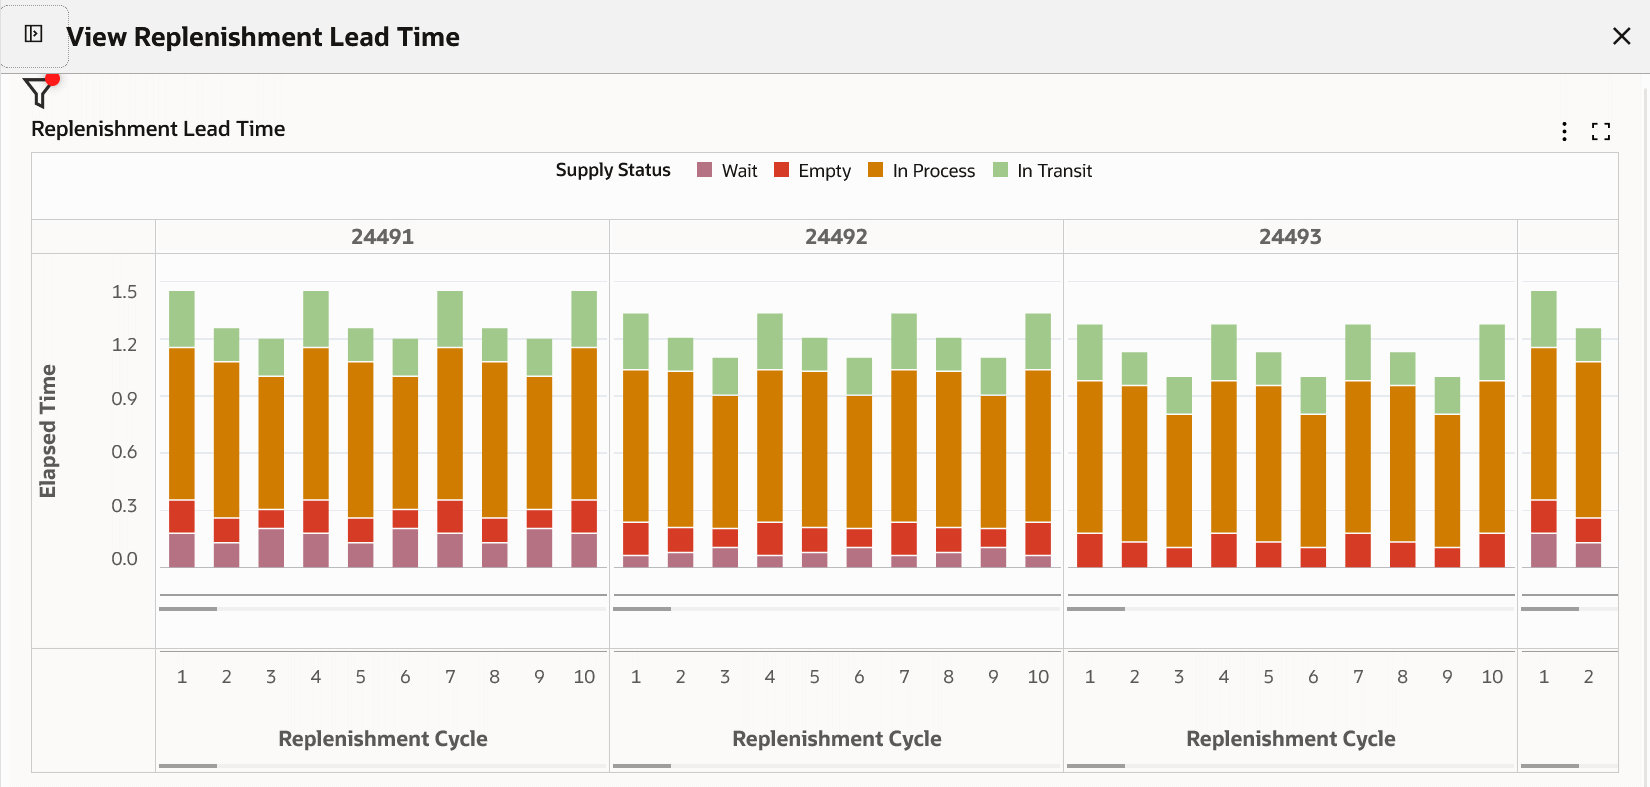
The following table describes the Replenishment Lead Time tab components:
| Component | Description |
| Report Count (link) | Click Report Count to view and select from multiple reports. Note that the Replenishment Lead Time tab defaults the System Defined report based on the parameters set on the Configurations tab, Parameters page. You can only create lead time reports. Note: If your system administrator runs the Electronic Kanban ECC Data Load with the Full Load option, then after the completion of the full load, user defined reports are removed, and the dashboard displays only the system defined report. |
| Create New Lead Time Report (button) | To define a lead time report:
|
| Pull Sequence (Count Distinct) by Point of Use, Lead Time (chart) | This chart enables you to identify the number of pull sequences by point of use based on the Replenishment Lead Time classification. You can drill down on the pull sequence values. Click the Options icon to select Lead Time or Point of Use from the Dimension menu. Select Point of Use from the Group Dimensions menu. |
| Pull Sequence (Count Distinct) by Source Type, Lead Time (chart) | This chart enables you to identify the number of pull sequences by source type based on the Replenishment Lead Time classification. You can drill down on the pull sequence values. Click the Options icon to select Lead Time, Source Type, or Source from the Dimension menu. Select Source Subinventory, Source, Supplier, Source Organization, and Source Inventory from the Group Dimensions menu. |
| Lead Time Summary by Point of Use (pivot table) | Use this table to analyze lead time classification of pull sequences by point of use. |
| Lead Time Summary by Source Type (pivot table) | Use this table to analyze lead time classification of pull sequences by source type. |
| Pull Sequences Results Table (tab layout) | On the Replenishment Lead Time tab's Pull Sequences results table, you can select from the following attribute groups to display details by:
Click the Record Details icon for a selected item to view the Details dialog box. Click the links in the table columns to refine the information available in the Kanban Dashboard. Row-Level Actions You can perform the following row-level actions. Select a row, click the Actions icon and select from the following:
Table-Level Actions To perform a table-level action, select one or more rows and choose from the following actions available from the Options icon in the Replenishment Lead Time tab's results table:
|
See:
Kanban Demand Tab
In the Actual Demand versus Planned Demand calculation, the actual demand is calculated for each pull sequence, and compared with average daily demand as calculated from the planning logic. The dashboard displays the number of pull sequences where actual demand is greater than planned, less than planned, and equal to planned, taking into account the tolerance value.
Demand Metrics Calculations
You can define the default time period and set the value for tolerance using the Electronic Kanban parameters for demand calculations:
-
Actual vs Planned Demand - Default Number of Days
The time period for calculating demand between actual lead time and planning days for replenished cards
-
Actual vs Planned Demand - Equality Tolerance
Tolerance in the calculation between actual and planned demand for replenished cards.
Demand is displayed as None (Gray) when the parameters are not set up or average daily demand is not defined in the pull sequence or if there are no replenishments performed within the defined range of days. You can define the Average Daily Demand with a specific average demand using the Update Production action in the Planning Workbench. See Viewing and Updating Pull Sequence Planning, Oracle Electronic Kanban User's Guide.
The following parameter values are used in the "System Defined" report.
-
Actual vs Planned Demand - Default Number of Days: Defaults the report range start date based on the number of days from the end date and range end date is defaulted with current date.
-
Actual vs Planned Demand - Equality Tolerance: Defaults the equality tolerance for demand calculations.
Note: You can also define custom reports with different range start date, range end date and equality tolerance for demand calculations.
Example: Demand Calculation
The following example explains the Demand calculation.
In this example, Parameters are set as follows on the Configurations tab, Parameters page. See Configuring Kanban Parameters, Oracle Electronic Kanban User's Guide.
For demand:
-
Actual vs Planned Demand - Default Number of Days: 50
-
Actual vs Planned Demand - Equality Tolerance: 10
For an item pull sequence:
-
Average Daily Demand: 10
-
Card Size: 100
Demand calculations is based on the parameters and pull sequence setup.
-
Greater Demand (Red) is when demand is greater than +10 % of 10 or 11
-
Lower Demand (Yellow) is when demand is lesser than -10 % of 10 or 9
-
Normal Demand (Green) is when demand is between -10 % and 10 % of 10 which is between 9 and 11
Actual Demand Calculations:
-
Number of replenishments in 50 days: 6
-
Actual Demand = 100 * 6 / 50 = 12 per day
In this example, the "System Defined" report shows the pull sequence with Greater Demand (Red).
Kanban Demand Tab Components
Kanban Demand Tab
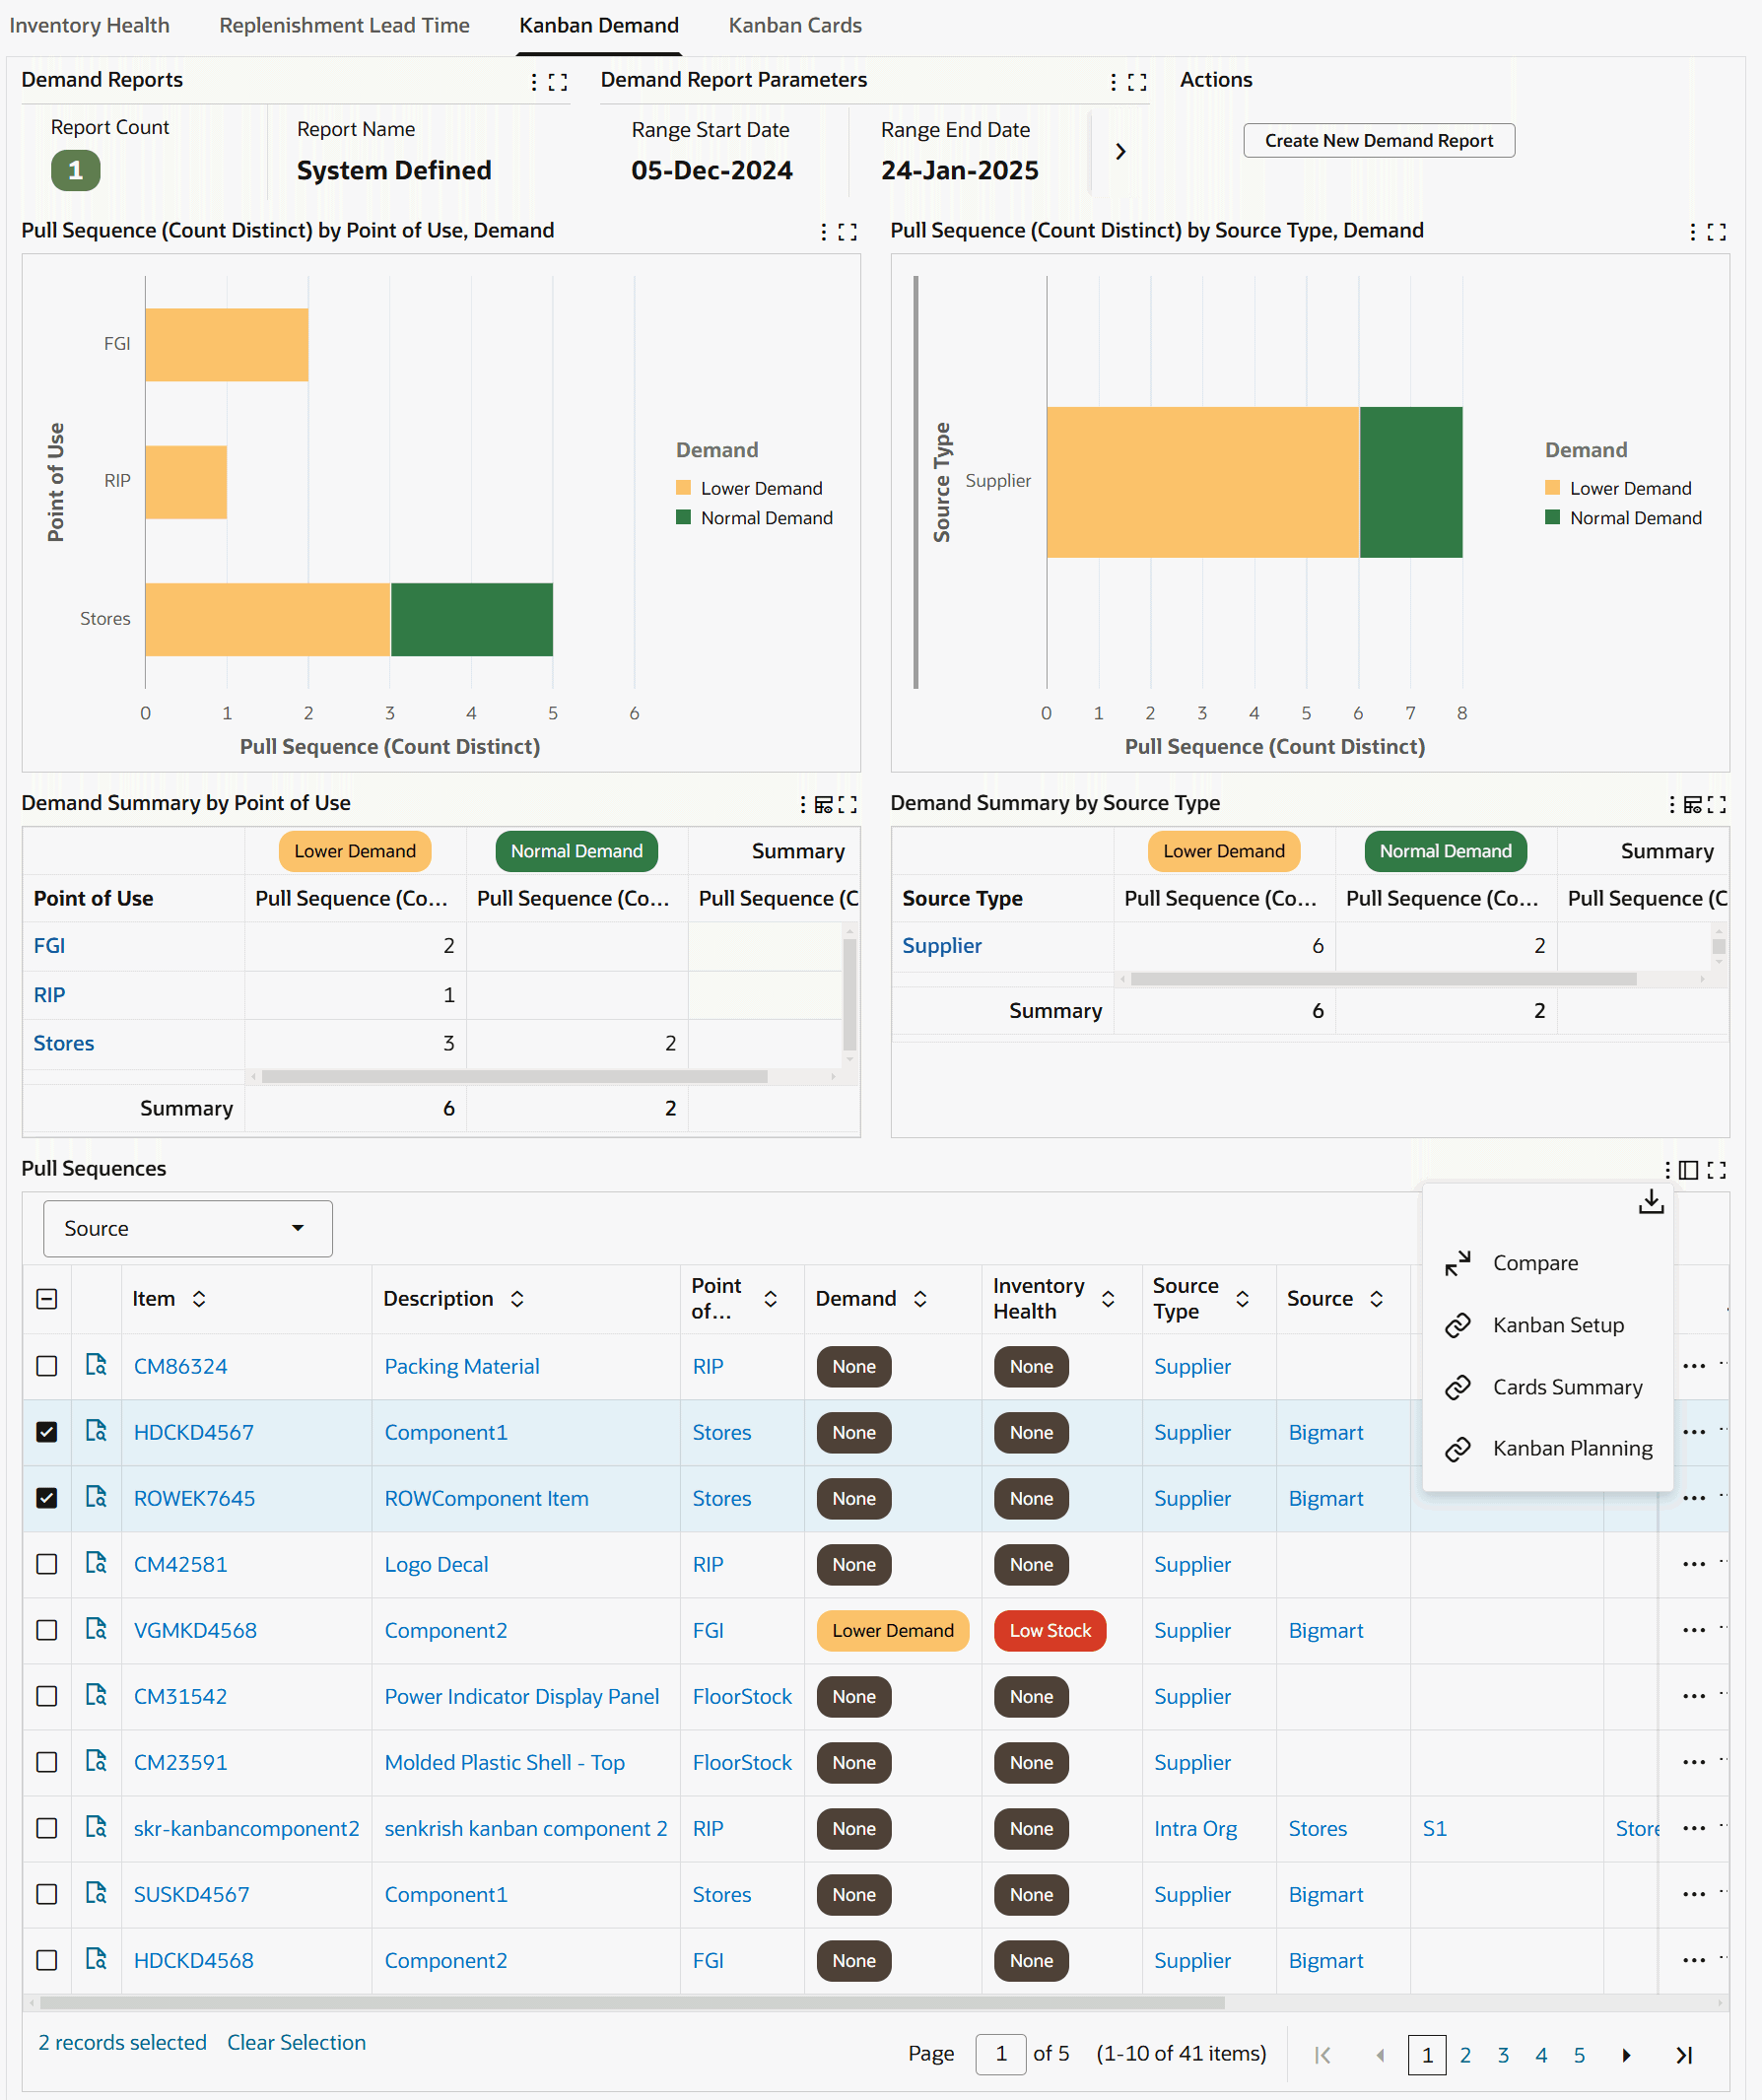
Kanban Demand Tab - Row-Level Actions
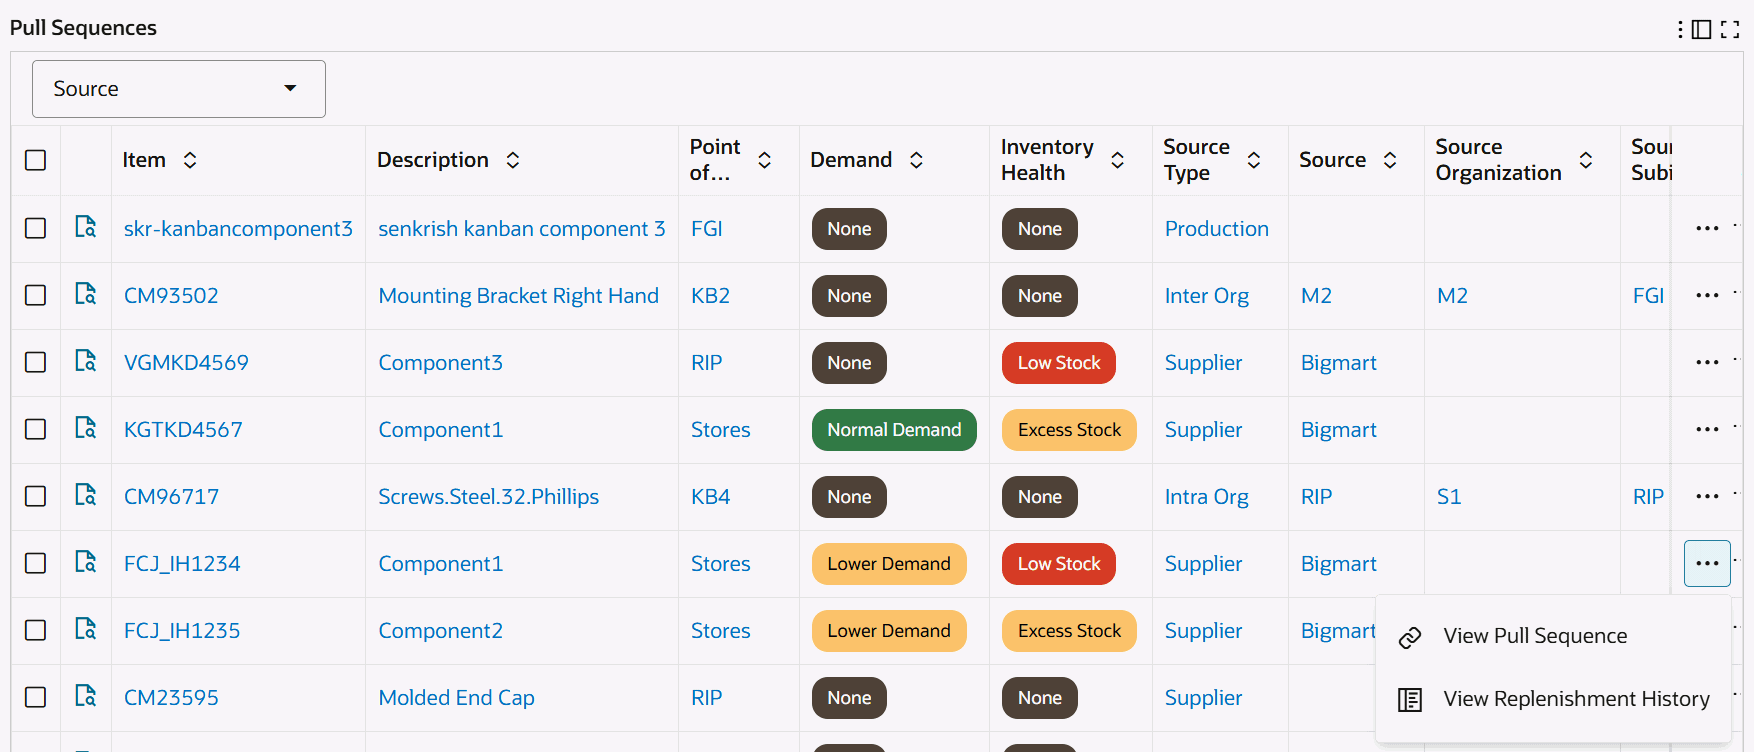
Replenishment History Chart
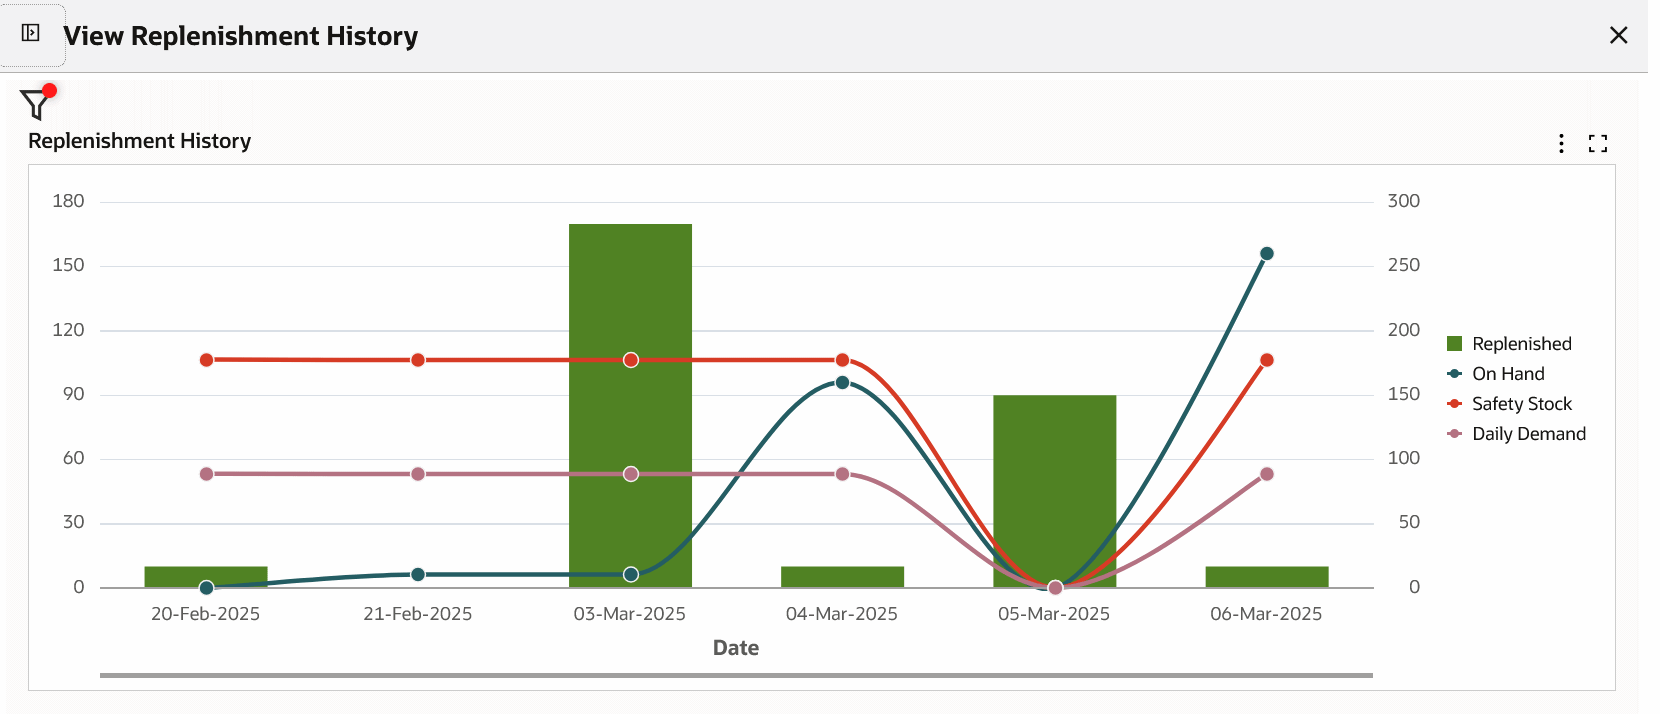
The following table describes the Kanban Demand tab components:
| Component | Description |
| Report Count (link) | Click Report Count to view and select from multiple demand reports. Note that the Kanban Demand tab defaults the System Defined report based on the parameters set on the Configurations tab, Parameters page. You can only create reports. Note: If your system administrator runs the Electronic Kanban ECC Data Load with the Full Load option, then after the completion of the full load, user defined reports are removed, and the dashboard displays only the system defined report. |
| Create New Demand Report (button) | To define a demand report:
|
| Pull Sequence (Count Distinct) by Point of Use, Demand (chart) | This chart displays the number of pull sequences by point of use based on the Demand classification. You can drill down on the pull sequence values. Click the Options icon to select Demand or Point of Use from the Dimension menu. Select Point of Use from the Group Dimensions menu. |
| Pull Sequence (Count Distinct) by Source Type, Demand (chart) | This chart displays the number of pull sequences by source type based on the Demand classification. You can drill down on the pull sequence values. Click the Options icon to select Demand, Source Type, or Source from the Dimension menu. Select Source Type, Source, Supplier, Source Organization, or Source Subinventory from the Group Dimensions menu. |
| Demand Summary by Point of Use (pivot table) | Use this table to analyze demand classification of pull sequences by point of use. |
| Demand Summary by Source Type (pivot table) | Use this table to analyze demand classification of pull sequences by source type. |
| Pull Sequences Results Table (tab layout) | On the Kanban Cards tab's Pull Sequences results table, you can select from the following attribute groups to display details by:
Click the Record Details icon for a selected item to view the Details dialog box. Click the links in the table columns to refine the information available in the Kanban Dashboard. Row-Level Actions You can perform the following row-level actions. Select a row, click the Actions icon, and select from the following:
Table-Level Actions To perform a table-level action, select one or more rows and choose from the following actions available from the Options icon in the Kanban Demand tab's results table:
|
See:
Kanban Cards Tab
The Kanban Cards tab displays cards that have been in a particular supply status for an extended period of time.
Unmoved Cards Metric Calculations
The length of time each supply status a card is considered unmoved is set in the Card Supply Statuses Electronic Kanban parameter. For this parameter, enter the percentage of lead time to show the length of time each supply status a card is considered unmoved. See Configuring Kanban Parameters, Oracle Electronic Kanban User's Guide.
The Unmoved Cards Calculation program calculates the number of cards that are in each supply status for a period of time configured by you. The program:
-
Selects all pull sequences for an organization. For every pull sequence, all Kanban cards are selected.
-
Finds the percentage of lead time for the valid statuses.
-
Gets the planned lead time for the pull sequence.
-
For every card, gets the Last Activity Date, Status, and Creation Date.
Example: Unmoved Cards Calculation
The following example explains the unmoved cards calculation.
In this example, Parameters are set as follows on the Configurations tab, Parameters page. See Configuring Kanban Parameters, Oracle Electronic Kanban User's Guide.
-
Card Supply Statuses
In Process: 10
-
For an item pull sequence
Lead Time: 2 days
Unmoved cards calculation is based on the parameters setup.
Card is Unmoved when lead time in In Process supply status is greater than +10 % of 2 or 0.2 days.
Assume the card supply status is In Process for 1 day. then, this card will be displayed as Unmoved card.
Also, Custom Extension is available to define specific values at the Pull Sequence or Kanban Card level to override the parameters that are set at the Organization level. See Determine Unmoved Kanban Cards Program, Oracle Electronic Kanban User's Guide.
Kanban Cards Tab Components
Kanban Cards Tab – Row-Level Actions
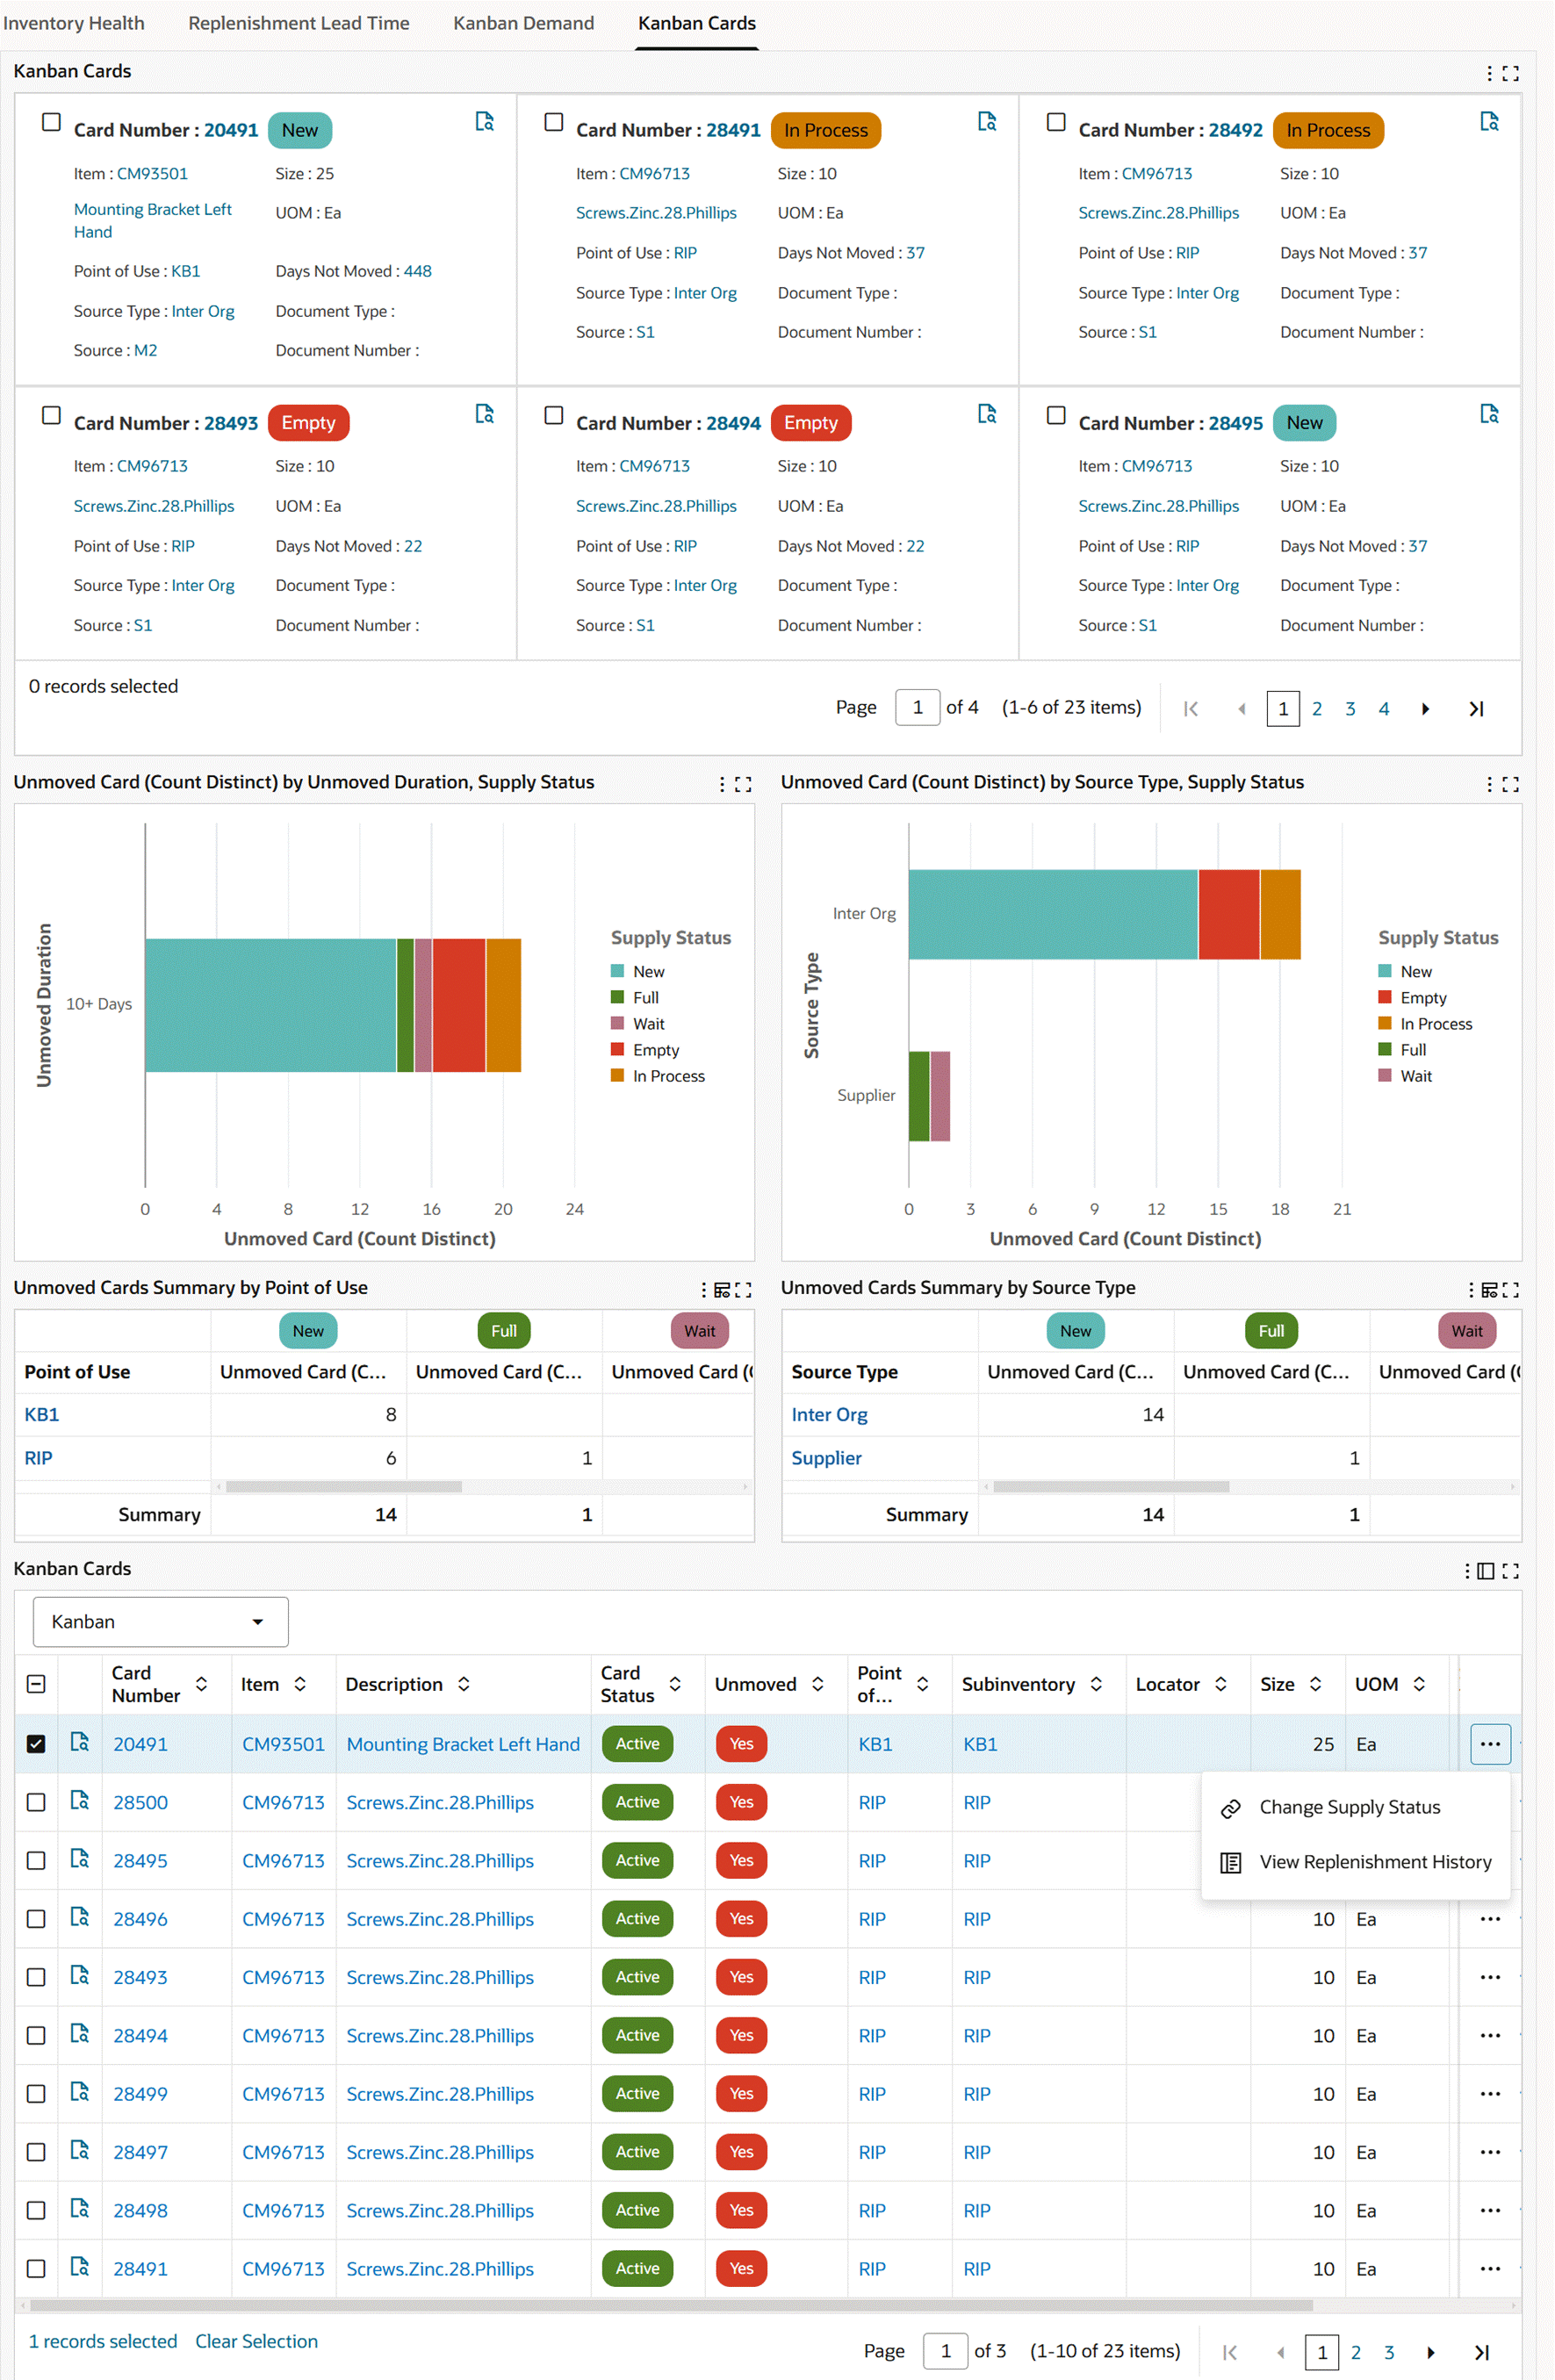
Kanban Cards Tab - View Replenishment History
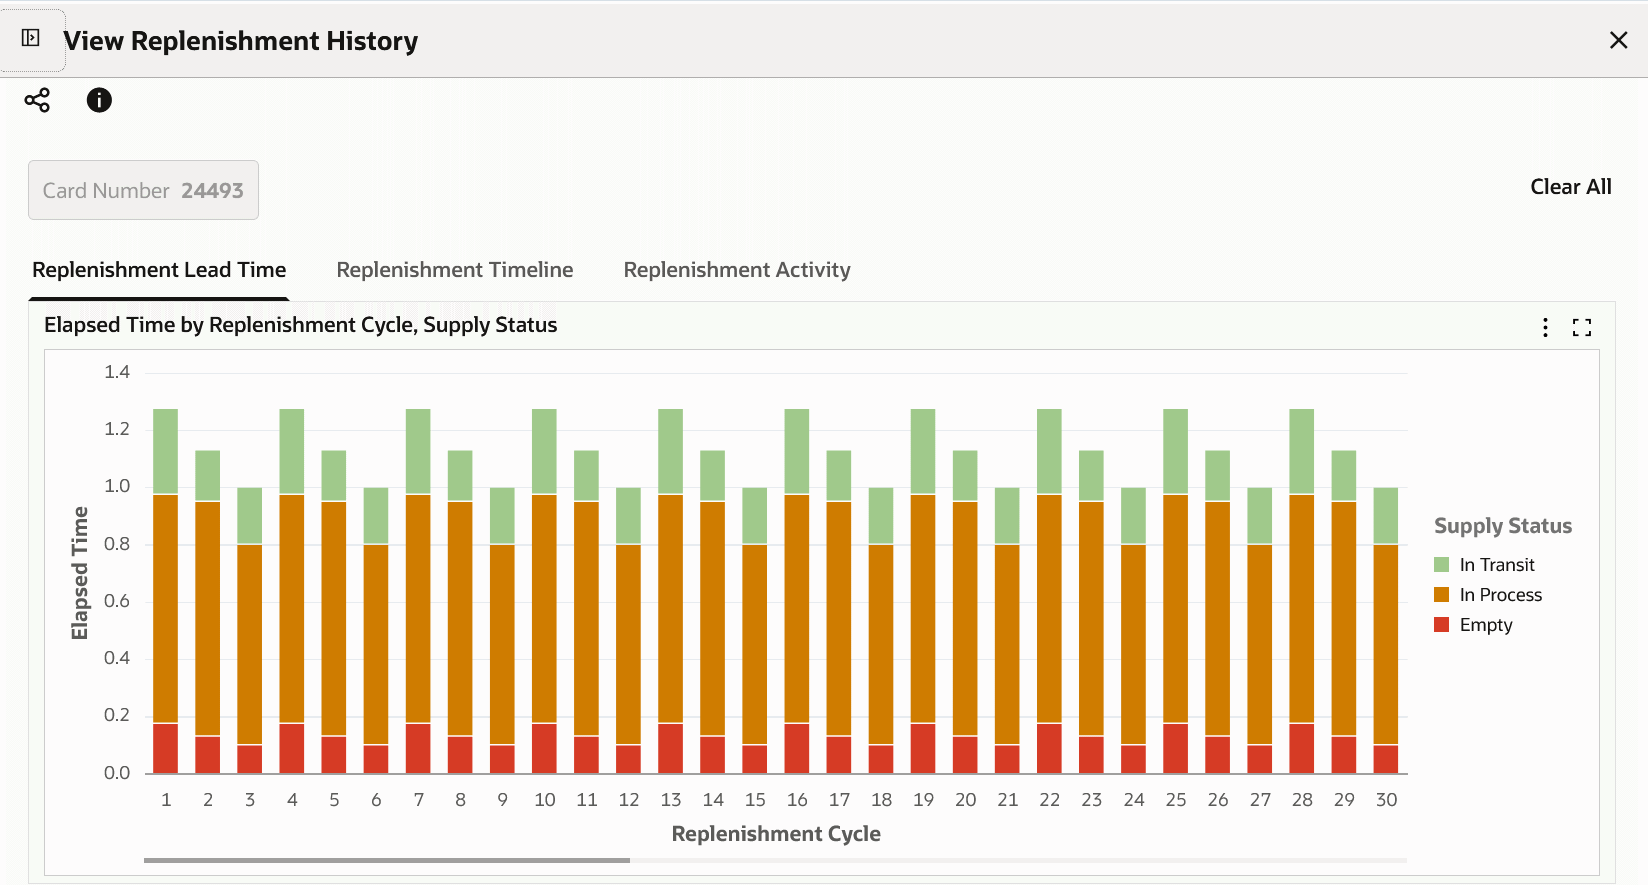
Kanban Cards Tab – Table-Level Actions
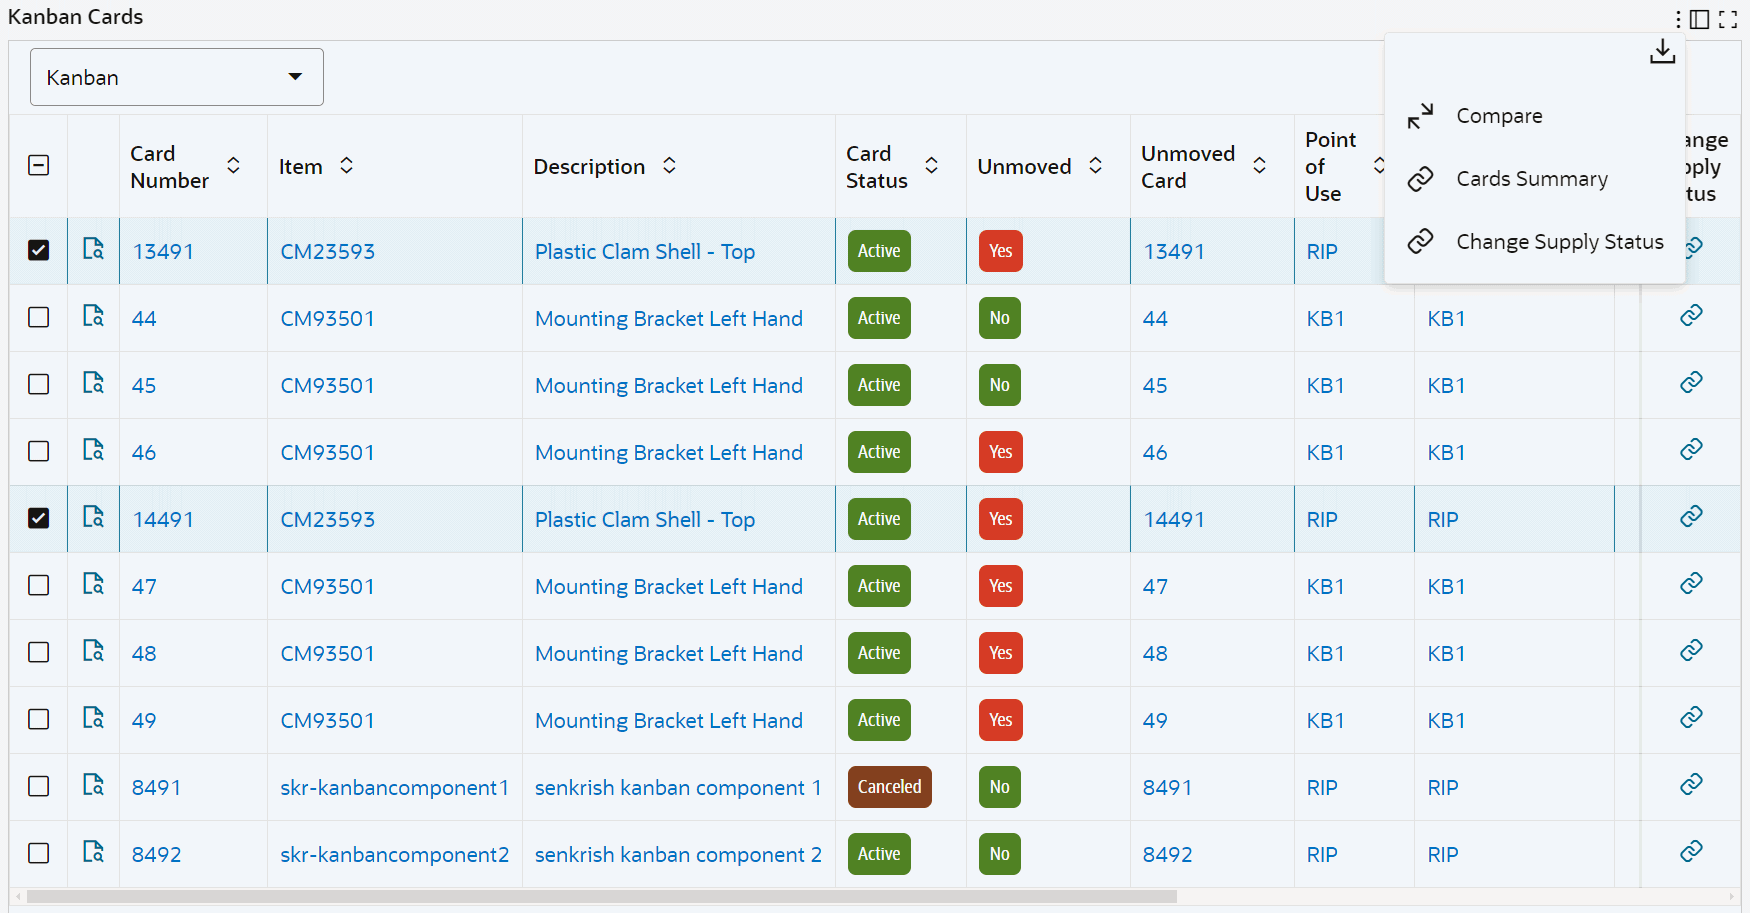
The following table describes the Kanban Cards tab components:
| Component | Description |
| Kanban Cards (tile) | Use the Kanban Cards tile to:
|
| Unmoved Card (Count Distinct) by Unmoved Duration, Supply Status (chart) | This chart shows the number of unmoved Kanban cards in each supply status and unmoved duration. The chart uses the following predefined unmoved duration days:
Click the Options icon to select Supply Status, Source Type, or Source from the Dimension menu. Select Unmoved Duration from the Group Dimensions menu. |
| Unmoved Card (Count Distinct) by Source Type, Supply Status (chart) | This chart shows the number of unmoved Kanban cards by source type and supply status. Click the Options icon to select Supply Status or Source from the Dimension menu. Select Source Type, Source, or Point of Use from the Group Dimensions menu. |
| Unmoved Cards Summary by Point of Use (pivot table) | Use this table to analyze unmoved cards by point of use. |
| Unmoved Cards Summary by Source Type (pivot table) | Use this table to analyze unmoved cards by source type. |
| Kanban Cards Results Table (tab layout) | On the Kanban Cards results table, you can select from the following attribute groups to display details by:
Click the Record Details icon for a selected item to view the Details dialog box. Click the links in the table columns to refine the information available in the Kanban Dashboard. Row-Level Actions You can perform the following row-level actions. Select a row, click the Actions icon, and select from the following:
Table-Level Actions To perform the following table-level actions, select one or more rows and click the Options icon in the results table:
|
See:
Movement Statistics Dashboard
See Inventory Management Command Center Overview.
The Movement Statistics dashboard provides visibility into extensive and wide-ranging statistical data associated with your trade movement. Use different combinations of key trade attributes to review movement statistics data, and analyze transactions across legal entities.
Use the dashboard to:
-
Review the status of movement records by all transactions and specific transaction types.
-
Find the number of movement records that are open, verified, or have an exception.
-
-
Analyze trade volumes and trend.
-
Analyze trade volume across legal entities by source types using the time dimension.
-
Perform detailed analysis of trade volumes and trends using different dimensions such as vendors and customers.
-
Review transactions using attributes such as item description, commodity description, dispatch country, and destination country.
-
-
Get insight into the trade direction.
-
Focus on trade statistics in a specific quarter for a specific country, and for a particular transaction type.
-
Review trade trends and find the items that contribute to the spike or fall in trade volumes.
-
Review trade concentration in geographical locations.
-
Review source and destination of goods.
-
-
Perform returns analysis.
-
Focus on records with exception errors to resolve and clear reporting bottlenecks.
-
Use the movement statistics data to streamline your supply chain process.
Access the Movement Statistics dashboard using the following navigation:
(N) Inventory (responsibility) > Transactions > Movement Statistics Dashboards
Important: The dashboard displays movement statistics data based on a legal entity (which is a business division). Your access to movement records of a legal entity depends on the MO: Security Profile option value set by your system administrator.
Movement Statistics Dashboard
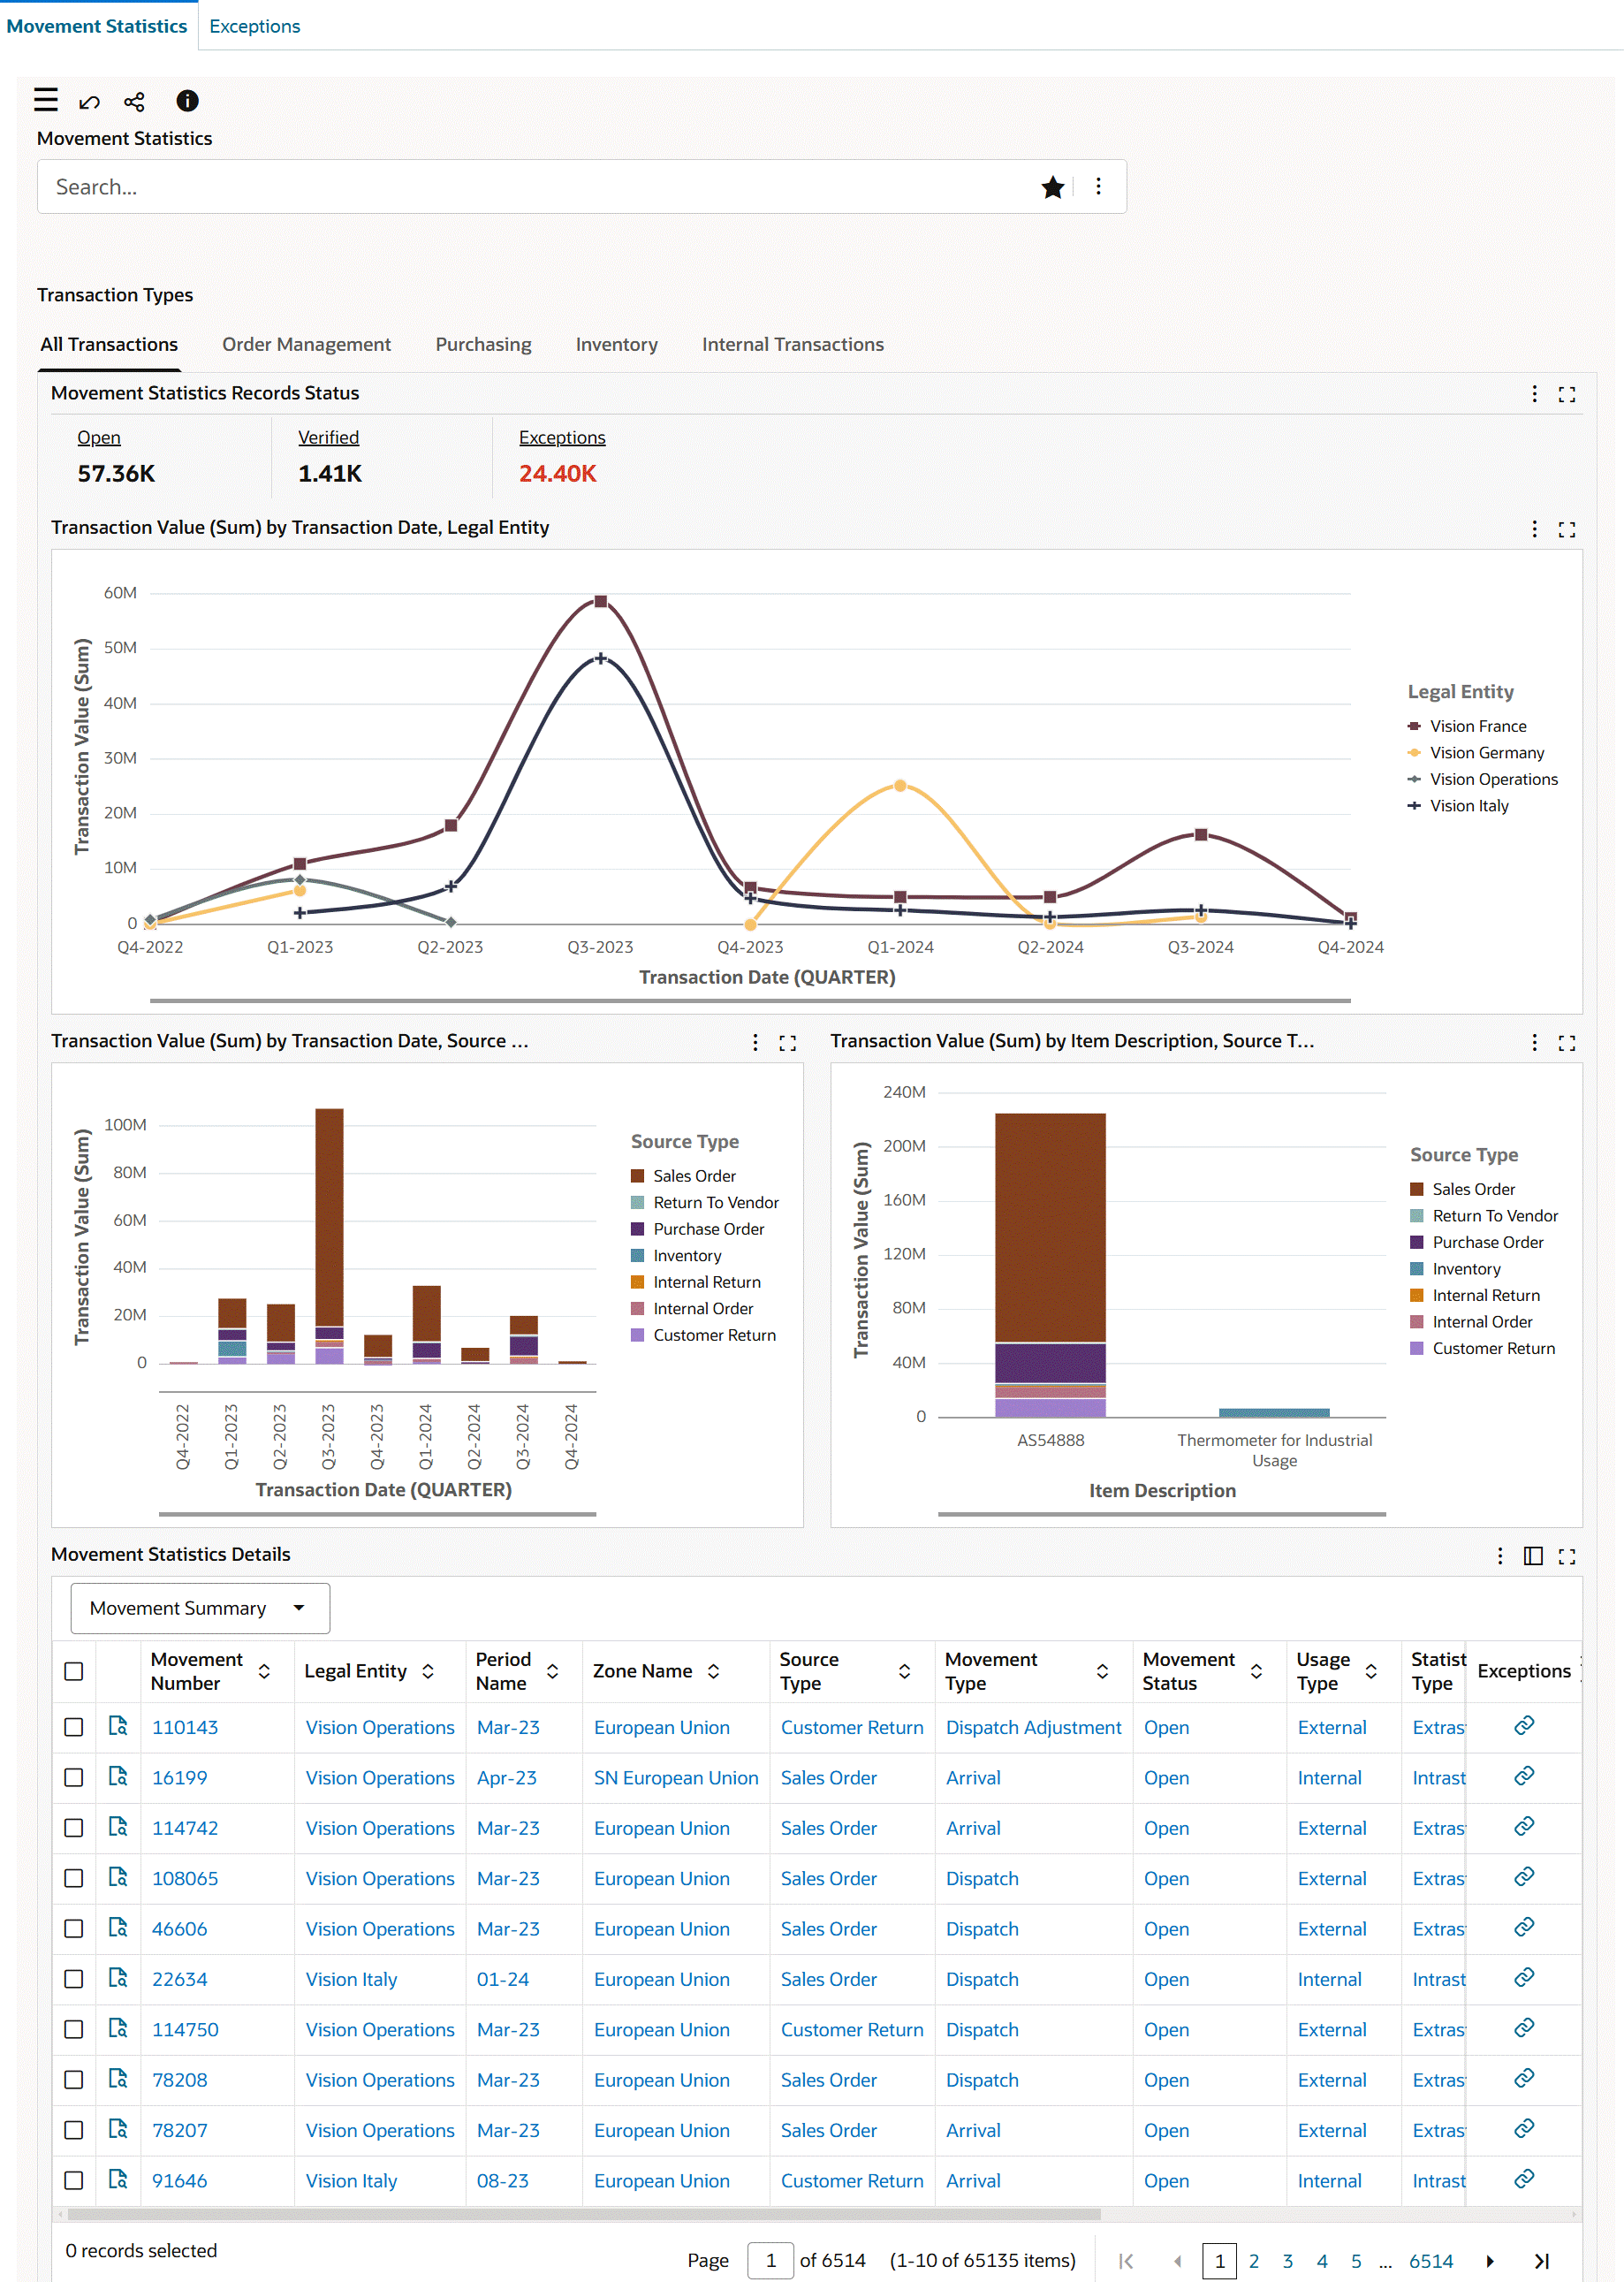
The following table describes the Movement Statistics dashboard components:
| Components | Description |
|---|---|
| Transaction Types (tabbed component) | The Transaction Types tabbed component includes the following tabs:
Each tab presents the following components:
|
| Movement Statistics Records Status (summary bar) | The Movement Statistics Records Status summary bar is available in the All Transactions, Order Management, Purchasing, Inventory, and Internal Transactions tabs with the following key metrics. To refine the data, click a metric value.
|
| All Transactions (tab) | The All Transactions tab provides metrics and charts to review movement statistics data for Order Management, Purchasing, Inventory, and Internal Transactions. For details, see All Transactions Tab. |
| Order Management (tab) | The Order Management tab provides metrics and charts to review movement statistics data for Oracle Order Management transactions. For details, see Order Management Tab. |
| Purchasing (tab) | The Purchasing tab provides metrics and charts to review movement statistics data for Oracle Purchasing transactions. For details, see Purchasing Tab. |
| Inventory (tab) | The Inventory tab provides metrics and charts to review movement statistics data for Oracle Inventory transactions. For details, see Inventory Tab. |
| Internal Transactions (tab) | The Internal Transactions tab provides metrics and charts to review movement statistics data for inter-org transactions. For details, see Internal Transactions Tab. |
| Movement Statistics Details (results table) | Use this table to review the movement statistics details for movement records. For details, see Movement Statistics Details Results Table. |
All Transactions Tab
The All Transactions tab shows metrics and charts for the following source types:
-
Sales Order
-
Customer Return
-
Purchase Order
-
Return To Vendor
-
Inventory
-
Inventory Return
-
Internal Order
-
Internal Return
The following table describes the All Transactions tab components:
| Components | Description |
|---|---|
| Movement Statistics Records Status (summary bar) | For details about the metrics, see Movement Statistics Records Status. |
| Transaction Value (Sum) by Transaction Date, Legal Entity (chart) | This chart displays divisional trade statistics. By default, the chart shows the transaction value of trade across quarters for legal entities. Select Invoice from the Group Dimension menu. The metrics are Transaction Value (Sum) and Statistical Value (Sum). By default, the time grain is set to quarterly, and you can change the time grain to daily, weekly, monthly, or yearly. |
| Transaction Value (Sum) by Transaction Date, Source Type (chart) | By default, this chart shows the transaction value for source types across quarters by transaction date. Select a different group dimension to view the transaction value for source types by invoice date. The Dimension menu includes Statistical Type, Movement Type, Item Description, Commodity Description, Dispatch Country, and Destination Country. The metrics are Transaction Value (Sum) and Statistical Value (Sum). |
| Transaction Value (Sum) by Item Description, Source Type (chart) | By default, this chart shows the transaction value of trade by item in each source type across quarters. The Group Dimension menu includes Item Description, Commodity Description, Source Type, Statistical Type, Movement Type, Destination Country, and Dispatch Country. The Dimension menu includes Statistical Type, Movement Type, Item Description, Commodity Description, Dispatch Country, and Destination Country. The metrics are Transaction Value (Sum) and Statistical Value (Sum). |
See Movement Statistics Dashboard.
Order Management Tab
The Order Management tab shows metrics and charts for the following source types:
-
Sales Order
-
Customer Return
Order Management Tab
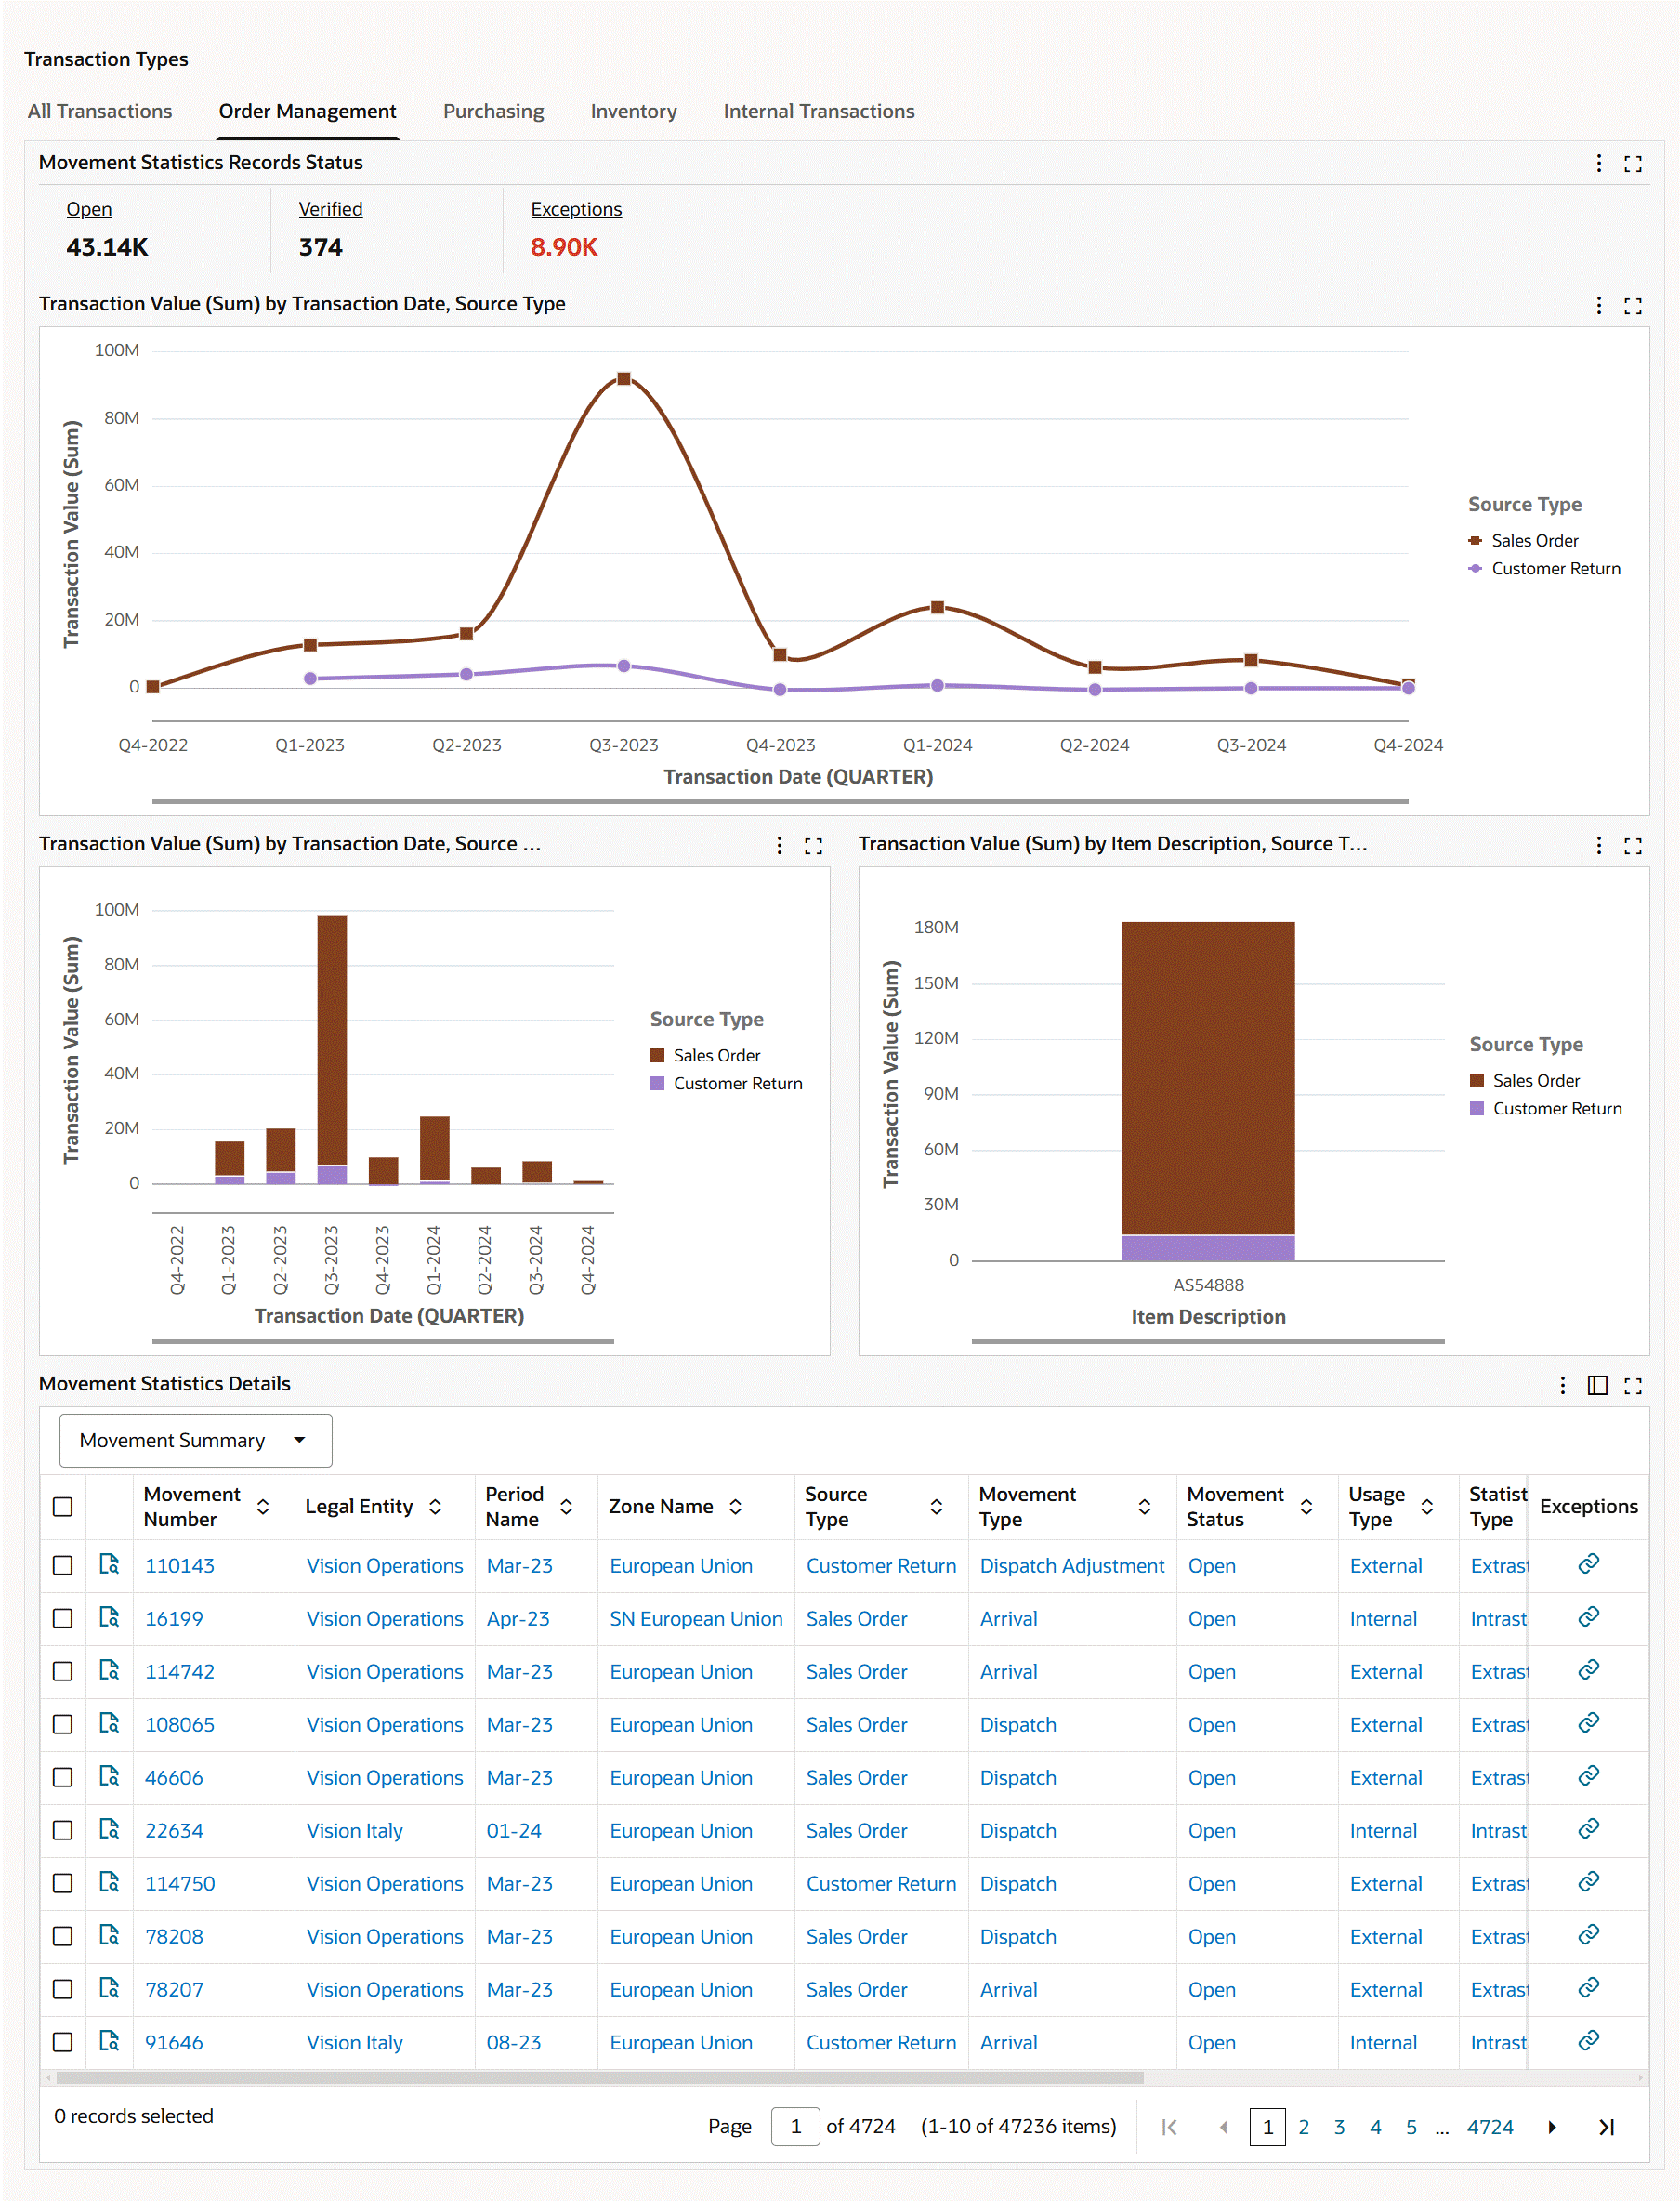
The following table describes the Order Management tab components:
| Components | Description |
|---|---|
| Movement Statistics Records Status (summary bar) | For details about the metrics, see Movement Statistics Records Status. |
| Transaction Value (Sum) by Transaction Date, Legal Entity (chart) | This chart displays divisional trade statistics. By default, the chart shows the transaction value of trade across quarters for legal entities. The Dimension menu includes Legal Entity and Source Type. The metrics are Transaction Value (Sum) and Statistical Value (Sum). By default, the time grain is set to quarterly, and you can change the time grain to daily, weekly, monthly, or yearly. |
| Transaction Value (Sum) by Transaction Date, Source Type (chart) | By default, this chart shows the transaction value for source types across quarters by transaction date. Select a different group dimension to view the transaction value for source types by invoice date. The Dimension menu includes Source Type, Statistical Type, Movement Type, Item Description, Commodity Description, Customer Name, and Customer Location. The metrics are Transaction Value (Sum) and Statistical Value (Sum). |
| Transaction Value (Sum) by Item Description, Source Type (chart) | By default, this chart shows the transaction value of trade by item in each source type across quarters. The Group Dimension menu includes Item Description, Commodity Description, Source Type, Statistical Type, Movement Type, Destination Country, Dispatch Country, Customer Name, and Customer Location. The Dimension menu includes Statistical Type, Movement Type, Item Description, Commodity Description, Dispatch Country, and Destination Country. The metrics are Transaction Value (Sum) and Statistical Value (Sum). |
See Movement Statistics Dashboard.
Purchasing Tab
The Purchasing tab shows metrics and charts for the following source types:
-
Purchase Order
-
Return To Vendor
Purchasing Tab
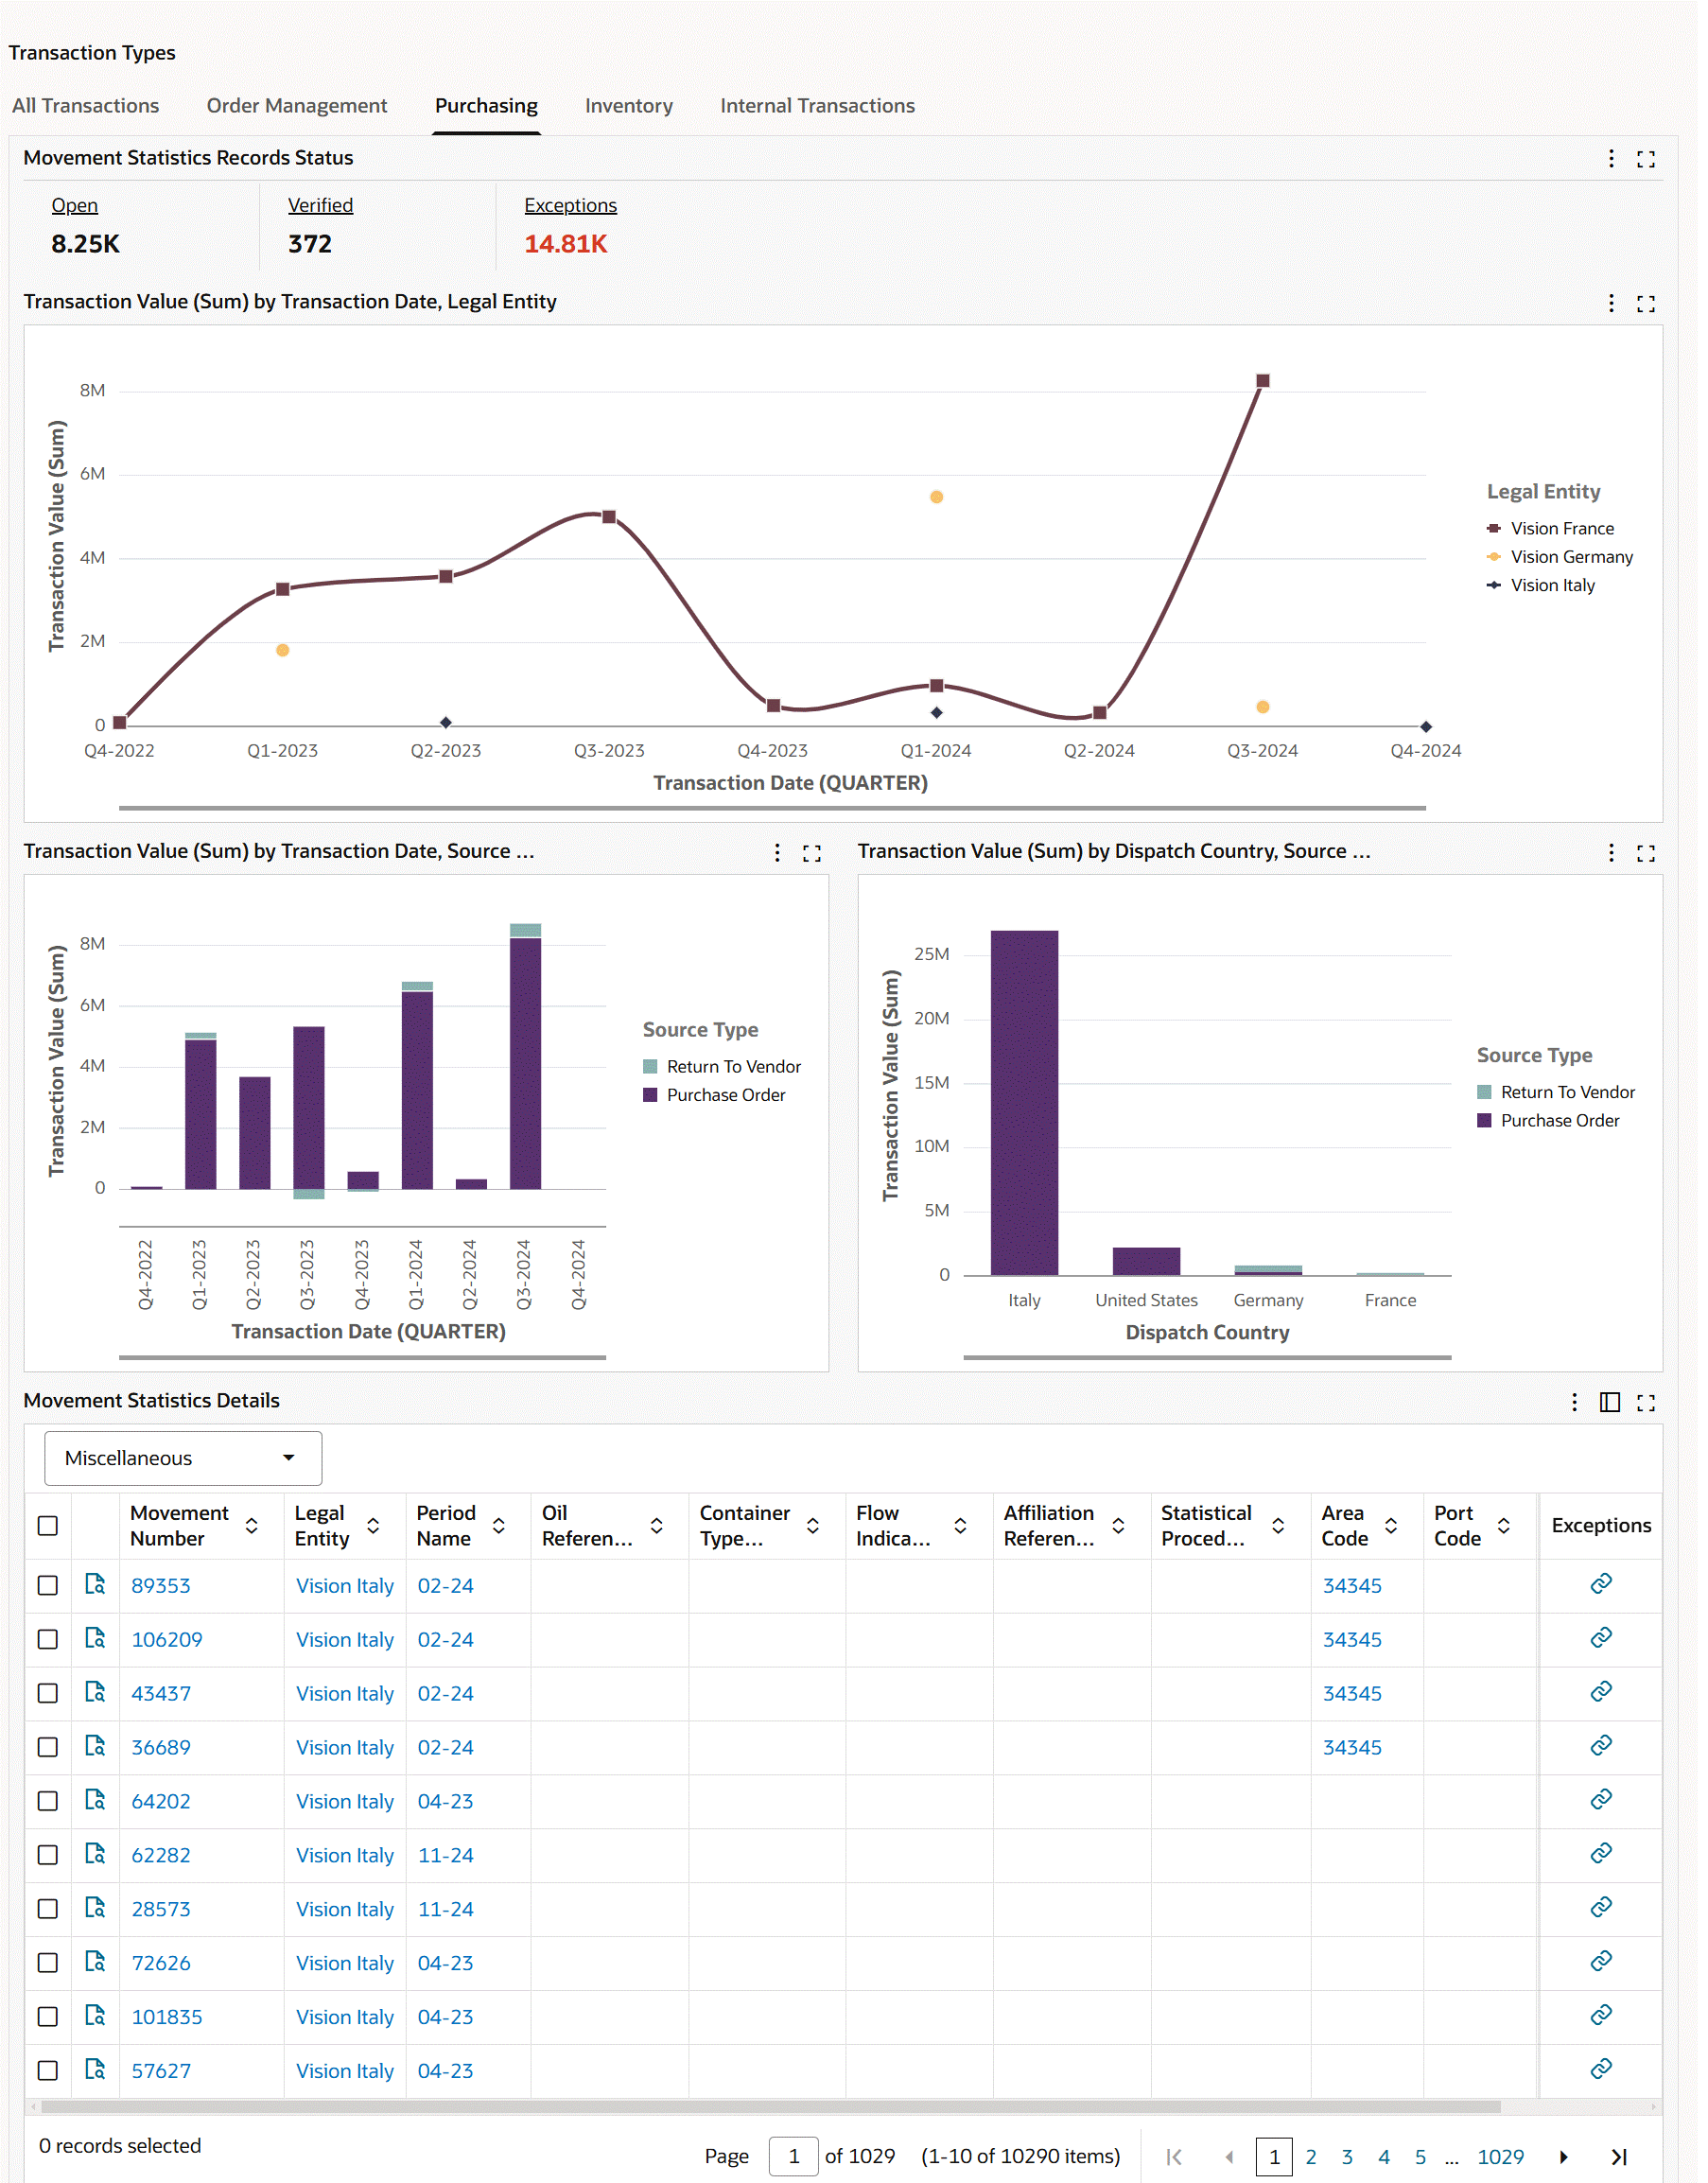
The following table describes the Purchasing tab components:
| Components | Description |
|---|---|
| Movement Statistics Records Status (summary bar) | For details about the metrics, see Movement Statistics Records Status. |
| Transaction Value (Sum) by Transaction Date, Legal Entity (chart) | This chart displays divisional trade statistics. By default, the chart shows the transaction value of trade across quarters for legal entities. The Dimension menu includes Legal Entity and Source Type. The metrics are Transaction Value (Sum) and Statistical Value (Sum). By default, the time grain is set to quarterly, and you can change the time grain to daily, weekly, monthly, or yearly. |
| Transaction Value (Sum) by Transaction Date, Source Type (chart) | By default, this chart shows the transaction value for source types across quarters by transaction date. Select a different group dimension to view the transaction value for source types by invoice date. The Dimension menu includes Source Type, Statistical Type, Movement Type, Item Description, Commodity Description, Destination Country, Dispatch Country, and Vendor Name. The metrics are Transaction Value (Sum) and Statistical Value (Sum). |
| Transaction Value (Sum) by Item Description, Source Type (chart) | By default, this chart shows the transaction value of trade by item in each source type across quarters. The Group Dimension menu includes Item Description, Commodity Description, Source Type, Statistical Type, Movement Type, Destination Country, Dispatch Country, and Vendor Name. The Dimension menu includes Source Type, Statistical Type, Movement Type, Item Description, Commodity Description, Dispatch Country, and Vendor Name. The metrics are Transaction Value (Sum) and Statistical Value (Sum). |
See Movement Statistics Dashboard.
Inventory Tab
The Inventory tab shows metrics and charts for the following source types:
-
Inventory
-
Inventory Return
Inventory Tab
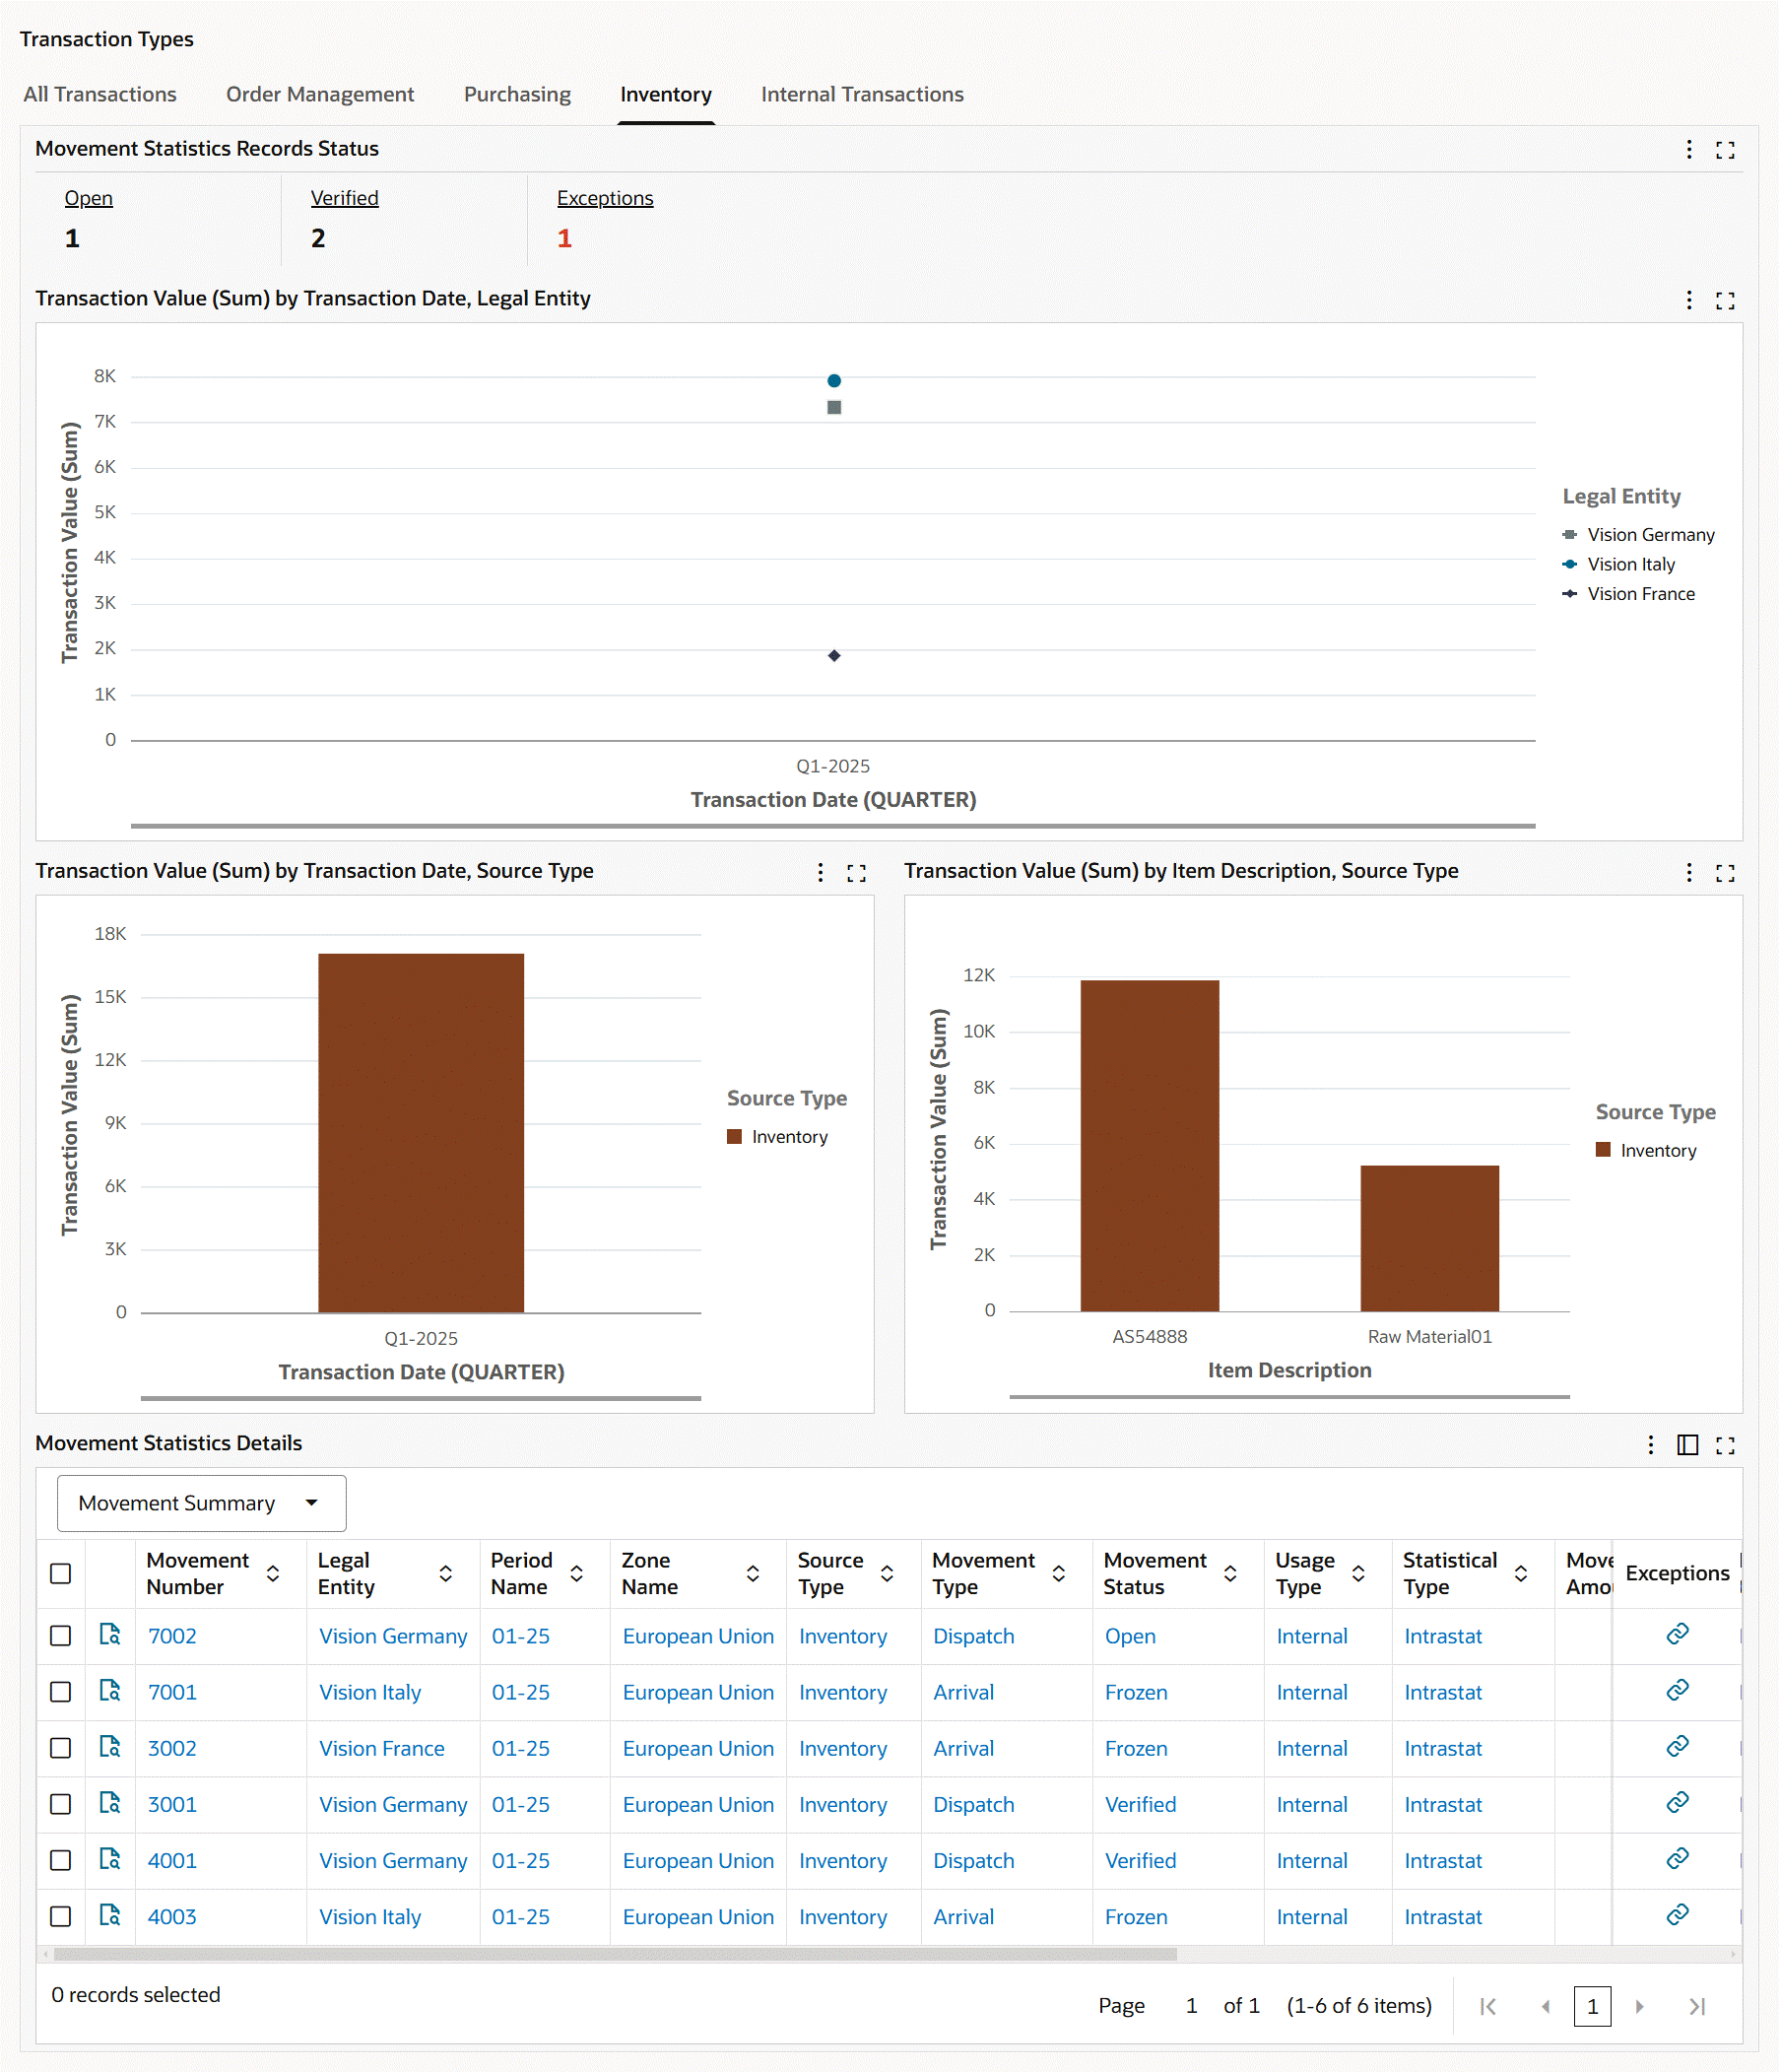
The following table describes the Inventory tab components:
| Components | Description |
|---|---|
| Movement Statistics Records Status (summary bar) | For details about the metrics, see Movement Statistics Records Status. |
| Transaction Value (Sum) by Transaction Date, Legal Entity (chart) | This chart displays divisional trade statistics. By default, the chart shows the transaction value of trade across quarters for legal entities. The Dimension menu includes Legal Entity and Source Type. The metrics are Transaction Value (Sum) and Statistical Value (Sum). By default, the time grain is set to quarterly, and you can change the time grain to daily, weekly, monthly, or yearly. |
| Transaction Value (Sum) by Transaction Date, Source Type (chart) | By default, this chart shows the transaction value for source types across quarters by transaction date. Select a different group dimension to view the transaction value for source types by invoice date. The Dimension menu includes Source Type, Statistical Type, Movement Type, Item Description, Commodity Description, Destination Country, Dispatch Country, From Organization, and To Organization. The metrics are Transaction Value (Sum) and Statistical Value (Sum). |
| Transaction Value (Sum) by Item Description, Source Type (chart) | By default, this chart shows the transaction value of trade by item in each source type across quarters. The Group Dimension menu includes Item Description, Commodity Description, Source Type, Statistical Type, Movement Type, Destination Country, Dispatch Country, From Organization, and To Organization. The Dimension menu includes Source Type, Statistical Type, Movement Type, Item Description, Commodity Description, Destination Country, Dispatch Country, From Organization, and To Organization. The metrics are Transaction Value (Sum) and Statistical Value (Sum). |
See Movement Statistics Dashboard.
Internal Transactions Tab
The Internal Transactions tab shows metrics and charts for the following source types:
-
Internal Order
-
Internal Return
Internal Transactions Tab
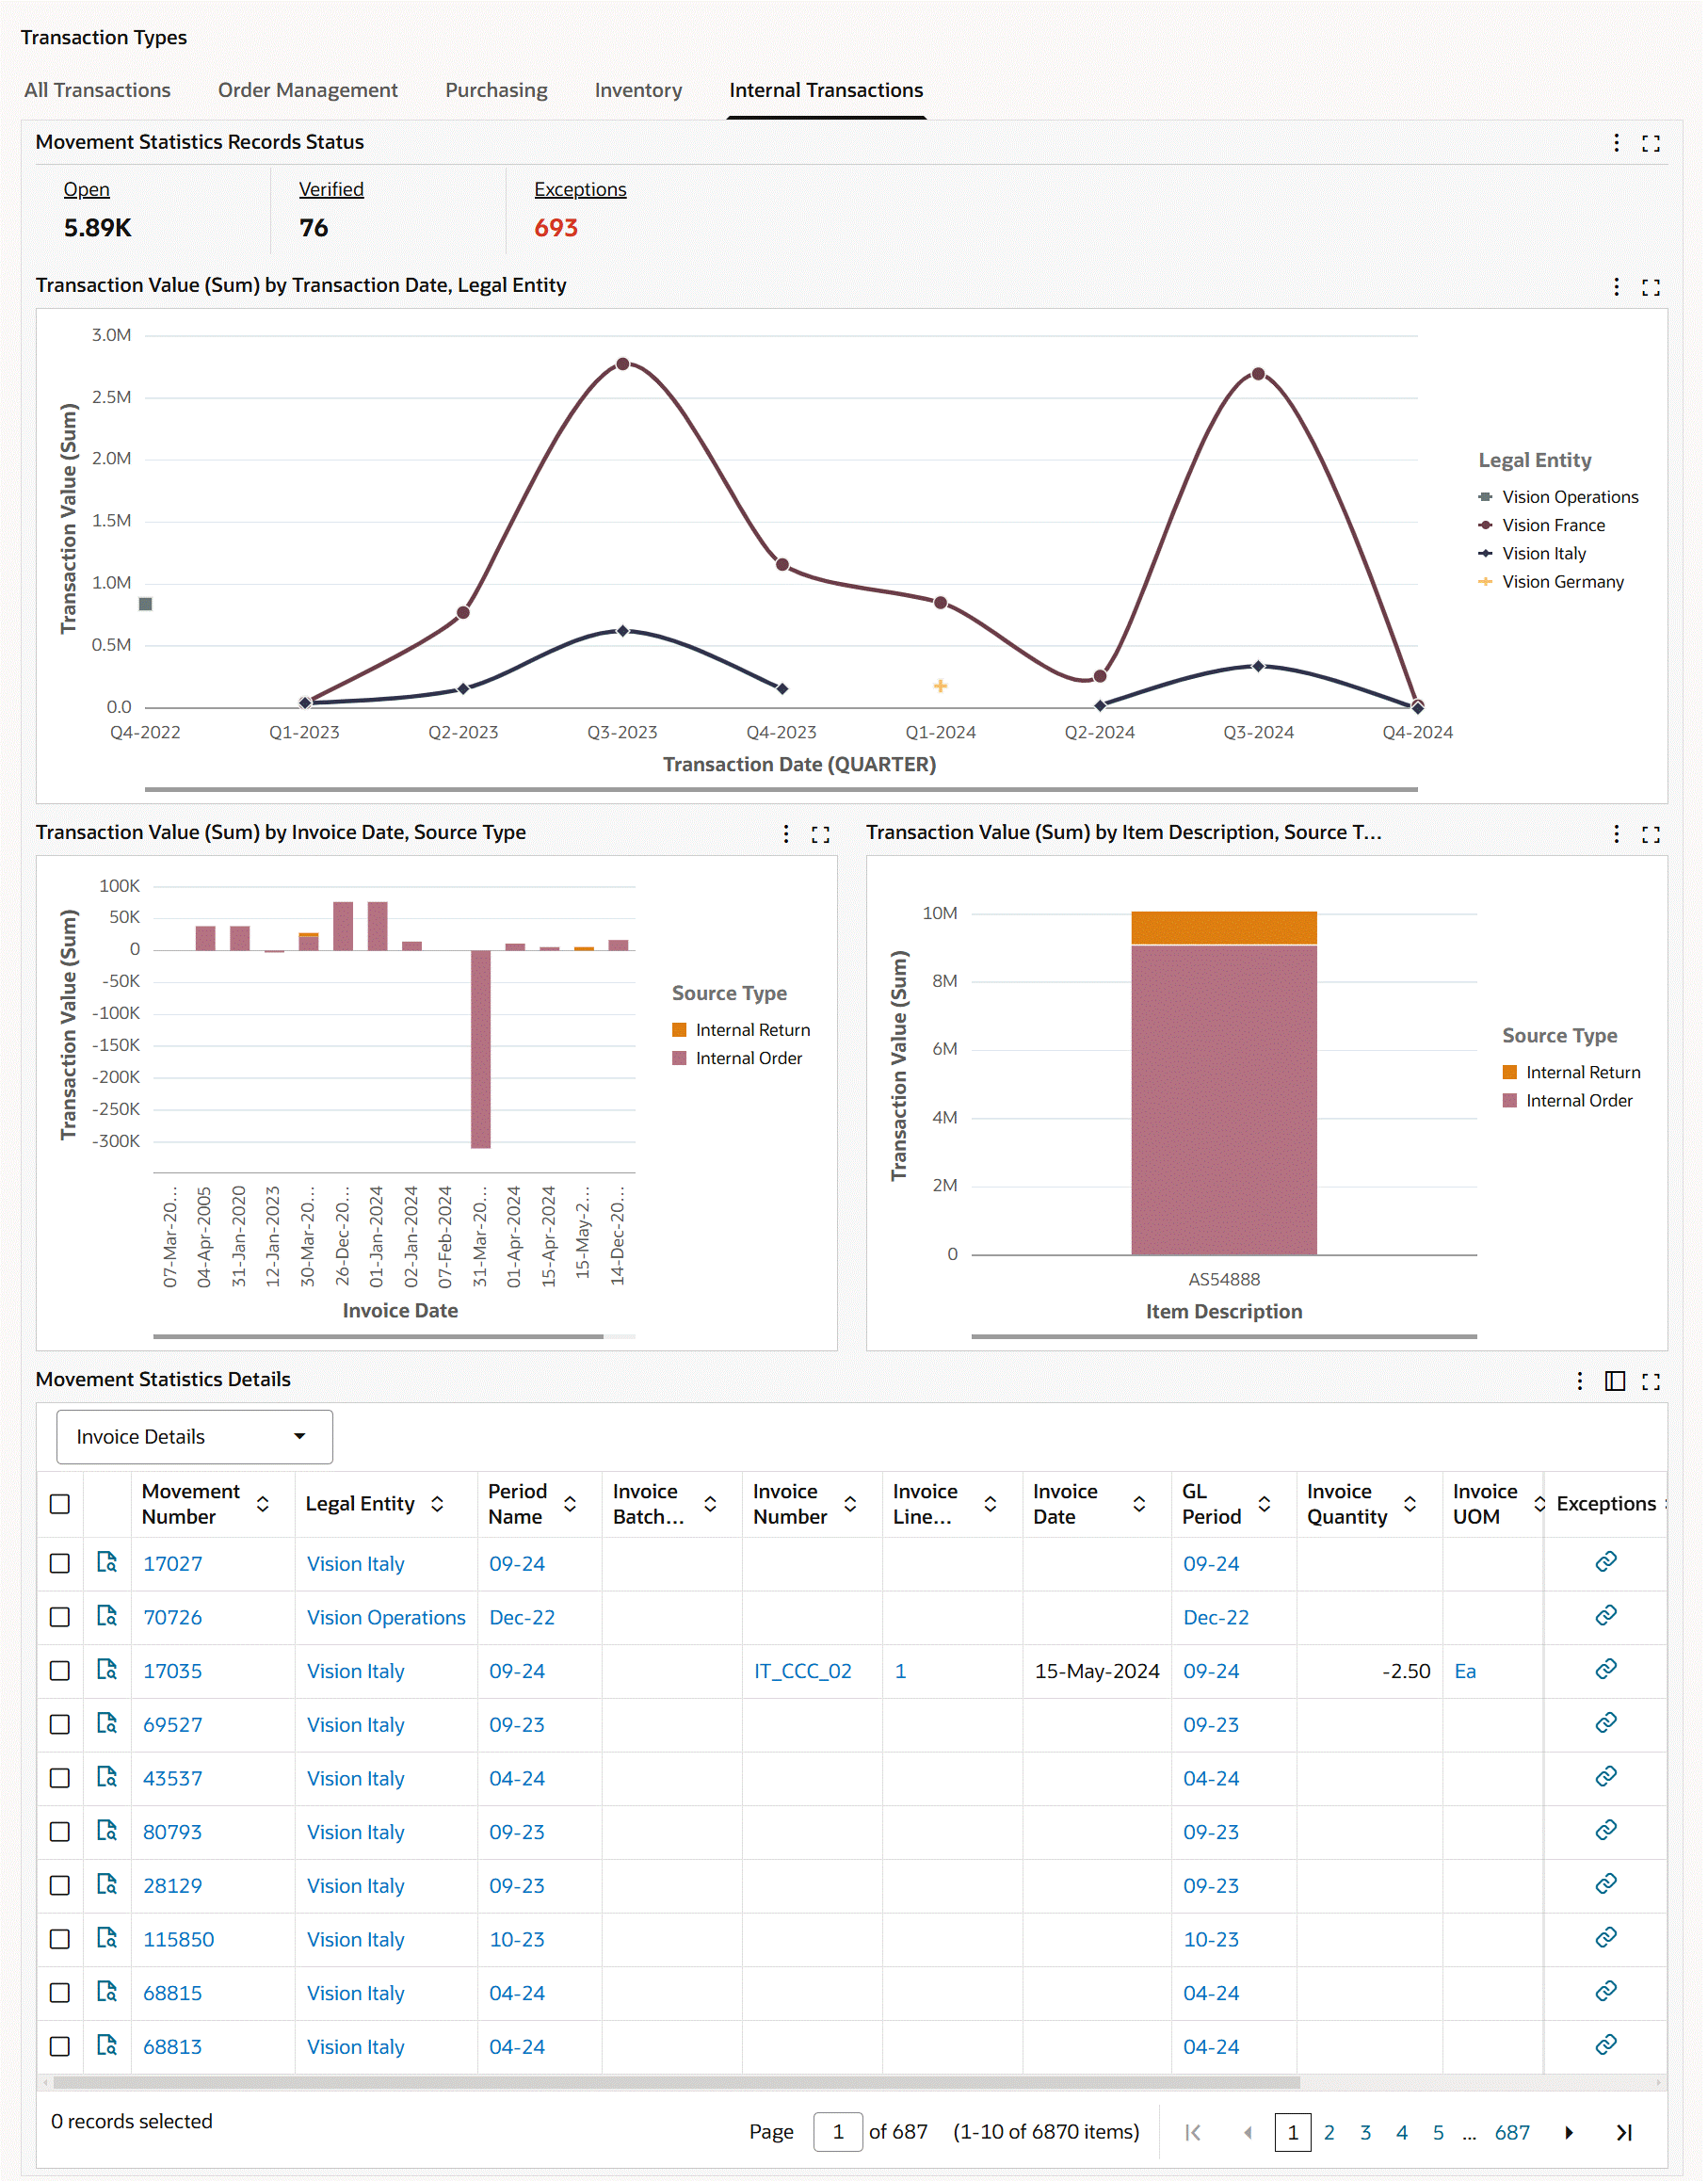
The following table describes the Internal Transactions tab components:
| Components | Description |
|---|---|
| Movement Statistics Records Status (summary bar) | For details about the metrics, see Movement Statistics Records Status. |
| Transaction Value (Sum) by Transaction Date, Legal Entity (chart) | This chart displays divisional trade statistics. By default, the chart shows the transaction value of trade across quarters for legal entities. The Dimension menu includes Legal Entity and Source Type. The metrics are Transaction Value (Sum) and Statistical Value (Sum). By default, the time grain is set to quarterly, and you can change the time grain to daily, weekly, monthly, or yearly. |
| Transaction Value (Sum) by Transaction Date, Source Type (chart) | By default, this chart shows the transaction value for source types across quarters by transaction date. Select a different group dimension to view the transaction value for source types by invoice date. The Dimension menu includes Source Type, Statistical Type, Movement Type, Item Description, Commodity Description, Destination Country, Dispatch Country, From Organization, To Organization, Customer Name, and Customer Location. The metrics are Transaction Value (Sum) and Statistical Value (Sum). |
| Transaction Value (Sum) by Item Description, Source Type (chart) | By default, this chart shows the transaction value of trade by item in each source type across quarters. The Group Dimension menu includes Item Description, Commodity Description, Source Type, Statistical Type, Movement Type, Destination Country, Dispatch Country, From Organization, To Organization, Customer Name, and Customer Location. The Dimension menu includes Source Type, Statistical Type, Movement Type, Item Description, Commodity Description, Destination Country, Dispatch Country, From Organization, To Organization, Customer Name, and Customer Location. The metrics are Transaction Value (Sum) and Statistical Value (Sum). |
See Movement Statistics Dashboard.
Movement Statistics Details Results Table
The Movement Statistics Details table shows information for movement records based on the selection of an attribute group. For all the attribute groups, the common columns are Movement Number, Legal Entity, and Period Name.
Movement Statistics Details Table
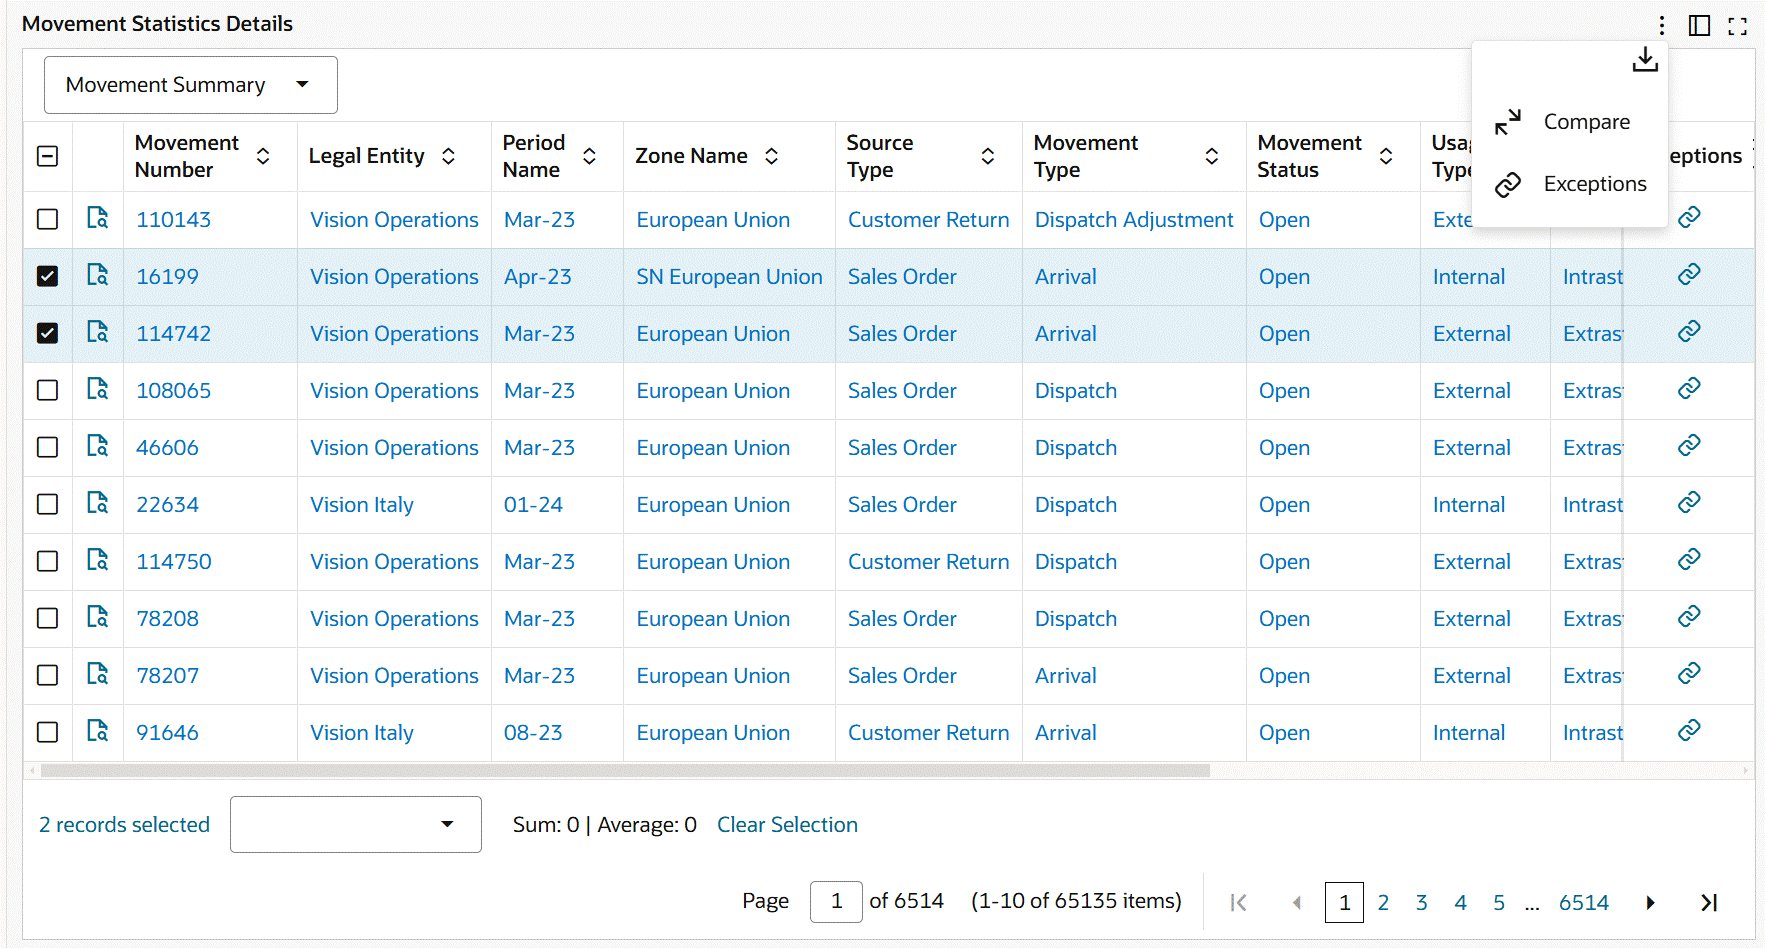
Note: The movement statistics information that you view in these attributes is defined in Oracle Inventory, Movement Statistics Summary window. See: Viewing and Maintaining Movement Statistics.
You can select from the following attribute groups to display details by:
-
Movement Summary
-
Movement Details
-
Country Details
-
Source Details: The source details that you view depend on the Source Type.
-
Invoice Details: This attribute group is not available for the Inventory source type.
-
Additional Details
-
Miscellaneous
Performing Row-Level and Table Level Actions
The following row-level and table-level actions are available:
-
Compare (table-level action): Select multiple rows to compare information.
-
Export (table-level action): Click the Export icon to export the selected search results in a comma-separated values (CSV) file format.
-
Exceptions: In the results table, the Exceptions action link is available at the row-level and table-level for movement records. When you click the link, the Exceptions dashboard opens with the record or records in context. You can review the exception details such as the exception and exception message. See Exceptions Dashboard.
See Movement Statistics Dashboard.
Exceptions Dashboard
See Inventory Management Command Center Overview.
The Exceptions dashboard is an operational dashboard that provides exception resolution process for movement records.
Use the dashboard to:
-
Review errors and warnings by period, source type, and exception type.
-
Manage trade movement exceptions.
-
Review errors.
-
Resolve an exception error or multiple exception errors at a time.
-
Access the Exceptions dashboard using the following navigation:
(N) Inventory (responsibility) > Transactions > Movement Statistics Dashboards
Exceptions Dashboard
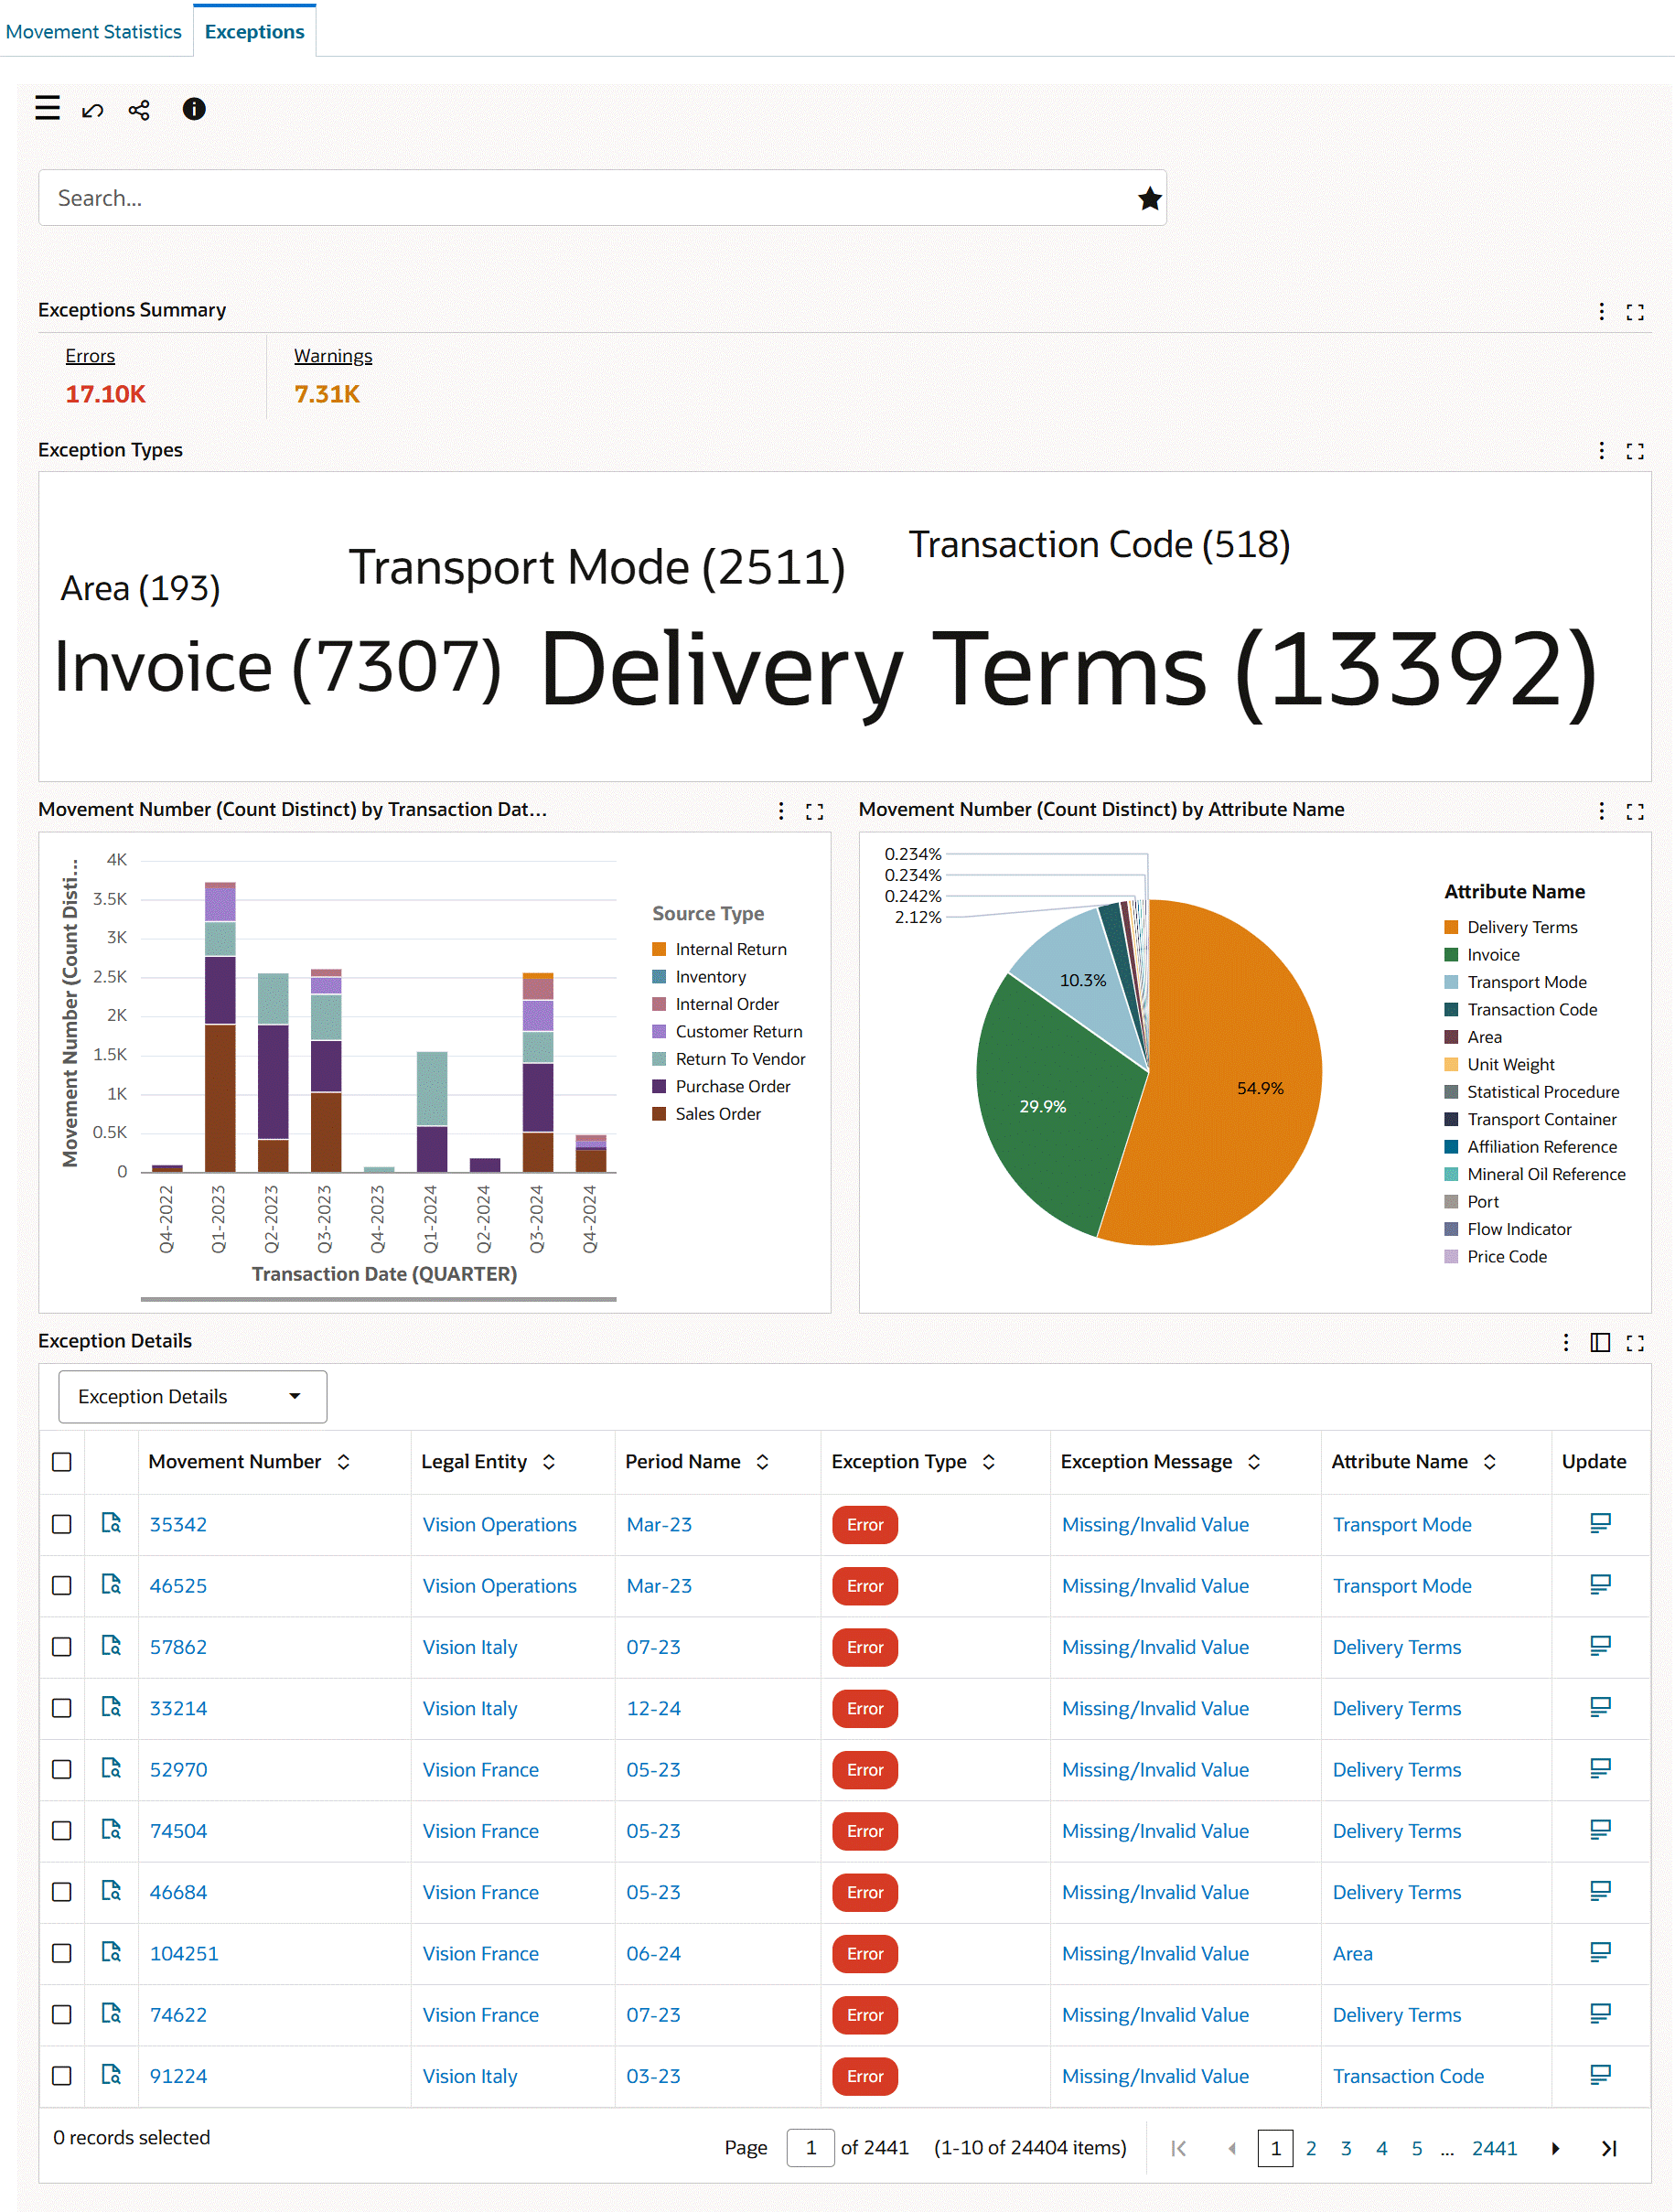
Exception Details - Row-Level Actions
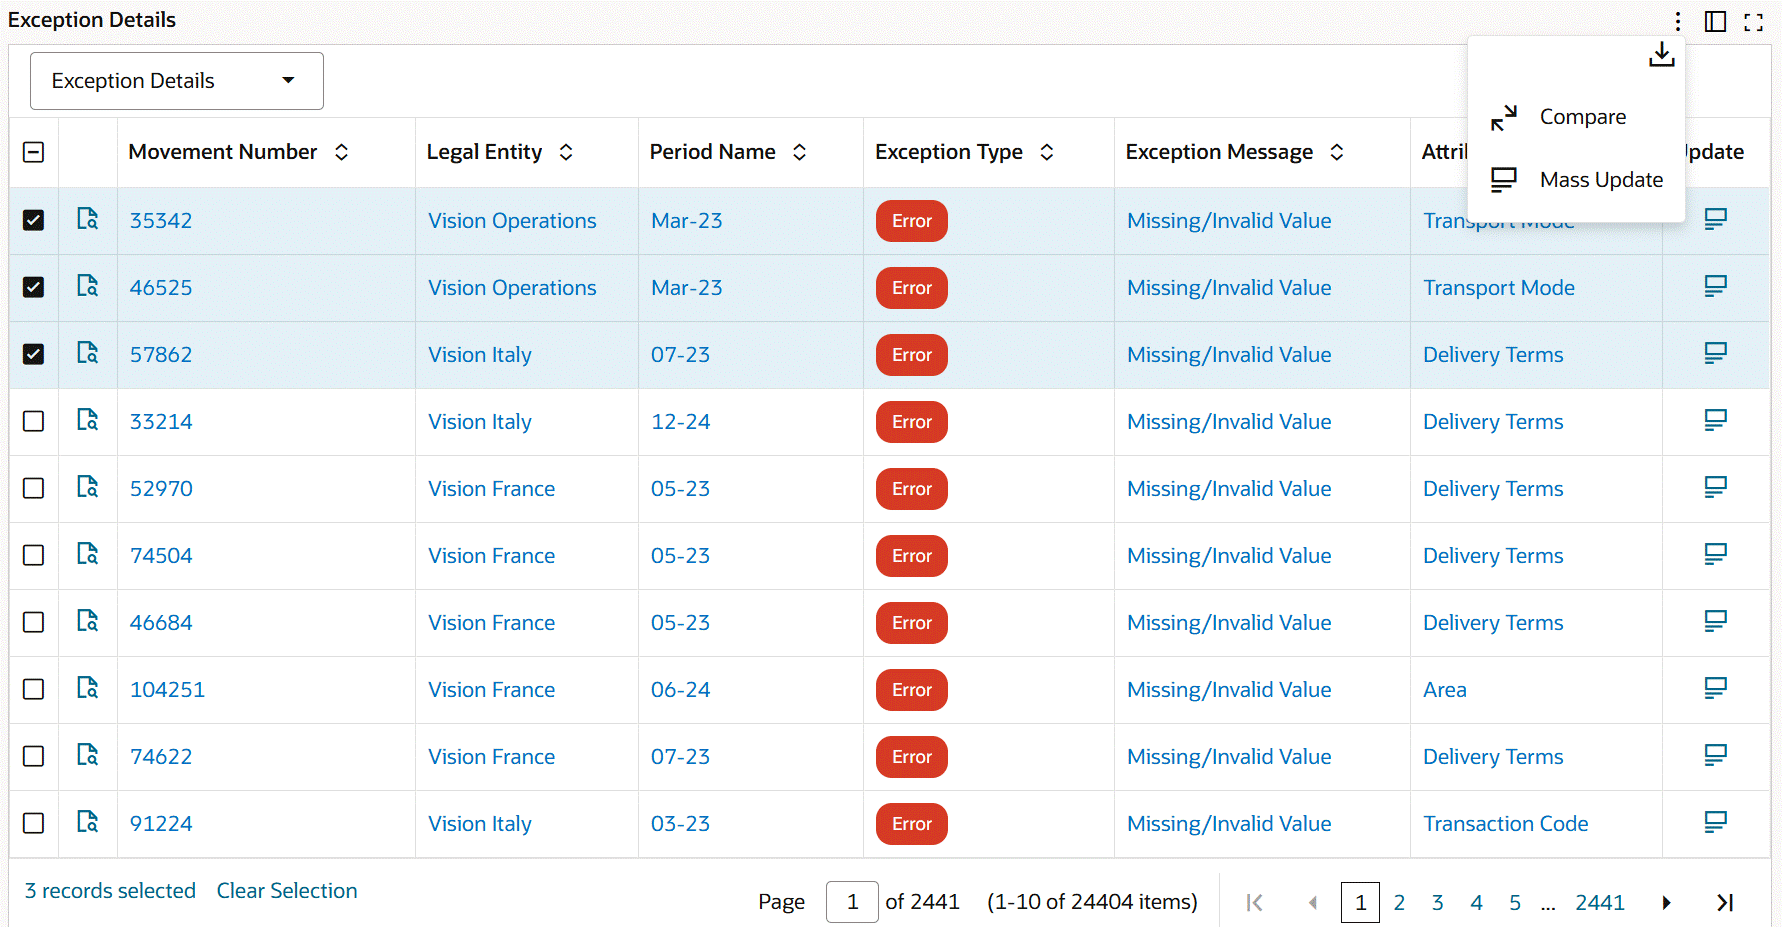
The following table describes the Exceptions dashboard components:
| Components | Description |
|---|---|
| Exceptions Summary (metrics) | The Exceptions Summary bar presents the following key metrics. Click the metric link to refine the dashboard data.
|
| Exception Types (tag cloud) | This tag cloud provides an overview of attributes with errors and warnings. This tag cloud shows attributes and the number of movement records with incorrect or missing values for attributes. For example, two tag clouds, Delivery Terms (2) and Commodity Code (4) mean that there are two movement records with incorrect or missing value for the Delivery Terms attribute and four movement records with missing value for the Commodity Code attribute. The tag cloud component displays the attributes in relative sizes based on the number of records with errors or warnings. Click a tag cloud to filter based on the relevant tag cloud and review the error exception type in the Exception Details table. |
| Movement Number (Count Distinct) By Transaction Date, Source Type (chart) | By default, this chart shows the number of movement records with exceptions by source type across quarters. You can select a different dimension to plot the chart by exception type, exception name, exception message, and attribute name. You can change the time grain to daily, weekly, monthly, or yearly. |
| Movement Number (Count Distinct) By Attribute Name (pie chart) | This pie chart shows the percentage of attributes with errors. Use this pie chart to identify the attributes that contribute to most of the exception errors. The hover text for each segment displays the attribute name and the number of records with the incorrect attribute value. |
| Exception Details (results table) | The Exception Details table contains the following attribute groups to examine exception details:
Important: If a movement record has multiple exceptions, then each exception appears in a separate row. Performing Actions
Important: After you fix errors, updates to the dashboards happen in real time.
|
