Kanban Dashboard
This chapter covers the following topics:
Kanban Dashboard
As a Kanban planner or an inventory control supervisor, use the Kanban Dashboard to:
-
Review Kanban pull sequence metrics.
-
Review Kanban card metrics.
-
Track and monitor inventory health using the Inventory Health tab.
-
Review inventory health of Kanban items periodically at various points of use in the organization and identify the pull sequences with low, normal or excess stock.
-
Review the material replenishment history for an item pull sequence and monitor on hand, safety stock, and daily demand quantities.
-
-
View and monitor the replenishment lead time using the Replenishment Lead Time tab.
-
Review replenishment lead time performance.
-
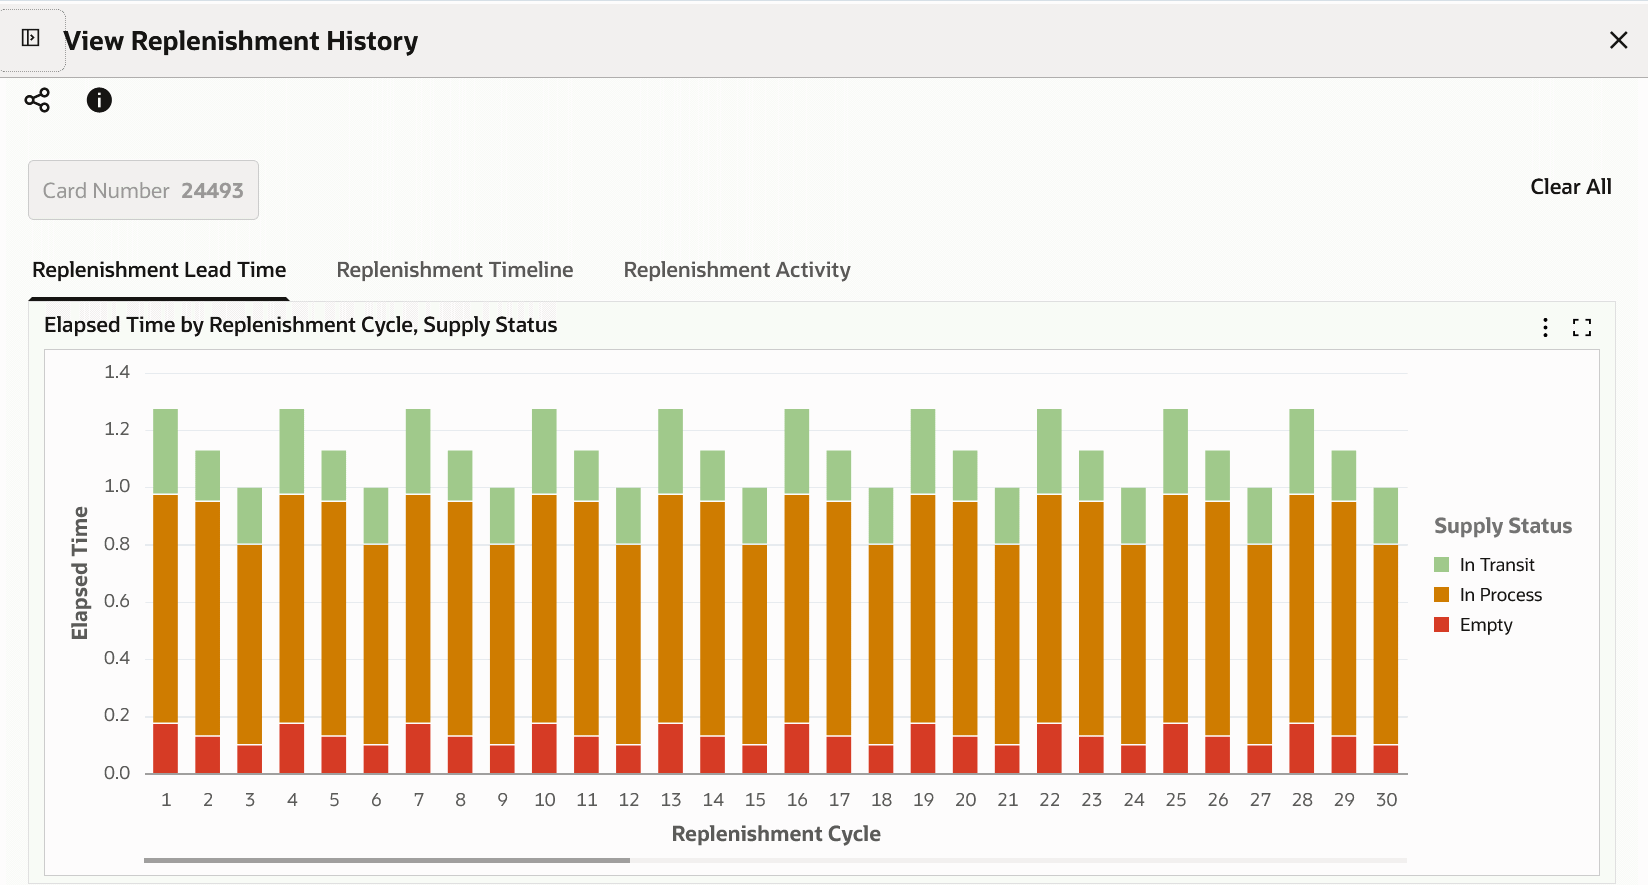
Review the replenishment lead time trend for an item pull sequence by each replenishment cycle of a Kanban card.
-
Visualize total lead time for every replenishment cycle for each Kanban card, by stacking elapsed time in each supply status change of the card.
-
Handle supply exception due to longer replenishment lead time situations.
-
-
Analyze demand requirements using the Kanban Demand tab.
-
Monitor demand for pull sequences at various points of use in the organization
-
Review the material replenishment history for an item pull sequence and track on hand, safety stock, and daily demand quantities.
-
Proactively identify potential future stockout situation due to changes in demand.
-
-
Monitor unmoved cards using the Kanban Cards tab.
-
View the count of Kanban cards by card and supply statuses.
-
Find Kanban cards that have been in a particular supply status for an extended period of time.
-
Use the tile view to review details of Kanban cards and compare one or more Kanban cards by different attributes.
-
Review the replenishment cycle time details for a Kanban card.
-
View the replenishment elapsed time by supply status changes for all replenishments.
-
Use the timeline view of replenishment events.
-
Monitor the replenishment activity details of all replenishments.
-
-
Change the supply status of a single Kanban card or multiple Kanban cards.
-
Take action to follow-up with supply source to ensure timely replenishments.
-
-
View the Replenishment Chain network diagram and use the information to take necessary action.
-
Navigate to other Electronic Kanban Oracle application pages.
You can search using the available refinements for Kanban pull sequences, Kanban cards, Kanban lead time, and Kanban demand. For example, you can select to refine your search using item, point of use, inventory health, source type, lead time, card number, unmoved status, current activity, source, planning, demand report, and so on.
From the eKanban Super User responsibility, navigate to the Kanban Dashboard:
(N) Home (OAF)> Kanban Dashboard (tab)
Kanban Dashboard

The following table describes the Kanban Dashboard components:
| Component | Description |
| Kanban Pull Sequences (summary bar) | The Kanban Pull Sequences summary bar displays the following metrics:
Click a metric to refine the information in the dashboard. |
| Kanban Cards (summary bar) | The Kanban Cards summary bar displays the following metrics:
Click any of the metrics to view card information in the Kanban Cards tab. |
| Inventory Health (tab) | The Inventory Health tab provides charts and grids that give you insights into the inventory levels versus the safety stocks and enable you to identify the stock positions and take action to meet any demand. You can view the material replenishment history for an item pull sequence in the View Replenishment History chart. For details, see Inventory Health Tab. |
| Replenishment Lead Time (tab) | The Replenishment Lead Time tab provides charts and tables that give you insights into the calculation of the actual lead time of replenished cards for each pull sequence and compares it with the planning lead time. You can use the information in this tab to identify the items with longer lead time and plan the replenishments. You can view the replenishment cycle time trend for an item pull sequence in the View Replenishment Lead Time chart. For details, see Replenishment Lead Time Tab. |
| Kanban Demand (tab) | The Kanban Demand tab provides charts and tables that give you insights into the calculation of the actual demand for each item based on the number of card replenishments and then compares it with demand calculated from the planning logic. You can use this tab to identify the items with greater demand and plan the replenishments accordingly. You can view the replenishment history for an item pull sequence in the View Replenishment History chart. For details, see Kanban Demand Tab. |
| Kanban Cards (tab) | The Kanban Cards tab provides charts and tables that give you insights into the cards that have been in a specific supply status for an extended length of time. You can use this tab to identify such cards and update the status. Use the tile view to review Kanban cards. In the Kanban Cards table, click the View Replenishment History row action to navigate to the following tabs and review information:
For details, see Kanban Cards Tab. |
Inventory Health Tab
The Inventory Health tab displays the inventory levels as compared to the safety stocks. Based on the percentage of the actual inventory to safety stock, inventory health can be categorized into Low Stock, Normal Stock, or Excess Stock.
Inventory Health Metrics Calculations
The following parameters are used in the calculation:
-
Inventory Health Threshold - Bad
The percentage of safety stock inventory considered unacceptable for the Inventory Heath. A value below this threshold is considered at a Low Stock status (Red).
-
Inventory Health Threshold - Good
The percentage of safety stock inventory considered acceptable for the Inventory Heath. A value equal to or greater than this threshold is considered as Excess Stock (Yellow).
Values that are greater than or equal to the Inventory Health Threshold - Bad, or less than the Inventory Health Threshold - Good, are considered as Normal Stock (Green).
Inventory health is displayed as None (Gray) when the parameters are not set up and safety stock days, average daily demand are not defined in the pull sequence. You can define the Average Daily Demand with a specific average demand using the Update Production action in the Planning Workbench. See Viewing and Updating Pull Sequence Planning.
Example: Inventory Health Calculation
The following example explains the inventory health calculation.
In this example, Parameters are set as follows on the Configurations tab, Parameters page. See Configuring Kanban Parameters.
For inventory health threshold:
-
Inventory Health Threshold - Bad: 75 % of safety stock
-
Inventory Health Threshold - Good: 125 % of safety stock
For an item pull sequence:
-
Card Size: 100
-
Safety Stock Days: 2
-
Average Daily Demand: 100
-
Safety Stock: 200 (Average Daily Demand x Safety Stock Days)
Inventory Health calculations is based on the parameters and pull sequence setup:
-
Low Stock (Red) is when inventory is below 75 % of 200 or 150
-
Excess Stock (Yellow) is when inventory is greater than 125% of 200 or 250
-
Normal Stock (Green) is when inventory is between 75% and 125 % of 200, which is between 150 and 250
The following table shows the Inventory Health, which is displayed based on the Cards in Supply Status set to Full.
| Case | Cards in Supply Status Full | Quantity | Inventory Health |
|---|---|---|---|
| 1 | 1 | 100 | Low Stock (Red) |
| 2 | 2 | 200 | Normal Stock (Green) |
| 3 | 3 | 300 | Excess Stock (Yellow) |
Also, Custom Extension is available to define specific values at the Pull Sequence level to override the parameters that are set at the Organization level. See Configure Inventory Health Analytic.
Inventory Health Tab Components
Inventory Health Tab

Inventory Health Tab - Row-Level Actions
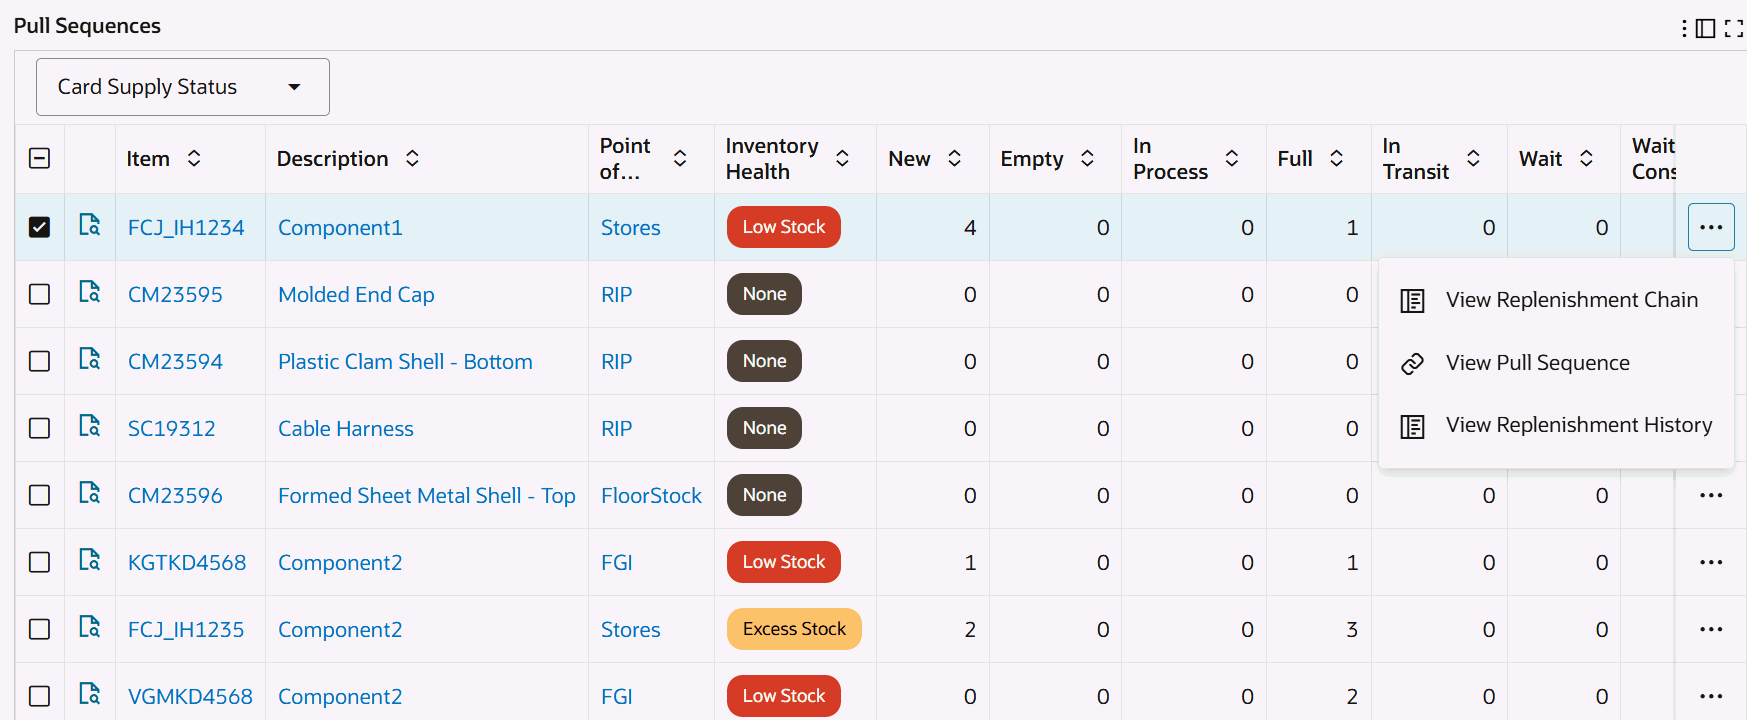
The following table describes the Inventory Health tab components:
| Component | Description |
| Pull Sequence (Count Distinct) by Point of Use, Inventory Health (chart) | This chart displays the inventory health of pull sequences by point of use. Click the Options icon to select Inventory Health or Point of Use from the Dimension menu. Select Point of Use from the Group Dimensions menu. |
| Pull Sequence (Count Distinct) by Source Type, Inventory Health (chart) | This chart displays the inventory health of pull sequences by source type. Click the Options icon to select Inventory Health or Source from the Dimension menu. Select Source Type, Source, Supplier, Source Subinventory, or Source Organization from the Group Dimensions menu. |
| Inventory Health Summary by Point of Use (pivot table) | Use this table to analyze the inventory health of pull sequences by point of use. |
| Inventory Health Summary by Source Type (pivot table) | Use this table to analyze the inventory health of pull sequences by source type. |
| Pull Sequences Results Table (tab layout) | On the Inventory Health tab's Pull Sequences results table, you can select from the following attribute groups to display details by:
Click the Record Details icon for a selected item to view the Details dialog box. Row-Level Actions You can perform the following row-level actions. Select a row, click the Actions icon and select from the following:
Table-Level Actions To perform a table-level action, select one or more rows and choose from the following actions available from the Options icon in the Inventory Health tab's results table:
|
See:
Replenishment Lead Time Tab
The Replenishment Lead Time tab shows the actual lead time of replenished cards for each pull sequence, and compares it with lead time setup in the Planning tabbed region for the pull sequence. See Planning Workbench.
Replenishment Lead Time Metrics Calculations
The dashboard displays the number of pull sequences, taking into account the tolerance value, for:
-
Shorter Lead Time (Yellow) - Actual Lead Time is less than Planned Lead Time
-
Longer Lead Time (Red) - Actual Lead Time is greater than Planned Lead Time
-
Normal Lead Time (Green) - Actual Lead Time is equal to Planned Lead Time
Note: Lead Time will be displayed as None (Gray) when the parameters are not set up and lead time is not defined in the pull sequence or if there are no replenishment cycles completed within the defined range of days.
You can define the default time period and set the value for tolerance using the Electronic Kanban parameters for lead time calculations:
-
Actual vs Planned Lead Time - Default Number of Days
The number of days used to calculate the lead time between actual lead time and planning days for replenished cards and pull sequences.
-
Actual vs Planned Lead Time - Equality Tolerance
The tolerance or margin percentage in the calculation between actual and planned demand lead time.
The following parameter values are used in the "System Defined" report:
-
Actual vs Planned Lead Time - Default Number of Days: Defaults the report range start date based on the number of days from the end date and range end date is defaulted with the current date.
-
Actual vs Planned Lead Time - Equality Tolerance: Defaults the equality tolerance for lead time calculations.
Note: You can also define custom reports with different range start date, range end date and equality tolerance for replenishment lead time calculations.
Example: Replenishment Lead Time Calculation
The following example explains the replenishment lead time calculation.
In this example, Parameters are set as follows on the Configurations tab, Parameters page. See Configuring Kanban Parameters.
For lead time:
-
Actual vs Planned Lead Time - Default Number of Days: 10
-
Actual vs Planned Lead Time - Equality Tolerance: 5
For an item pull sequence:
-
Number of cards: 2
-
Planned Lead Time: 2
The Lead Time calculations is based on the parameters and pull sequence setup.
-
Longer Lead Time (Red) is when replenishment lead time is greater than +5 % of 2 days or 2.1
-
Shorter Lead Time (Yellow) is when replenishment lead time is lesser than -5 % of 2 days or 1.9
-
Normal Lead Time (Green) is when replenishment lead time is between -5% and 5% of 2 days which is between 1.9 and 2.1
Actual Lead Time Calculations
Assume that the number of replenishments in the last 10 days (based on the parameter setting) is 5.
The following table shows the calculation of replenishment lead time and days.
| Replenishment Lead Time | Days |
|---|---|
| Card 1, cycle 1 | 2.5 |
| Card 2, cycle 1 | 2.5 |
| Card 1, cycle 2 | 2.5 |
| Card 2, cycle 2 | 1.8 |
| Card 1, cycle 3 | 2.7 |
| Average Lead Time | (2.5+2.5+2.5+1.8+2.7)/5 = 2.4 days |
In this example, the "System Defined" report shows the pull sequence with Longer Lead Time (Red).
Replenishment Lead Time Tab Components
Replenishment Lead Time Tab

Replenishment Lead Time Tab - Row-Level Actions
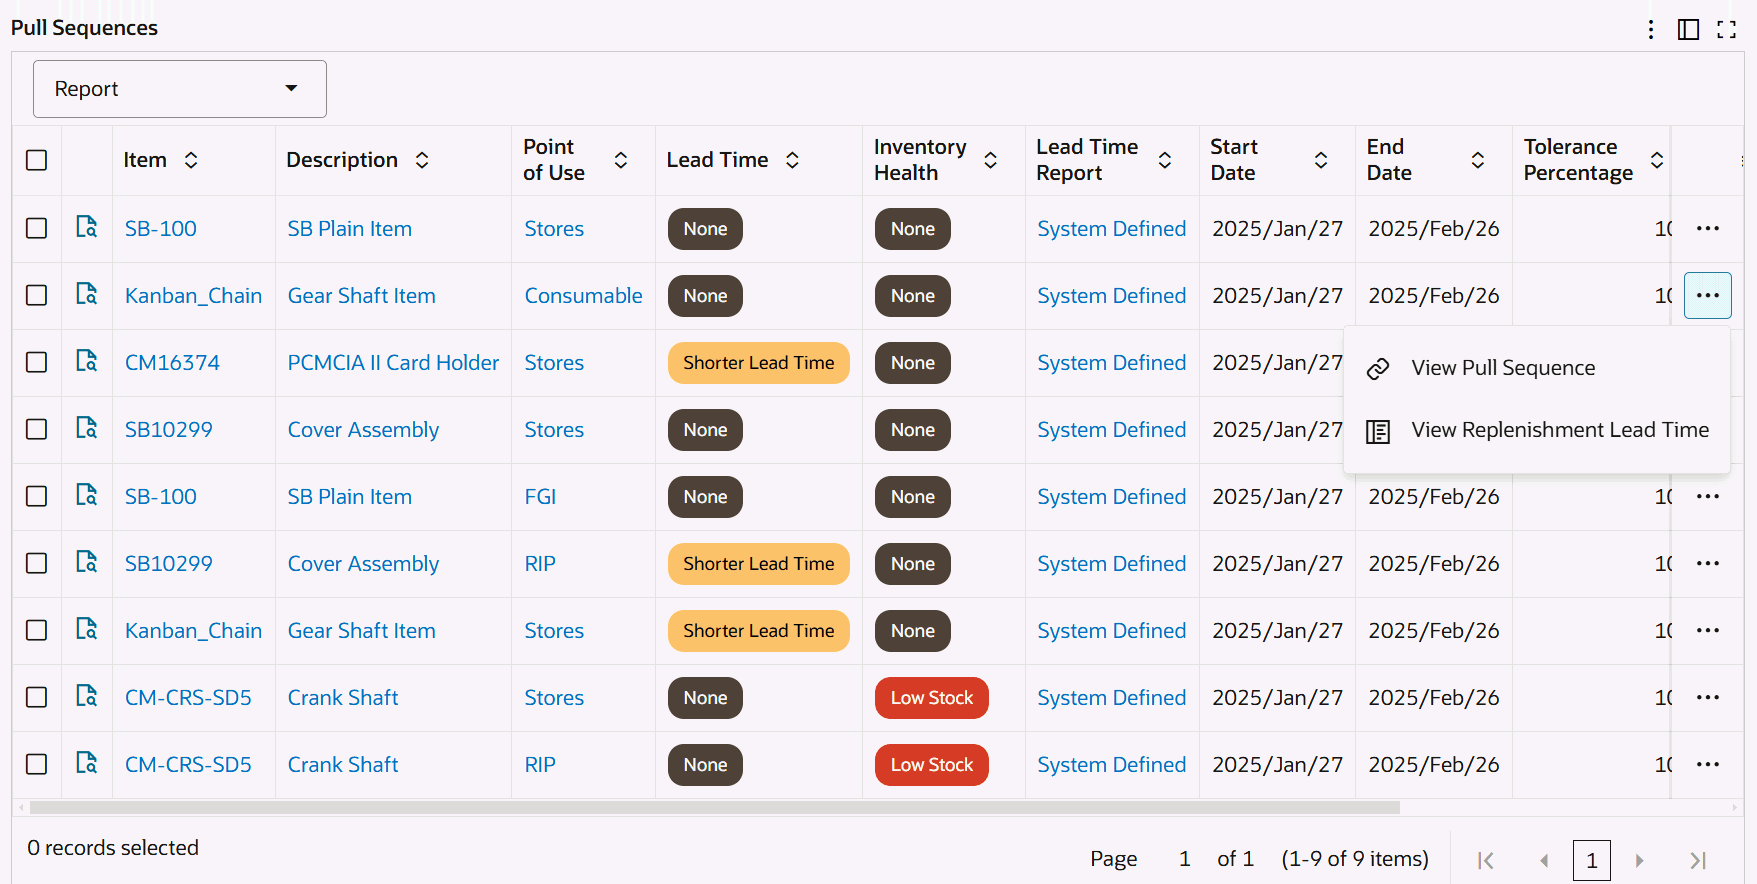
Replenishment Lead Time Chart
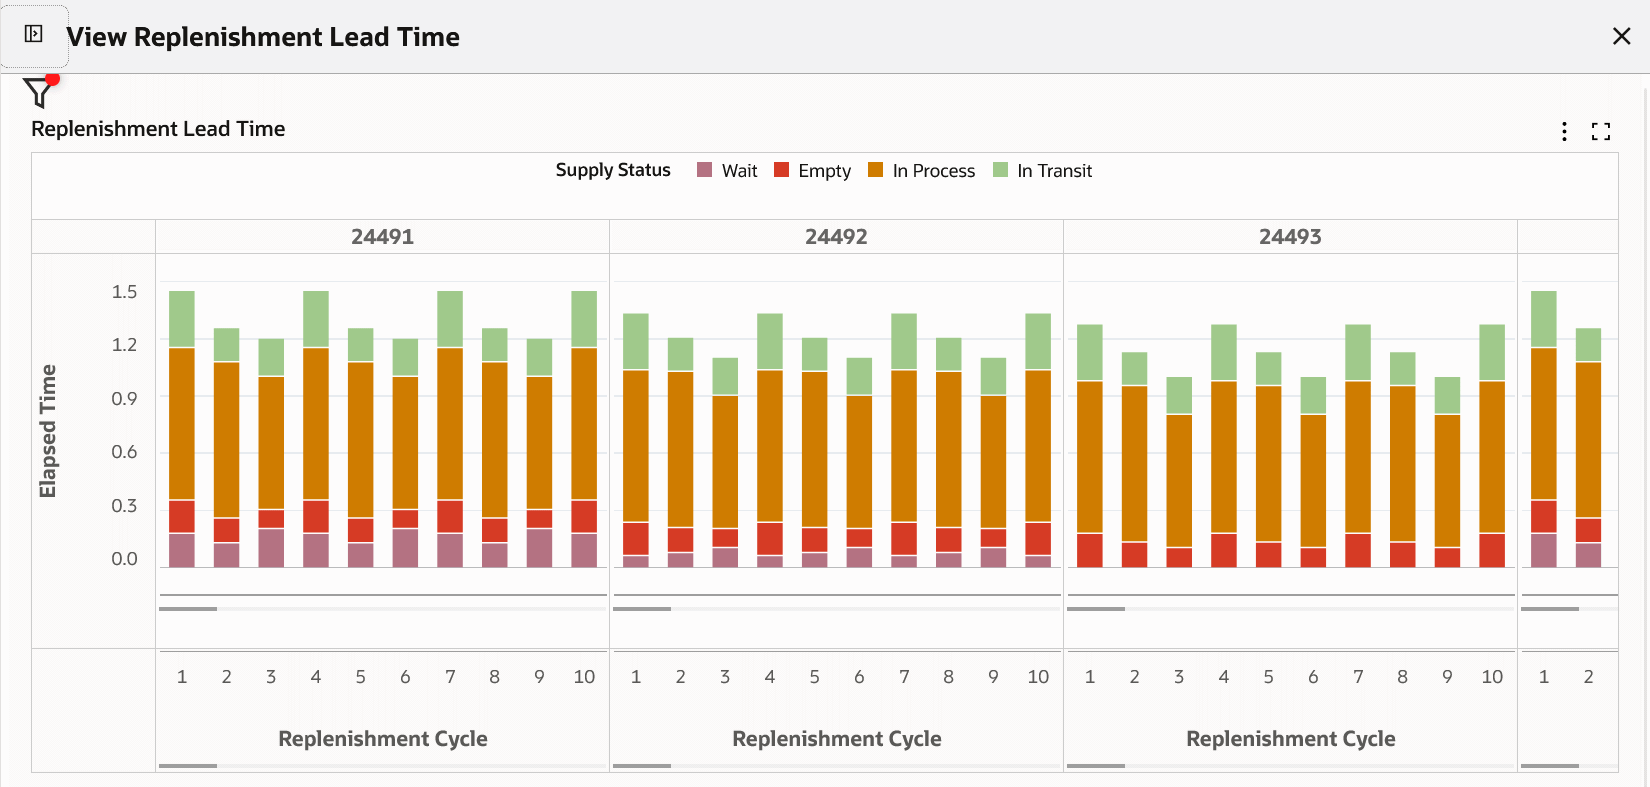
The following table describes the Replenishment Lead Time tab components:
| Component | Description |
| Report Count (link) | Click Report Count to view and select from multiple reports. Note that the Replenishment Lead Time tab defaults the System Defined report based on the parameters set on the Configurations tab, Parameters page. You can only create lead time reports. Note: If your system administrator runs the Electronic Kanban ECC Data Load with the Full Load option, then after the completion of the full load, user defined reports are removed, and the dashboard displays only the system defined report. |
| Create New Lead Time Report (button) | To define a lead time report:
|
| Pull Sequence (Count Distinct) by Point of Use, Lead Time (chart) | This chart enables you to identify the number of pull sequences by point of use based on the Replenishment Lead Time classification. You can drill down on the pull sequence values. Click the Options icon to select Lead Time or Point of Use from the Dimension menu. Select Point of Use from the Group Dimensions menu. |
| Pull Sequence (Count Distinct) by Source Type, Lead Time (chart) | This chart enables you to identify the number of pull sequences by source type based on the Replenishment Lead Time classification. You can drill down on the pull sequence values. Click the Options icon to select Lead Time, Source Type, or Source from the Dimension menu. Select Source Subinventory, Source, Supplier, Source Organization, and Source Inventory from the Group Dimensions menu. |
| Lead Time Summary by Point of Use (pivot table) | Use this table to analyze lead time classification of pull sequences by point of use. |
| Lead Time Summary by Source Type (pivot table) | Use this table to analyze lead time classification of pull sequences by source type. |
| Pull Sequences Results Table (tab layout) | On the Replenishment Lead Time tab's Pull Sequences results table, you can select from the following attribute groups to display details by:
Click the Record Details icon for a selected item to view the Details dialog box. Click the links in the table columns to refine the information available in the Kanban Dashboard. Row-Level Actions You can perform the following row-level actions. Select a row, click the Actions icon and select from the following:
Table-Level Actions To perform a table-level action, select one or more rows and choose from the following actions available from the Options icon in the Replenishment Lead Time tab's results table:
|
See:
Kanban Demand Tab
In the Actual Demand versus Planned Demand calculation, the actual demand is calculated for each pull sequence, and compared with average daily demand as calculated from the planning logic. The dashboard displays the number of pull sequences where actual demand is greater than planned, less than planned, and equal to planned, taking into account the tolerance value.
Demand Metrics Calculations
You can define the default time period and set the value for tolerance using the Electronic Kanban parameters for demand calculations:
-
Actual vs Planned Demand - Default Number of Days
The time period for calculating demand between actual lead time and planning days for replenished cards
-
Actual vs Planned Demand - Equality Tolerance
Tolerance in the calculation between actual and planned demand for replenished cards.
Demand is displayed as None (Gray) when the parameters are not set up or average daily demand is not defined in the pull sequence or if there are no replenishments performed within the defined range of days. You can define the Average Daily Demand with a specific average demand using the Update Production action in the Planning Workbench. See Viewing and Updating Pull Sequence Planning.
The following parameter values are used in the "System Defined" report.
-
Actual vs Planned Demand - Default Number of Days: Defaults the report range start date based on the number of days from the end date and range end date is defaulted with current date.
-
Actual vs Planned Demand - Equality Tolerance: Defaults the equality tolerance for demand calculations.
Note: You can also define custom reports with different range start date, range end date and equality tolerance for demand calculations.
Example: Demand Calculation
The following example explains the Demand calculation.
In this example, Parameters are set as follows on the Configurations tab, Parameters page. See Configuring Kanban Parameters.
For demand:
-
Actual vs Planned Demand - Default Number of Days: 50
-
Actual vs Planned Demand - Equality Tolerance: 10
For an item pull sequence:
-
Average Daily Demand: 10
-
Card Size: 100
Demand calculations is based on the parameters and pull sequence setup.
-
Greater Demand (Red) is when demand is greater than +10 % of 10 or 11
-
Lower Demand (Yellow) is when demand is lesser than -10 % of 10 or 9
-
Normal Demand (Green) is when demand is between -10 % and 10 % of 10 which is between 9 and 11
Actual Demand Calculations:
-
Number of replenishments in 50 days: 6
-
Actual Demand = 100 * 6 / 50 = 12 per day
In this example, the "System Defined" report shows the pull sequence with Greater Demand (Red).
Kanban Demand Tab Components
Kanban Demand Tab

Kanban Demand Tab - Row-Level Actions
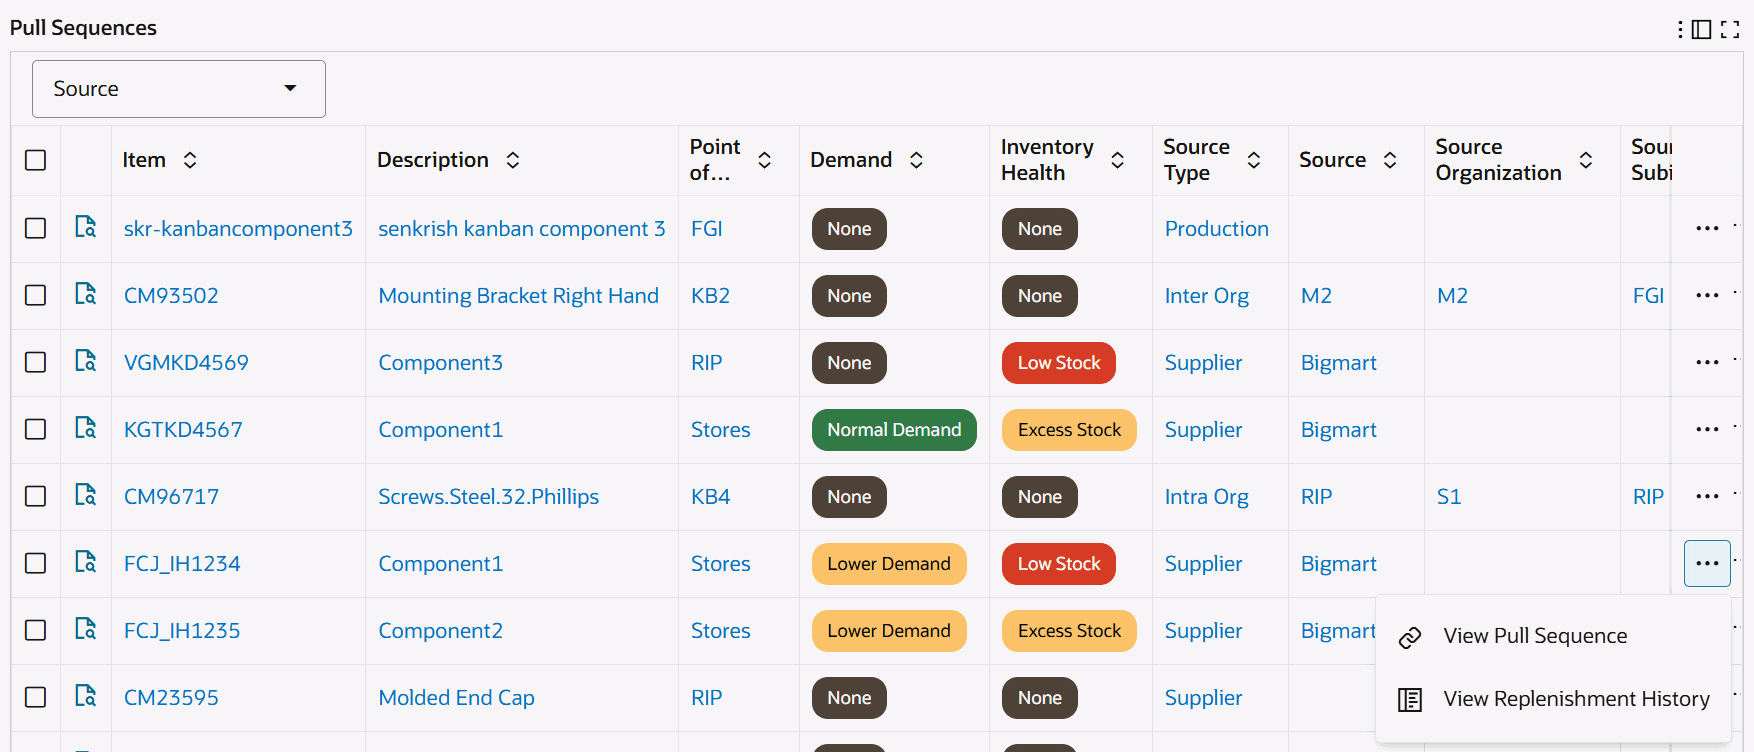
Replenishment History Chart
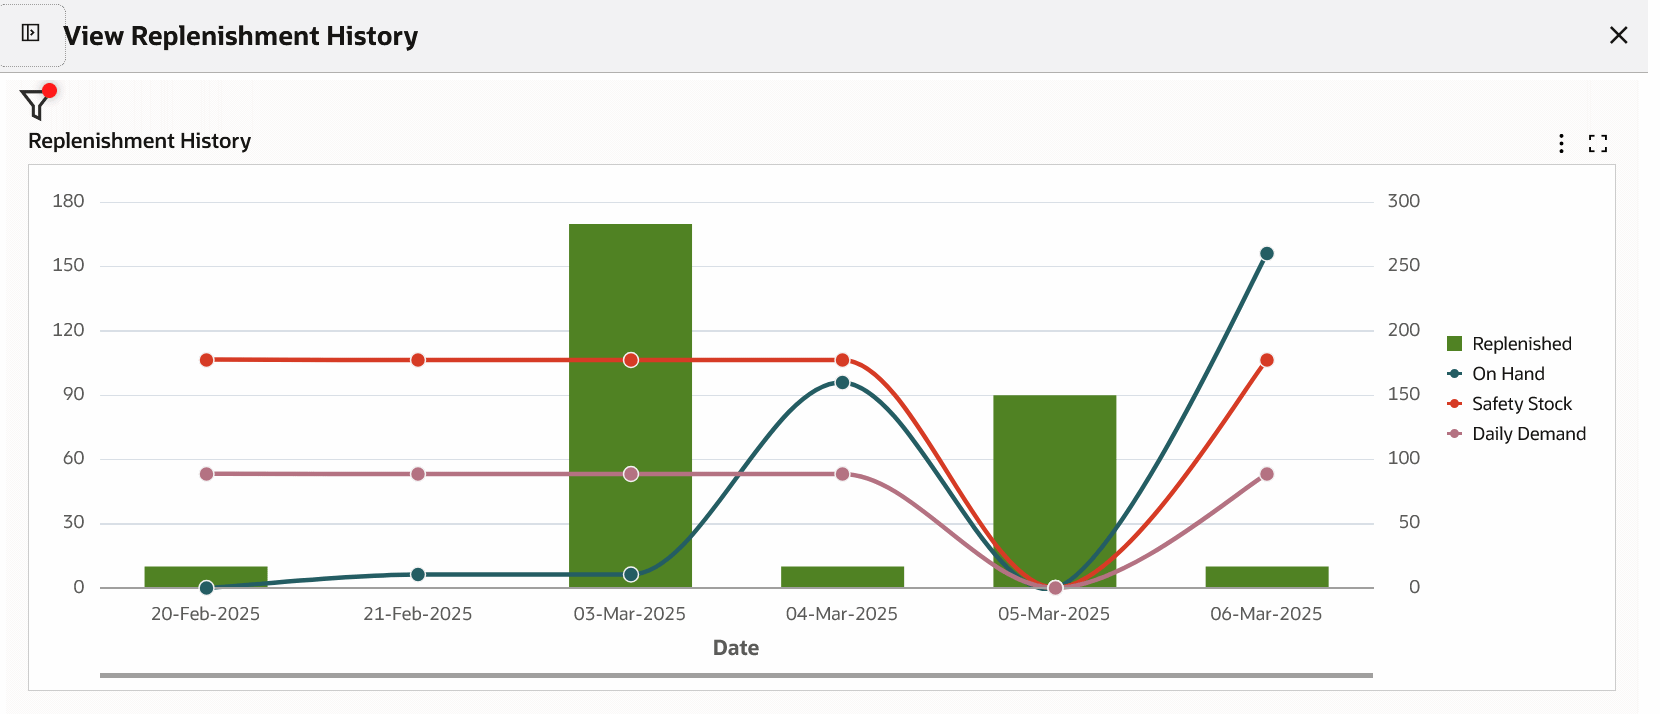
The following table describes the Kanban Demand tab components:
| Component | Description |
| Report Count (link) | Click Report Count to view and select from multiple demand reports. Note that the Kanban Demand tab defaults the System Defined report based on the parameters set on the Configurations tab, Parameters page. You can only create reports. Note: If your system administrator runs the Electronic Kanban ECC Data Load with the Full Load option, then after the completion of the full load, user defined reports are removed, and the dashboard displays only the system defined report. |
| Create New Demand Report (button) | To define a demand report:
|
| Pull Sequence (Count Distinct) by Point of Use, Demand (chart) | This chart displays the number of pull sequences by point of use based on the Demand classification. You can drill down on the pull sequence values. Click the Options icon to select Demand or Point of Use from the Dimension menu. Select Point of Use from the Group Dimensions menu. |
| Pull Sequence (Count Distinct) by Source Type, Demand (chart) | This chart displays the number of pull sequences by source type based on the Demand classification. You can drill down on the pull sequence values. Click the Options icon to select Demand, Source Type, or Source from the Dimension menu. Select Source Type, Source, Supplier, Source Organization, or Source Subinventory from the Group Dimensions menu. |
| Demand Summary by Point of Use (pivot table) | Use this table to analyze demand classification of pull sequences by point of use. |
| Demand Summary by Source Type (pivot table) | Use this table to analyze demand classification of pull sequences by source type. |
| Pull Sequences Results Table (tab layout) | On the Kanban Cards tab's Pull Sequences results table, you can select from the following attribute groups to display details by:
Click the Record Details icon for a selected item to view the Details dialog box. Click the links in the table columns to refine the information available in the Kanban Dashboard. Row-Level Actions You can perform the following row-level actions. Select a row, click the Actions icon, and select from the following:
Table-Level Actions To perform a table-level action, select one or more rows and choose from the following actions available from the Options icon in the Kanban Demand tab's results table:
|
See:
Kanban Cards Tab
The Kanban Cards tab displays cards that have been in a particular supply status for an extended period of time.
Unmoved Cards Metric Calculations
The length of time each supply status a card is considered unmoved is set in the Card Supply Statuses Electronic Kanban parameter. For this parameter, enter the percentage of lead time to show the length of time each supply status a card is considered unmoved. See Configuring Kanban Parameters.
The Unmoved Cards Calculation program calculates the number of cards that are in each supply status for a period of time configured by you. The program:
-
Selects all pull sequences for an organization. For every pull sequence, all Kanban cards are selected.
-
Finds the percentage of lead time for the valid statuses.
-
Gets the planned lead time for the pull sequence.
-
For every card, gets the Last Activity Date, Status, and Creation Date.
Example: Unmoved Cards Calculation
The following example explains the unmoved cards calculation.
In this example, Parameters are set as follows on the Configurations tab, Parameters page. See Configuring Kanban Parameters.
-
Card Supply Statuses
In Process: 10
-
For an item pull sequence
Lead Time: 2 days
Unmoved cards calculation is based on the parameters setup.
Card is Unmoved when lead time in In Process supply status is greater than +10 % of 2 or 0.2 days.
Assume the card supply status is In Process for 1 day. then, this card will be displayed as Unmoved card.
Also, Custom Extension is available to define specific values at the Pull Sequence or Kanban Card level to override the parameters that are set at the Organization level. See Determine Unmoved Kanban Cards Program.
Kanban Cards Tab Components
Kanban Cards Tab – Row-Level Actions

Kanban Cards Tab - View Replenishment History
Kanban Cards Tab – Table-Level Actions
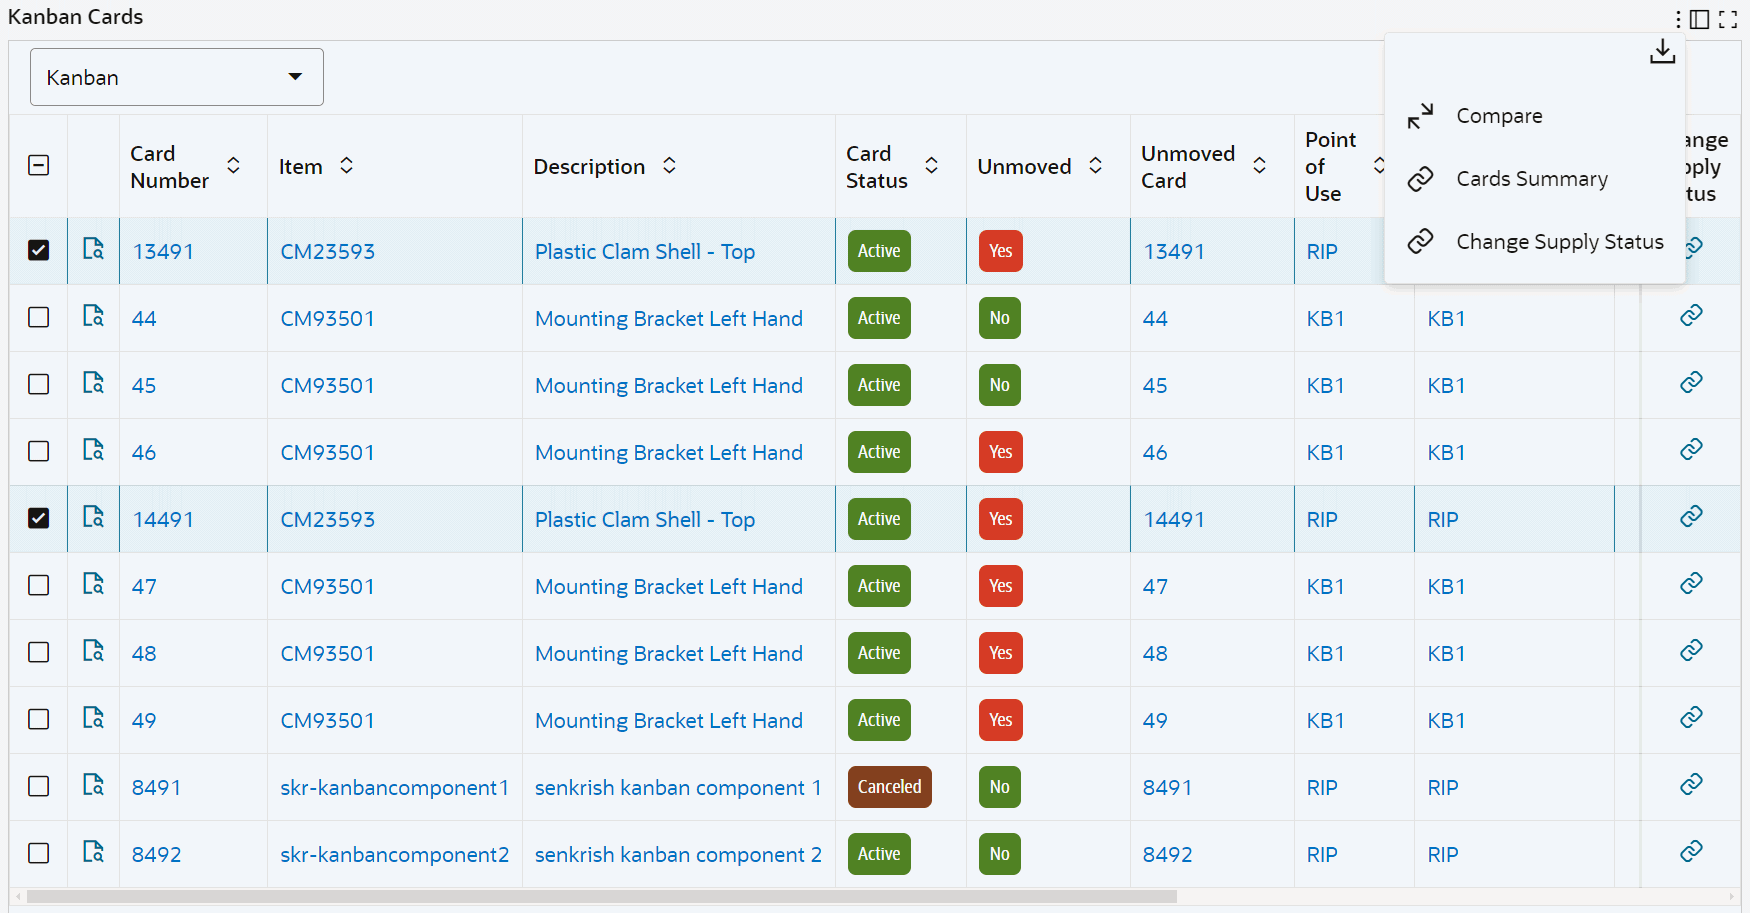
The following table describes the Kanban Cards tab components:
| Component | Description |
| Kanban Cards (tile) | Use the Kanban Cards tile to:
|
| Unmoved Card (Count Distinct) by Unmoved Duration, Supply Status (chart) | This chart shows the number of unmoved Kanban cards in each supply status and unmoved duration. The chart uses the following predefined unmoved duration days:
Click the Options icon to select Supply Status, Source Type, or Source from the Dimension menu. Select Unmoved Duration from the Group Dimensions menu. |
| Unmoved Card (Count Distinct) by Source Type, Supply Status (chart) | This chart shows the number of unmoved Kanban cards by source type and supply status. Click the Options icon to select Supply Status or Source from the Dimension menu. Select Source Type, Source, or Point of Use from the Group Dimensions menu. |
| Unmoved Cards Summary by Point of Use (pivot table) | Use this table to analyze unmoved cards by point of use. |
| Unmoved Cards Summary by Source Type (pivot table) | Use this table to analyze unmoved cards by source type. |
| Kanban Cards Results Table (tab layout) | On the Kanban Cards results table, you can select from the following attribute groups to display details by:
Click the Record Details icon for a selected item to view the Details dialog box. Click the links in the table columns to refine the information available in the Kanban Dashboard. Row-Level Actions You can perform the following row-level actions. Select a row, click the Actions icon, and select from the following:
Table-Level Actions To perform the following table-level actions, select one or more rows and click the Options icon in the results table:
|
See: