A script enabled browser is required for this page to function properly.
Skip to main content
STA User Interface Guide, v1.0.2
E28380-03
Table of Contents Previous Next Index


Using STA to Answer Tape Environment Questions : Drive and Media Health Questions : ▼ Report Trends in Drive Error Rates

Report Trends in Drive Error Rates

This procedure addresses the questions, “Which drives have had the most errors this week? Have their error rates gone up?”

Although STA screens show 30 days worth of data by default, you can use filter and selection criteria to narrow down to just the current week. The following methods are described:

Referenced Tasks

Using the Drives – Overview Screen

1.

2.

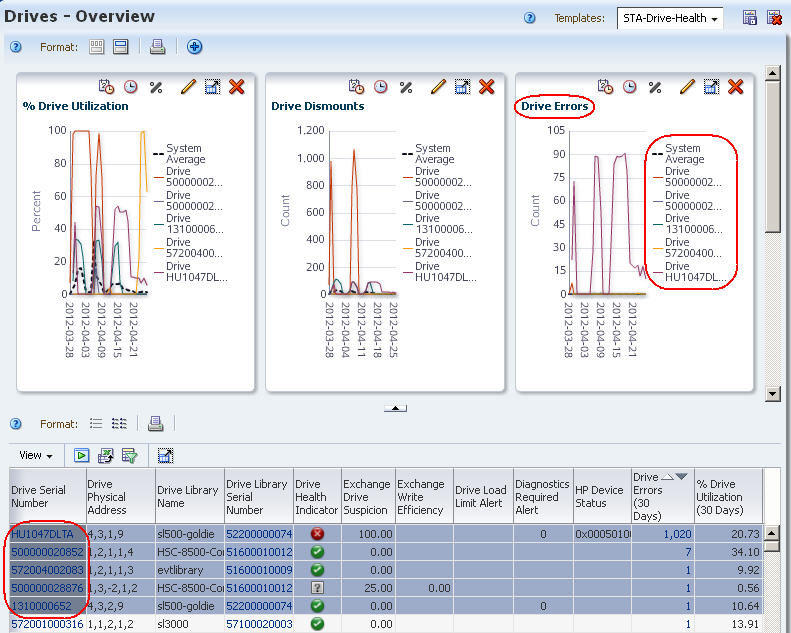
A running 30-day sum of drive errors is shown in the table and one of the graph panes.

3.

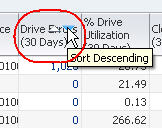
The drives with the most errors are brought to the top of the list.

4.
a.
b.

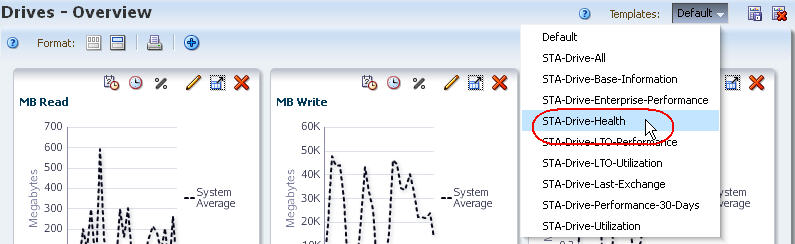
All graphs, including “Drive Errors”, are updated to show these drives over a 30‑day period.

5.
a.

b.
c.

The graph is updated according to your selection criteria. The variations in the graph lines show increases and decreases in error rates during the week.

Using the Libraries – Exchanges Screen

1.

2.

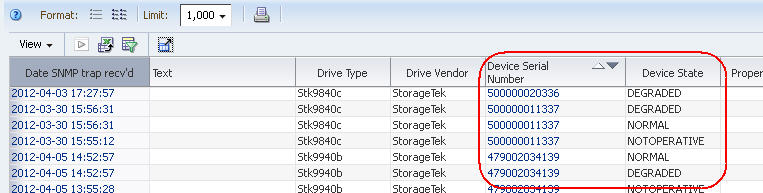
This template applies a filter to show only exchanges with errors.

3.

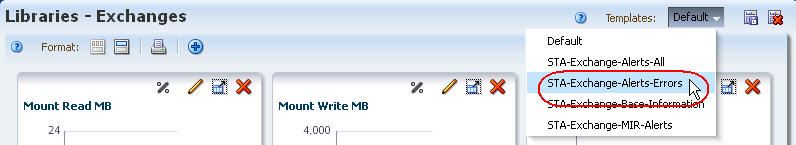
Errors are grouped by drive, allowing you to bring focus to faulty drives.
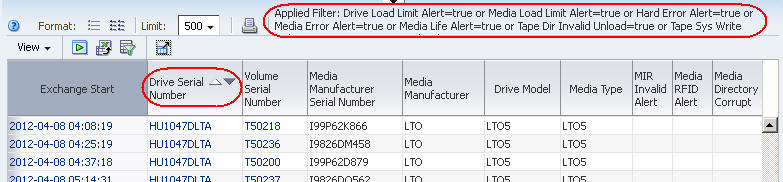
4.
5.
a.
b.
c.

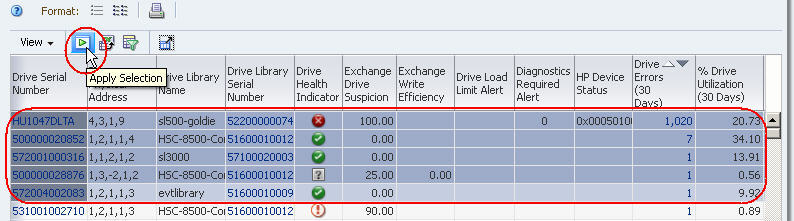
The table is updated according to your selection criteria.

Using the Notifications – Overview Screen

Since most notifications do not contain a specific drive reference, the information from this method is not as comprehensive as from the others. However, this method does provide a quick snapshot of drives whose health state has changed.

1.

2.

Errors and statuses are grouped by drive.

3.

Table of Contents Previous Next Index Link to documentation
Copyright © 2012 Oracle and/or its affiliates. All rights reserved.