A script enabled browser is required for this page to function properly.
Skip to main content
STA User Interface Guide, v1.0.2
E28380-03
Table of Contents Previous Next Index


Using STA to Answer Tape Environment Questions : Drive and Media Health Questions : ▼ Report Drive Efficiency Trends

Report Drive Efficiency Trends

This procedure addresses the question, “Which drives have had significantly declining efficiency over time?”

STA records and displays many measures of data transfer rate efficiency, including read, write, and R/W combined rates. STA collects the rates per exchange and then summarizes them into daily and 30-day time periods. In addition, some drive types also provide their own efficiency calculations. Following are some of the efficiency attributes reported by STA.

Referenced Tasks

1.

2.

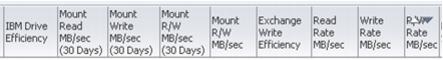
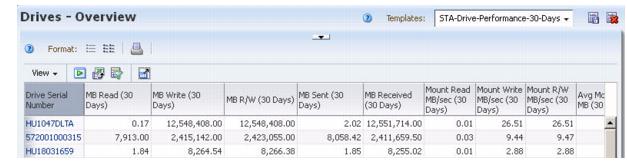
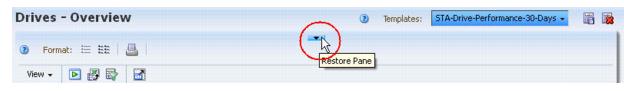
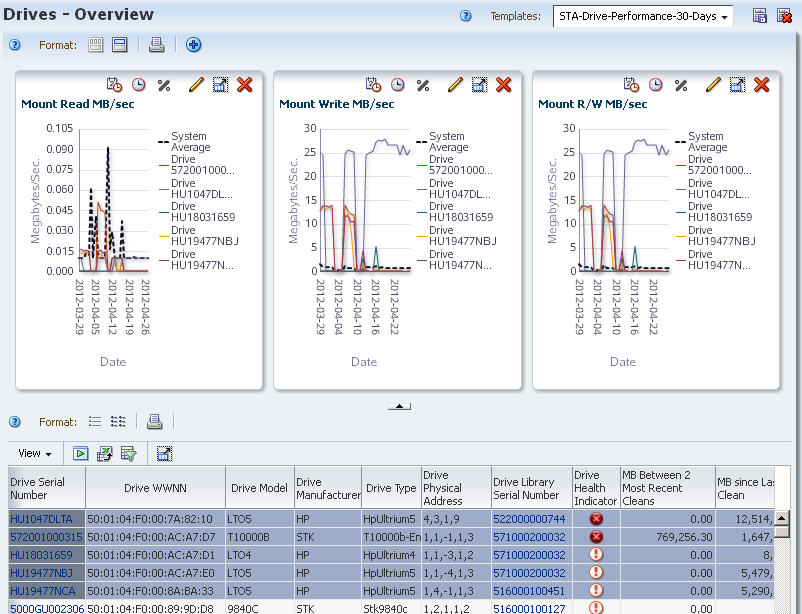
This template includes attributes related to drive performance. It does not include any graph panes.

Note – Some of the measures are null or zero if STA has not been monitoring a drive long enough to gather data and calculate accurate numerical values.

3.

By graphing selected attributes, you can see increases or decreases in efficiency over time, and compare individual drive efficiency numbers to the system average.

a.

The Graphics Area is blank.

b.

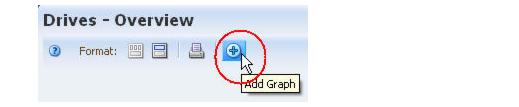
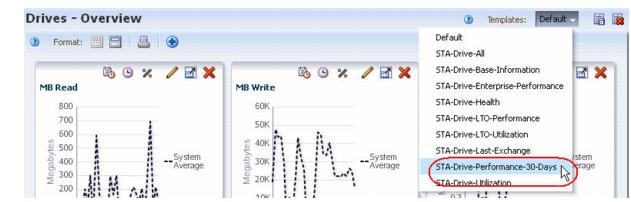
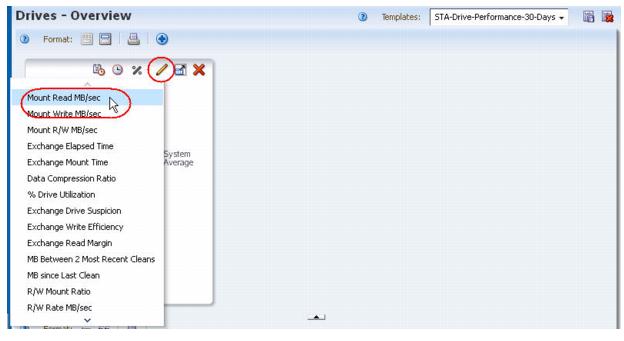
A new graph pane, with the attribute “MB Read”, is added to the Graphics Area display.

c.

d.
Repeat Step b and Step c for any additional attributes you want to graph.

The graphs are updated to display the system average for the attributes you have selected. The examples below show “Mount Read MB/sec”, “Mount Write MB/sec”, and “Mount R/W MB/sec”.

4.

Adding the drives to the graphs allows you to compare their attribute values against the system average. By default, graphs always include the system average.

a.
b.

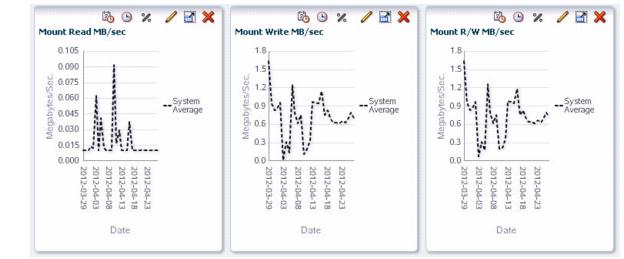
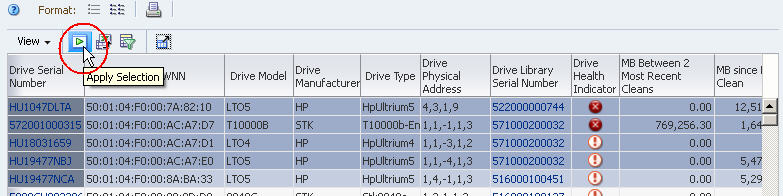
The drives are added to all the screen graphs.


Table of Contents Previous Next Index Link to documentation
Copyright © 2012 Oracle and/or its affiliates. All rights reserved.