A script enabled browser is required for this page to function properly.
Skip to main content
STA User Interface Guide, v1.0.2
E28380-03
Table of Contents Previous Next Index


Using STA to Answer Tape Environment Questions : Capacity and Resource Management Questions : ▼ Report Library Relative Activity Levels

Report Library Relative Activity Levels

This procedure addresses the questions, “Which library in my tape environment is the busiest? Which is the least busy?”

The definition of “busy” varies by site; common definitions include the number of exchanges, mounts, or dismounts. This procedure uses the number of mounts. In addition, it provides instructions for graphing the data so you can compare the libraries to one another and to the system average.

Referenced Tasks

1.

2.

3.

Note – Other columns you might want to sort by are “Enters (30 Days)”, “Ejects (30 Days)”, “Occupied Storage Cells”, or “MB R/W (30 Days)”.

4.
a.

A new graph pane, with the attribute “MB Read”, is added to the end of the Graphics Area display. You may need to scroll down to see the graph.

b.

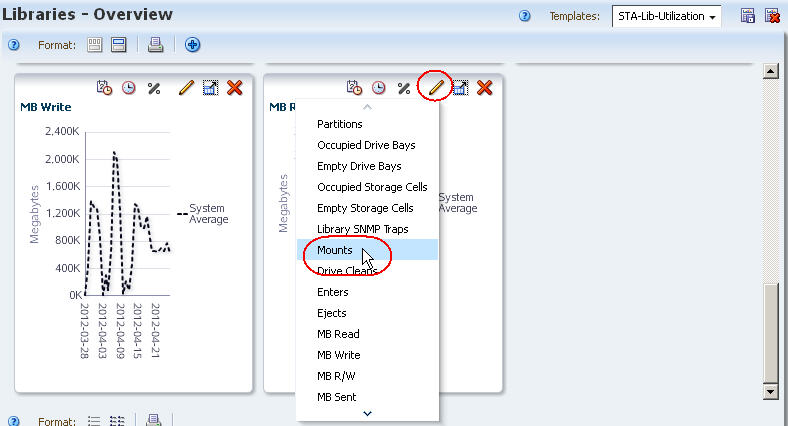
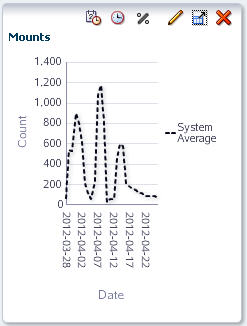
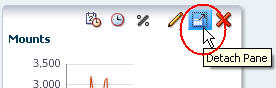
The graph is updated to display the system average for mount data.

5.

Adding the libraries to the graphs allows you to compare their attribute values against the system average.

a.
b.

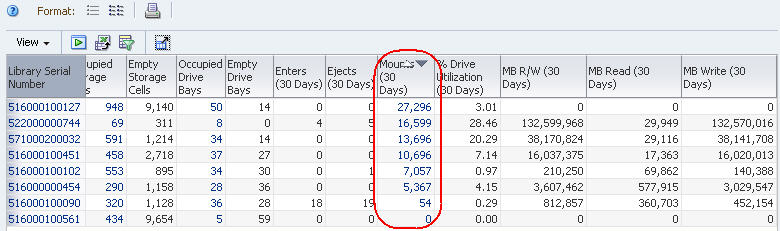
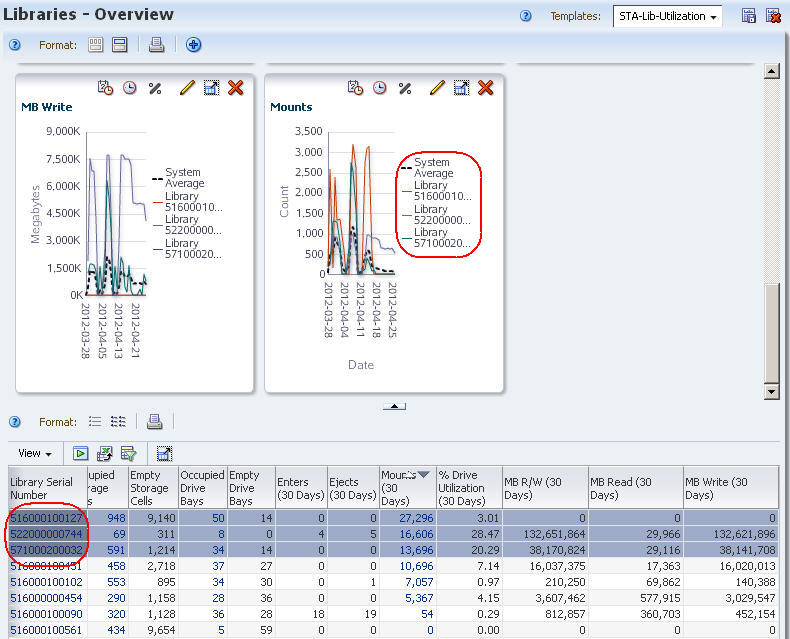
In the example below, the three libraries with most mounts are added to all the graphs.

6.


Table of Contents Previous Next Index Link to documentation
Copyright © 2012 Oracle and/or its affiliates. All rights reserved.