Exploring Clock-Profiling Data
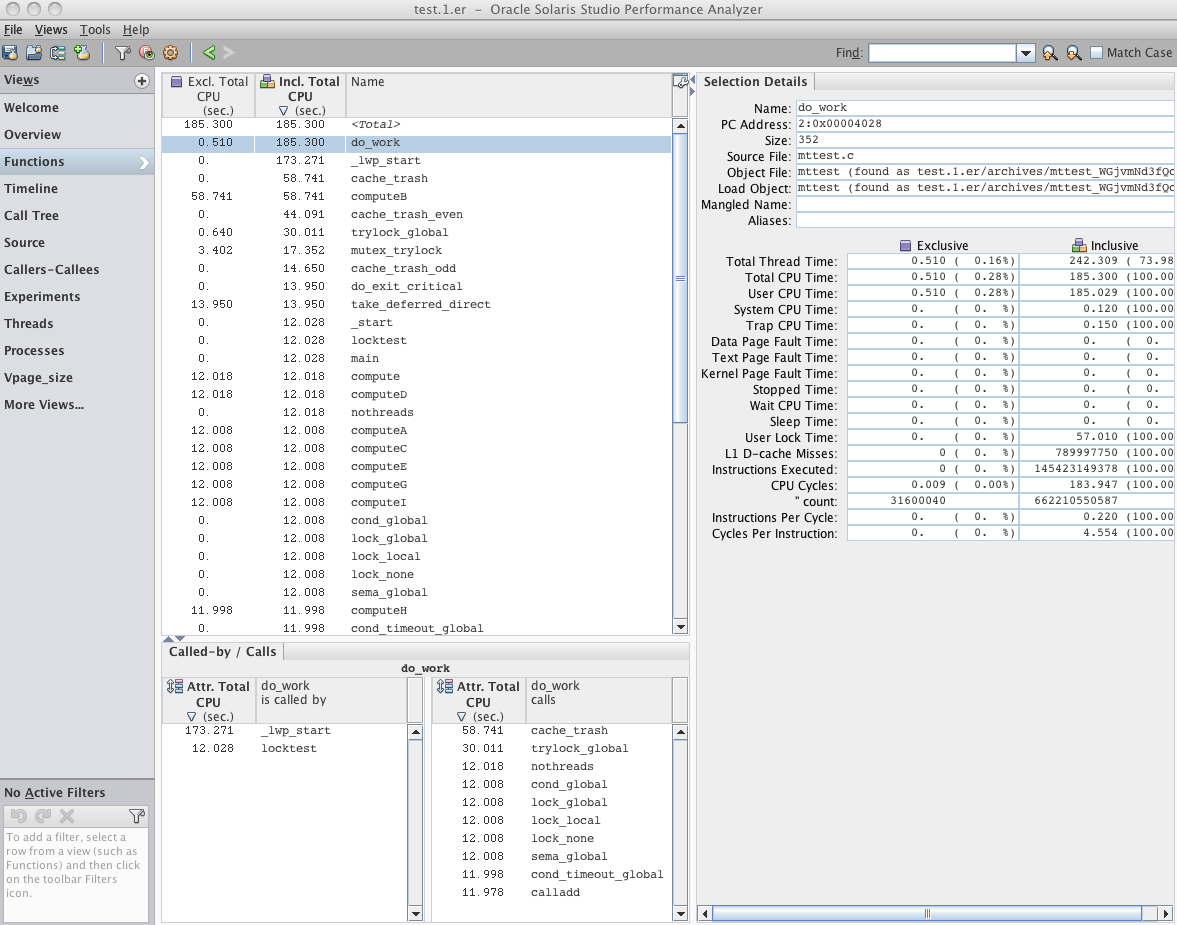
This section explores the clock profiling data using the Overview page and the Functions view with the Called-by/Calls panel.
-
In the Overview page, deselect the check boxes for three HW counter metrics, leaving only the Total CPU Time check boxes selected.
-
Go to the Functions view and click the column heading once for Incl. Total CPU to sort according to inclusive total CPU time.
The function do_work() should now be at the top of the list.

-
Select the do_work() function and look at the Called-by/Calls panel at the bottom of the Functions view.
Note that do_work() is called from two places, and it calls ten functions.
The ten functions that do_work() calls represent ten different tasks, each with a different synchronization method that the program executed. In some experiments created from mttest you might see an eleventh function which uses relatively little time to fetch the work blocks for the other tasks. This function is not shown in the screen shot.
Most often, do_work() is called when a thread to process the data is created, and is shown as called from _lwp_start(). In one case, do_work() calls one single-threaded task called nothreads() after being called from locktest().
In the Calls side of the panel, note that except for the first two of the callees, all callees show about the same amount of time (~12 seconds) of Attributed Total CPU.