Examining the Synchronization Tracing Experiment for mttest
This section shows how to explore the data in the experiments you created from the mttest sample code in the previous section.
Start Performance Analyzer from the mttest directory and load the first experiment as follows:
% analyzer test.1.er
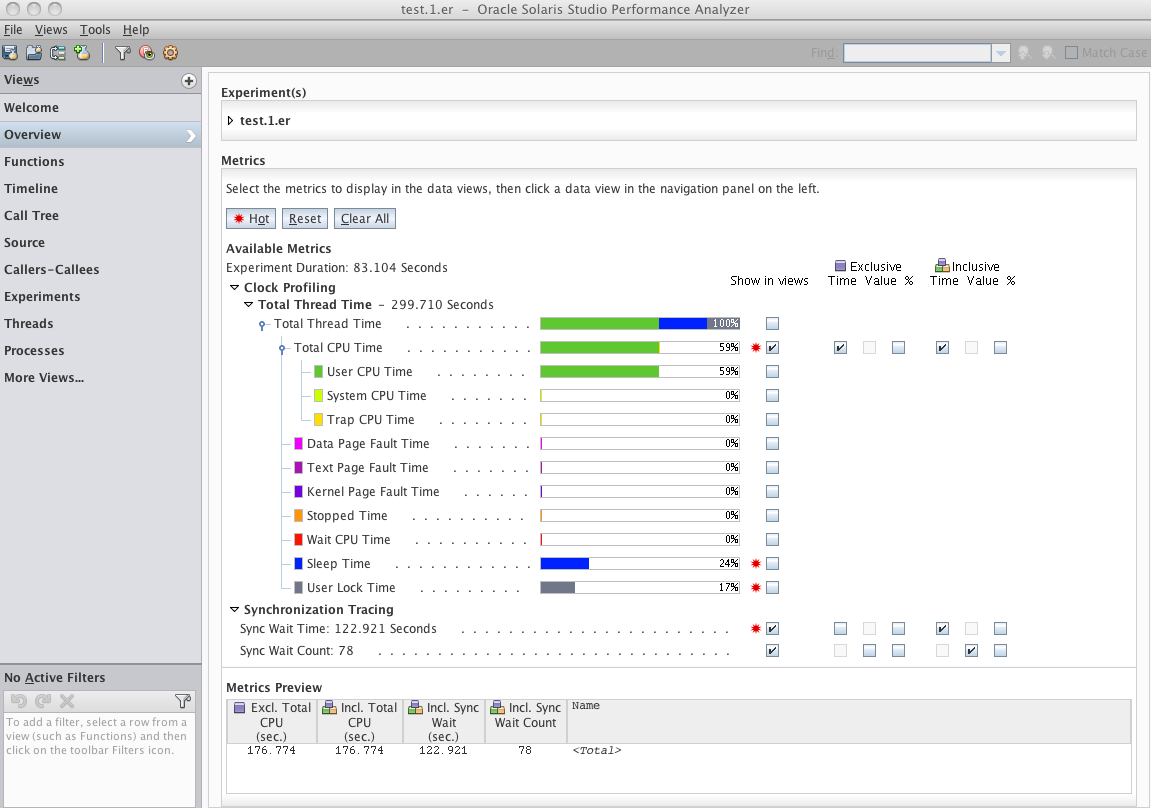
When the experiment opens, Performance Analyzer shows the Overview page.

Clock Profiling metrics are shown first and include colored bars. Most of the thread time is spent in User CPU Time. Some time is spent in Sleep Time or User Lock Time.
Synchronization Tracing metrics are shown in a second group that includes two metrics, Sync Wait Time and Sync Wait Count.
You can explore these metrics and their interpretation in the following sections of the tutorial.