JavaScript is required to for searching.
Skip Navigation Links
Exit Print View
Oracle® ZFS Storage Appliance Administration Guide
Oracle Technology Network
Library
PDF
Print View
Feedback
search filter icon
search icon

Document Information

Using This Documentation

Chapter 1 Oracle ZFS Storage Appliance Overview

Chapter 2 Status

Dashboard

Links

Usage

Storage

Memory

Services

Icons

Links

Hardware

Faults

Links

Activity

Graphs

Average

Vertical Scale

Weather

Recent Alerts

CLI

Running the Dashboard Continuously

Settings

Introduction

BUI

Layout

Thresholds

CLI

Tasks

BUI

Changing the Displayed Activity Statistics

Changing the Activity Thresholds

NDMP Status

NDMP Status - BUI

NDMP Status - Devices

NDMP Status - Recent Activity

NDMP Data State

NDMP Mover State

NDMP Status - CLI

Chapter 3 Initial Configuration

Chapter 4 Network Configuration

Chapter 5 Storage Configuration

Chapter 6 Storage Area Network Configuration

Chapter 7 User Configuration

Chapter 8 Setting ZFSSA Preferences

Chapter 9 Alert Configuration

Chapter 10 Cluster Configuration

Chapter 11 ZFSSA Services

Chapter 12 Shares, Projects, and Schema

Chapter 13 Replication

Chapter 14 Shadow Migration

Chapter 15 CLI Scripting

Chapter 16 Maintenance Workflows

Chapter 17 Integration

Index

BUI

Figure 2-6  Dashboard Settings

image:Dashboard settings

Layout

Use the layout tab to select the graphs that appear in the dashboard activity area, as defined in the following table.

Table 2-4  Status Layout Settings
Name
Units
Description
<empty>
-
No graph will be displayed in this location.
SMB
operations/sec
Average number of SMB operations.
CPU
utilization
Average cycles the appliance CPUs are busy. CPU cycles includes memory wait cycles.
Disk
operations/sec
Average number of operations to the physical storage devices.
HTTP
operations/sec
Average number of HTTP operations.
iSCSI
operations/sec
Average number of iSCSI operations.
FC
operations/sec
Average number of Fibre Channel operations.
Network
bytes/sec
Average bytes/sec across all physical network interfaces.
NDMP
bytes/sec
Average NDMP network bytes.
NFSv2
operations/sec
Average number of NFSv2 operations.
NFSv3
operations/sec
Average number of NFSv3 operations.
NFSv4
operations/sec
Average number of NFSv4 operations.
FTP
bytes/sec
Average number of FTP bytes.
SFTP
bytes/sec
Average number of SFTP bytes.

Note that to reduce the network traffic required to refresh the Dashboard, configure some of the activity graphs as "<empty>".

Thresholds

Use the Thresholds screen to configure the dashboard activity weather icons. The defaults provided are based on heavy workloads, and may not be suitable for your environment.

Figure 2-7  Dashboard Activity Settings
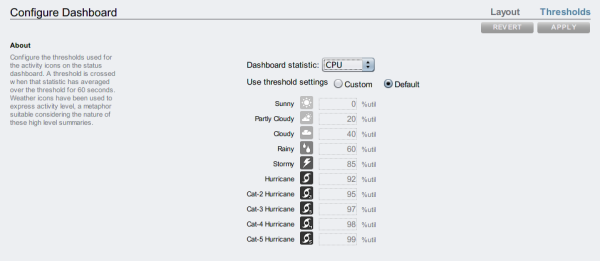
image:Dashboard Activity Settings

The weather icon that appears on the Dashboard is closest to the threshold value setting for the current activity - measured as a 60 second average. For example, if CPU utilization was at 41%, by default, the Cloudy weather icon would appear because its threshold is 40% (closest to the actual activity). Select the Custom radio button to configure thresholds and be sure to configure them in the order they appear on the screen.