| Oracle® Argus Mart Installation and Administration Guide Release 7.0.3 E48402-01 |
|


 Previous |
 Next |
| Oracle® Argus Mart Installation and Administration Guide Release 7.0.3 E48402-01 |
|
Previous |
Next |
This chapter describes the steps required to run the Extract, Transform, and Load (ETL) process using the Oracle Data Integrator (ODI) Studio and ODI Console.
The following table illustrates some of the terms along with the name of the Load Plan that has been used to refer the different types of ETL in the later sections of this chapter:
Table 8-1 Describing ETL Types
| Type of ETL | Description | Name of the Load Plan |
|---|---|---|
|
Initial ETL |
The Initial ETL process involves full load of data from Argus Safety and DLP to Argus Mart. It can be described as the first ETL run that is executed for a fresh setup. |
LP_INI_AM |
|
Incremental ETL |
The Incremental ETL brings changed case data, from last ETL run till start of current ETL run, from Argus Safety and DLP. The LM/CFG data is reloaded only if any change in record(s) is identified. Dictionary data is always reloaded in case of an Incremental ETL. If a new enterprise is added, the Incremental ETL loads complete data of the new enterprise along with delta data of other enterprises. |
LP_INC_AM |
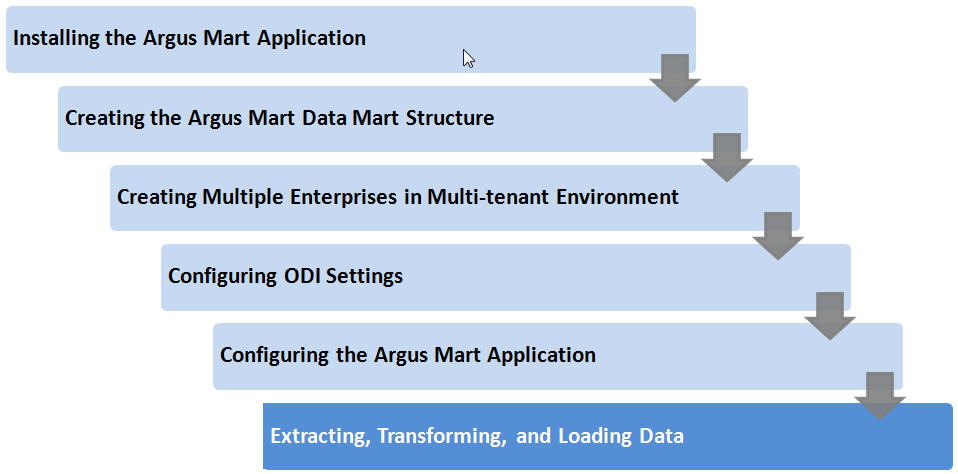
The following figure depicts your progress in the complete installation process:
This chapter comprises the following sub-sections:
This section describes the steps required to manage the ETL process using the Database Integrator Studio.
This section comprises the following sub-sections:
To run the Initial ETL, execute the following steps:
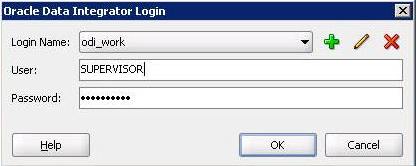
Open the ODI Studio, and click Connect to Repository. This displays the Oracle Data Integrator Login window, as depicted in the following figure:
In the Oracle Data Integrator Login window:
Select the ODI Work Repository name from the Login Name drop-down list.
Enter the name of the ODI user in the User field.
Enter the password for the ODI user in the Password field. The password for the SUPERVISOR user was specified by you in the Creating Master Repository section while configuring the ODI settings.
Click OK. This displays the Oracle Data Integrator Screen.
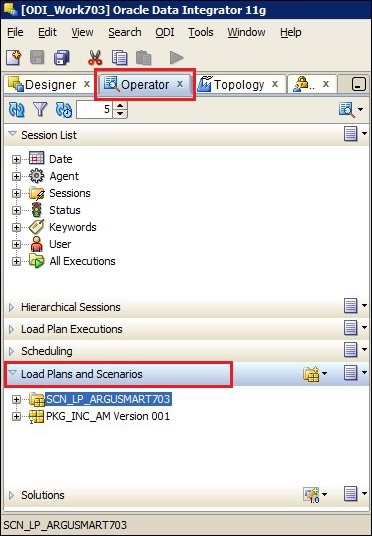
Select the Operator tab in the left pane.
Expand the Load Plans and Scenarios section, as highlighted in the following figure:
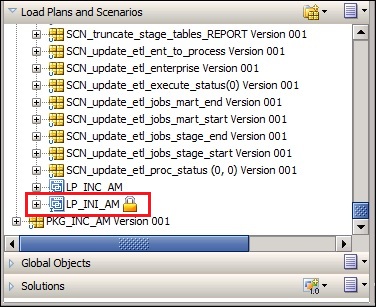
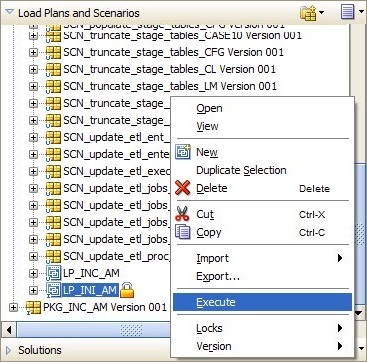
Expand SCN_LP_ARGUSMART703 and scroll-down to LP_INI_AM. This option in this section represents the load plan for the initial ETL process for Argus Mart.
Right-click the LP_INI_AM option. This displays a menu, as shown in the following figure:
Click Execute. This displays the Start Load Plan window, as shown in the following figure:
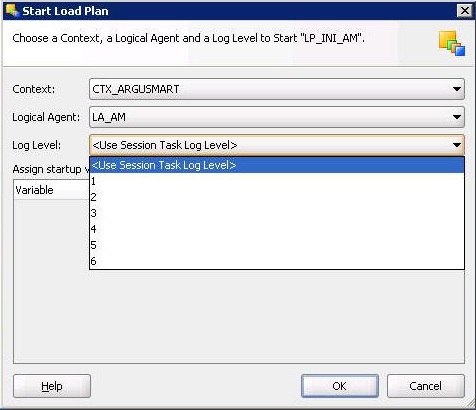
In the Start Load Plan window:
Select CTX_ARGUSMART from the Context drop-down list.
Select LA_AM from the Logical Agent drop-down list.
Select the desired log level from the Log Level drop-down list.
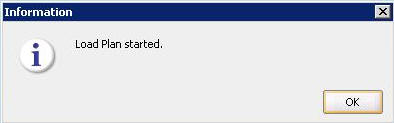
Click OK. This displays the Information dialog box with the Load Plan Started confirmation message, as shown in the following figure:
Click OK.
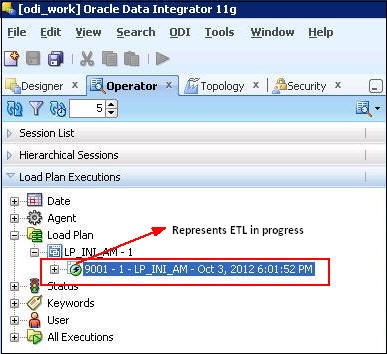
You can verify the status of the ETL process by navigating to the Load Plan Executions section and expanding the Load Plan folder. You can view the status of the Load Plan in Green color with tilted s, which signifies that the ETL session is in progress, as highlighted in the following figure:
To stop the initial ETL, execute the following steps:
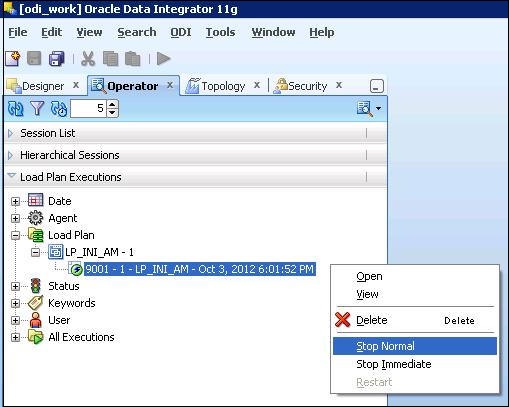
Right-click the Load Plan, which you want to stop, in the Load Plan folder of the Load Plan Executions section. This displays a menu, as shown in the following figure:
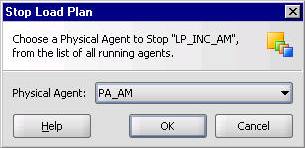
Select Stop Normal. This displays the Stop Load Plan dialog box, as depicted in the following figure:
Select PA_AM from the Physical Agent drop-down list.
Click OK. This stops the execution of the Load Plan.
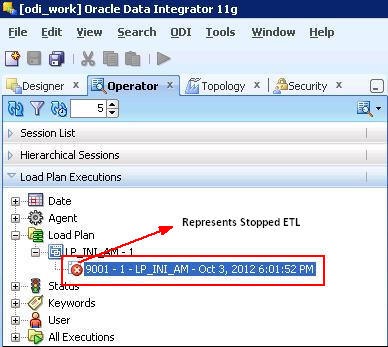
You can verify the status of the ETL process by navigating to the Load Plan Executions section and expanding the Load Plan folder. You can view the status of the Load Plan in Red color with the X symbol, which signifies that the ETL session is not in progress, as highlighted in the following figure:
|
Note: You must verify in Argus Mart database if the ETL session has been successfully ended after this step. |
Restarting the Initial ETL process enables you to start the ETL process from the last execution step where it was stopped or failed.
To restart the Initial ETL, execute the following steps:
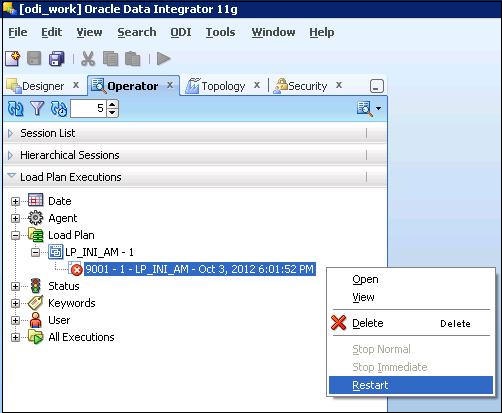
Right-click the Load Plan, which you want to restart, in the Load Plan folder of the Load Plan Executions section. This displays a menu, as shown in the following figure:
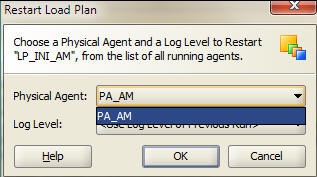
Click Restart. This displays the Restart Load Plan dialog box, as shown in the following figure:
Select PA_AM from the Physical Agent drop-down list.
Select the required log level from the Log Level drop-down list.
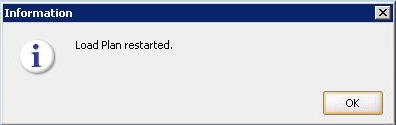
Click OK. This displays the Information dialog box with the Load Plan restarted message, as depicted in the following figure:
Click OK.
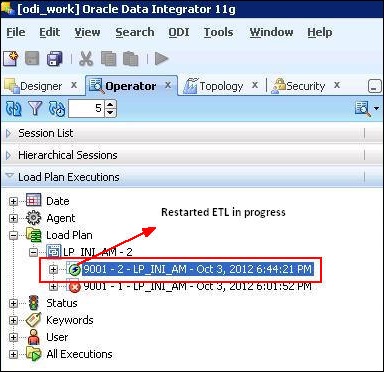
This adds another Load Plan, with the same name as that of the stopped ETL, in the Load Plan folder of the Load Plan Executions section. However, this instance of the ETL Process is in Green color with a tilted S, which signifies that the ETL is in progress, as highlighted in the following figure:
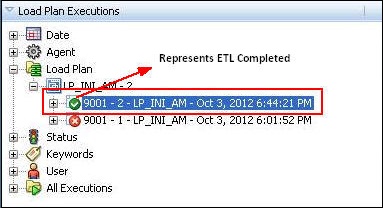
Once the ETL process is complete, the Load Plan is displayed in Green color with a completed symbol, as highlighted in the following figure:
If an ETL process fails, you have the option of continuing the process from the failed step or executing it again from the beginning of ETL.
This section explains the steps to continue a failed ETL from the failed step and to execute it again from the beginning of ETL.
This section comprises the following sub-sections:
The process to continue the failed Initial ETL from the failed step is exactly the same as that of the process of restarting the Initial ETL after stopping it.
See the Restarting the ETL section for the step-by-step procedure to continue the failed Initial ETL from the failed step.
The process to restart the failed Initial ETL from the beginning is exactly the same as that of the process of running the Initial ETL.
However, before restarting the ETL you must log on to the Oracle SQL Developer using the Argus ETL User credentials and execute the following statements:
EXEC pkg_sm_stage_util.p_set_cmn_profile_value ('DATABASE', 'ODI_ETL_STATUS', '0');EXEC pkg_sm_stage_util.p_set_cmn_profile_value ('DATABASE', 'ETL_SM_ITERATION_NUMBER', NULL);
COMMIT;
To verify the successful execution of these statements, you can execute the following Select statements:
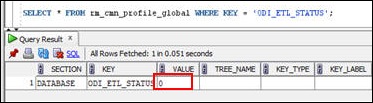
SELECT * FROM rm_cmn_profile_global WHERE KEY = 'ODI_ETL_STATUS';
The entry for the Value column must be 0 after executing this statement, as depicted in the following figure:
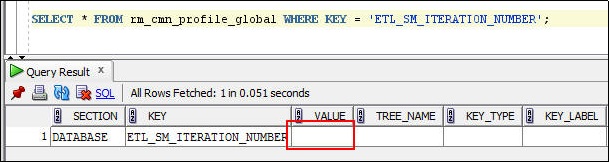
SELECT * FROM rm_cmn_profile_global WHERE KEY = 'ETL_SM_ITERATION_NUMBER';
The entry for the Value column must be blank after executing this statement, as depicted in the following figure:
See the Running the ETL section for the step-by-step procedure to restart the failed Initial ETL from the beginning of ETL.
This section describes the steps required to monitor the ETL process using the Database Integrator Studio.
This section comprises the following sub-sections:
Before executing the Initial ETL, you can view the steps of the Load Plan for the Initial and the Incremental ETL.
To view the Load Plan steps, execute the following steps:
Open the Oracle Data Integrator Studio and click Connect To Repository.
Log on to the ODI Work Repository using the ODI User credentials.
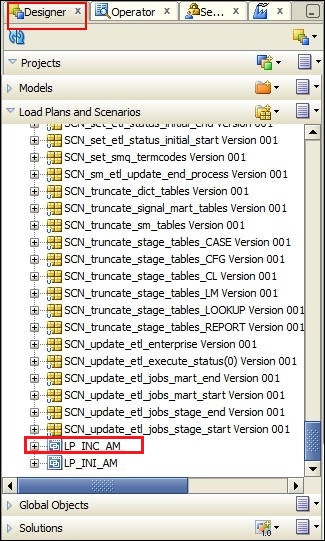
Select the Designer tab and expand the Load Plans and Scenarios section, as shown in the following figure:
Double-click the LP_INC_AM load plan.
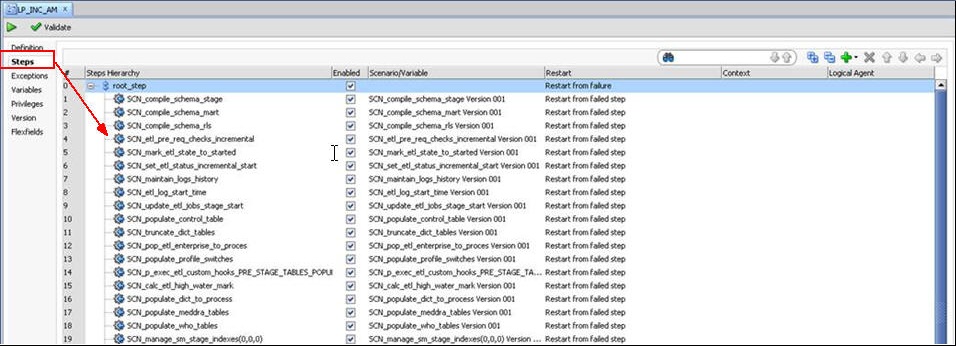
Select the Steps option in the right pane. This displays all the steps of the Load Plan, as depicted in the following figure:
Similarly, you can also view the steps for the Incremental Load Plan by double-clicking the LP_INC_AM Load Plan from the Load Plans and Scenarios section of the Designer tab.
To monitor the progress of the Initial ETL after executing the LP_INI_AM Load Plan, execute the following steps:
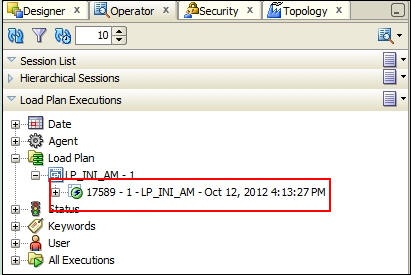
Select the Operator tab and expand the Load Plan folder in the Load Plan Executions section.
Expand the LP_INI_AM load plan to view the ETL process in progress. You can view a tilted s in Green color, which signifies that the process is running properly, as depicted in the following figure:
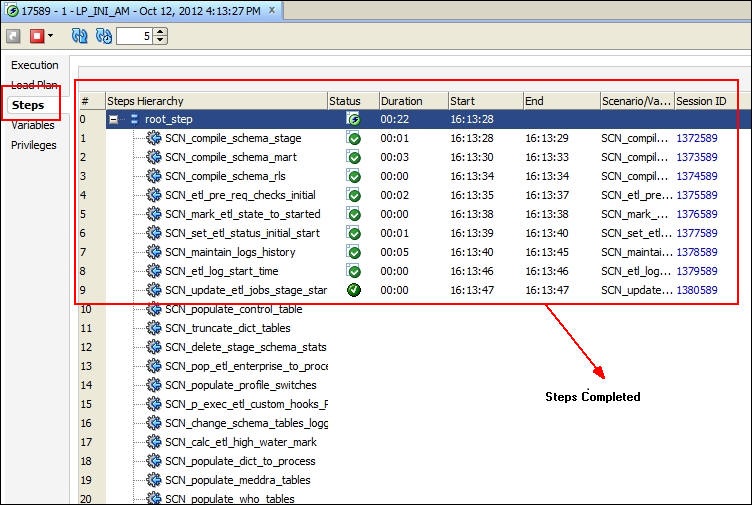
Double-click the ETL session, highlighted in the figure above, and select Steps in the right pane. This displays the list of steps for the Load Plan. It also displays the steps that have been completed successfully, as depicted in the following figure:
You can view the step where the ETL process failed and also view the error message related to the ETL process failure, using the following procedure:
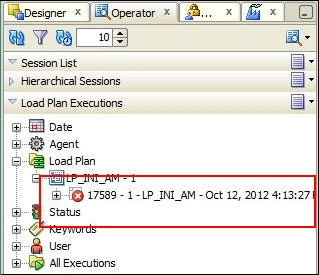
In the Operator tab, expand the Load Plan folder in the Load Plan Executions section to view the current status of the ETL process, as shown in the following figure:
You can view the status of the Load Plan in Red color with the X symbol, which signifies that the ETL session is not in progress.
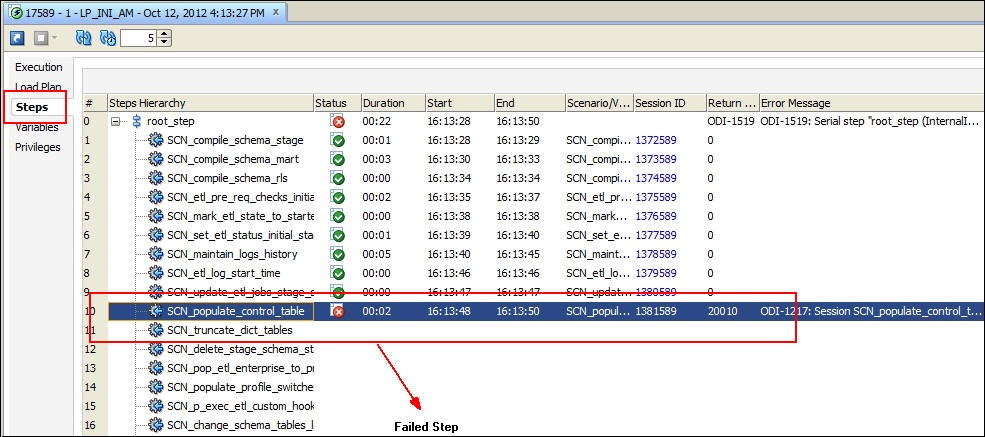
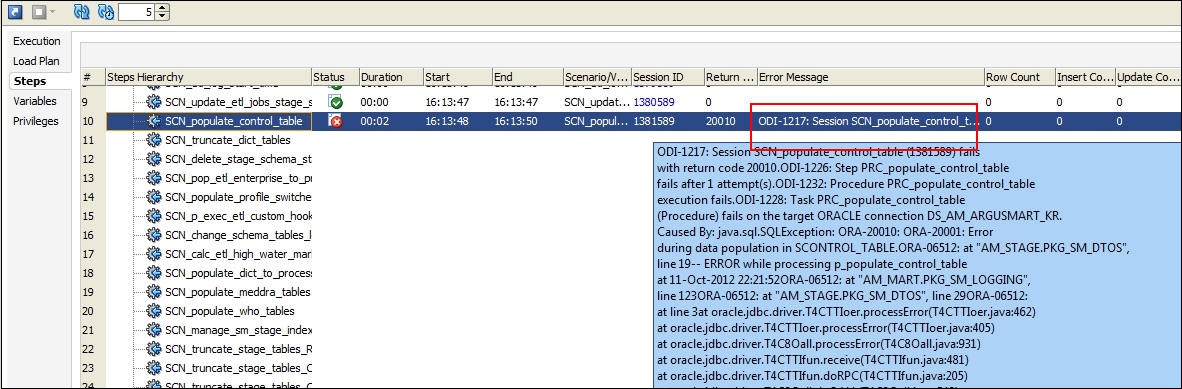
Double-click the Load Plan and select Steps. This displays the list of steps for the Load Plan in the right pane. The step because of which the ETL process has failed, is highlighted in Red color with the X symbol, as highlighted in the following figure:
You can move the mouse cursor over the error message to view the complete message, as shown in the following figure:
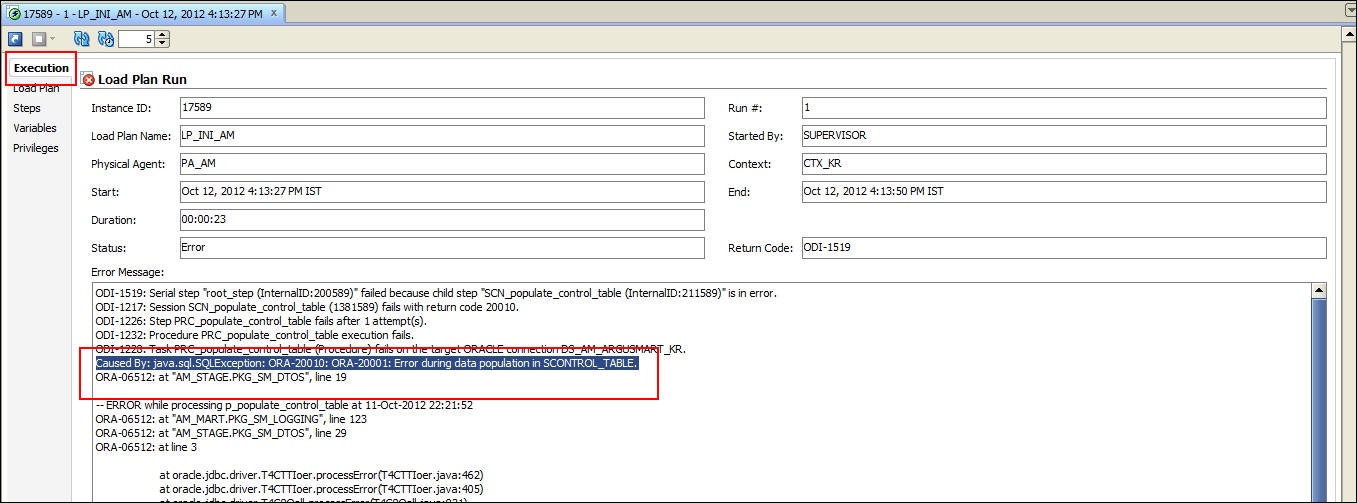
You can also select Execution for more information about the error message, as depicted in the following figure:
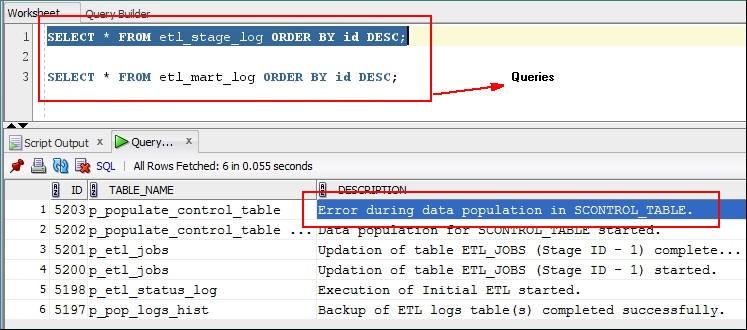
You can also log on to the Oracle SQL Developer using the Argus ETL user credentials and execute the queries to view the error message, as shown in the following figure:
The following are the queries that you can use to view the location of the error:
SELECT * FROM etl_stage_log ORDER BY id DESC;
If you are not able to view any error message after executing this query, you can execute the query mentioned in point 2.
SELECT * FROM etl_mart_log ORDER BY id DESC;
Once you have restarted a stopped ETL process, you can view the status of the process using the following procedure:
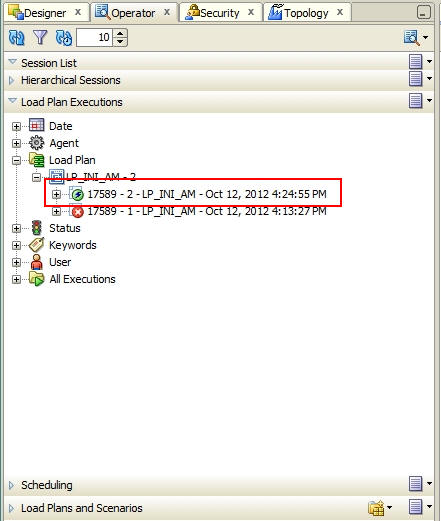
In the Operator tab, expand the Load Plan folder in the Load Plan Executions section to view the current status of the ETL process, as shown in the following figure:
This restarted ETL Process is in Green color with a tilted s, which signifies that the ETL is in progress again.
You can view the status of the remaining steps in the process by double-clicking the Load Plan in the LP_INI_AM folder and selecting Steps, as depicted in the following figure:
This section describes the steps required to manage the ETL process using the Database Integrator Console.
This section comprises the following sub-sections:
To run the Initial ETL, execute the following steps:
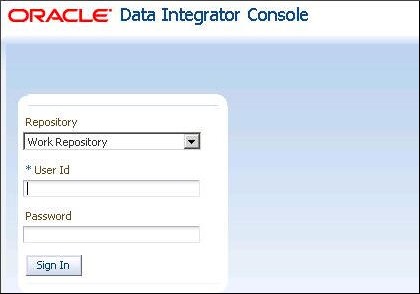
Open the ODI Console. This displays the Oracle Data Integrator Console Sign In window, as depicted in the following figure:
In the Oracle Data Integrator Sign In window:
Select the ODI Work Repository name from the Repository drop-down list.
Enter the name of the ODI user in the User Id field.
Enter the password for the ODI user in the Password field.
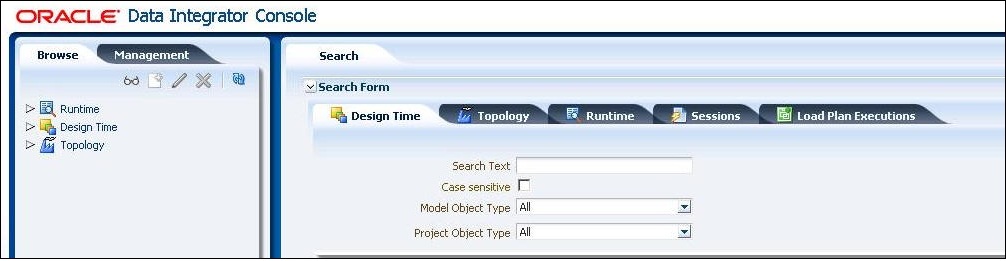
Click Sign In. This displays the Oracle Data Integrator Console Screen, as shown in the following figure:
Select the Management tab in the left pane.
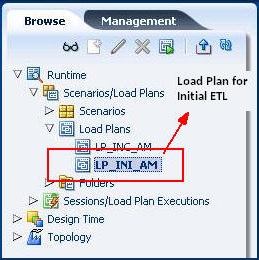
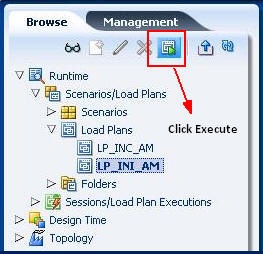
Expand the Runtime folder and navigate to Runtime > Scenarios/Load Plans > LP_INI_AM, as highlighted in the following figure:
The LP_INI_AM option in this section represents the load plan for the initial ETL process for Argus Mart.
Click Execute, as highlighted in the following figure:
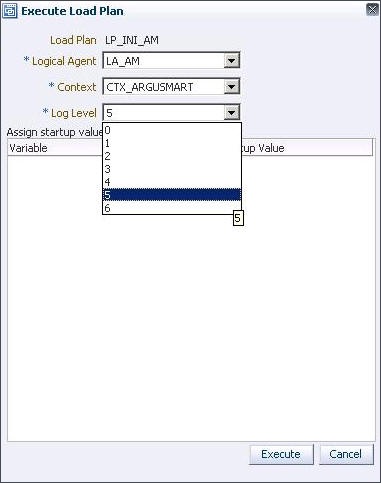
This displays the Execute Load Plan window, as shown in the following figure:
In the Execute Load Plan window:
Select LA_AM from the Logical Agent drop-down list.
Select CTX_ARGUSMART from the Context drop-down list.
Select the desired log level from the Log Level drop-down list.
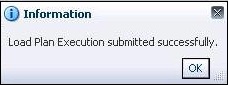
Click Execute. This displays the Information dialog box with the Load Plan Execution submitted successfully confirmation message, as shown in the following figure:
Click OK.
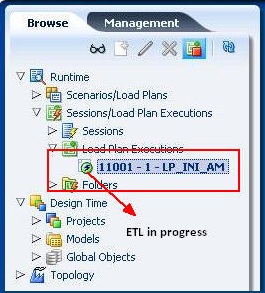
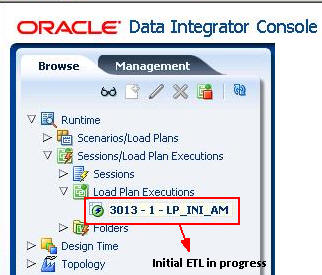
You can verify the status of the ETL process by expanding the Load Plan Executions folder in the Sessions/Load Plan Executions section. You can view the status of the Load Plan in Green color with tilted s, which signifies that the ETL session is in progress, as highlighted in the following figure:
To stop the initial ETL, execute the following steps:
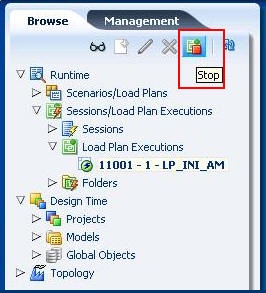
Select the Load Plan, which you want to stop, by expanding the Load Plan Executions folder of the Sessions/Load Plan Executions section and click Stop, as shown in the following figure:
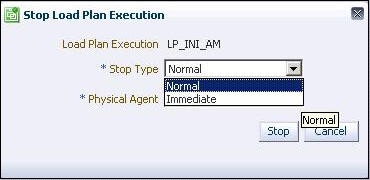
This displays the Stop Load Plan Execution dialog box, as depicted in the following figure:
Select Normal from the Stop Type drop-down list.
Select OracleDIAgent from the Physical Agent drop-down list.
Click Stop. This displays the Information dialog box with the Load Plan was Stopped Successfully confirmation message, as depicted in the following figure:
Click OK.
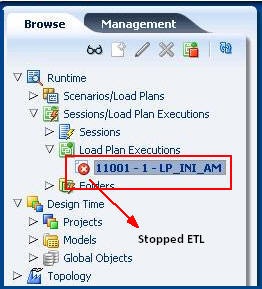
You can verify the status of the ETL process by navigating to the Load Plan Executions folder in the Sessions/Load Plan Executions section. You can view the status of the Load Plan in Red color with the X symbol, which signifies that the ETL session is not in progress, as highlighted in the following figure:
|
Note: You must verify in Argus Mart database if the ETL session has been successfully ended after this step. |
Restarting the Initial ETL process enables you to start the ETL process from the last execution step where it was stopped or failed.
To restart the Initial ETL, execute the following steps:
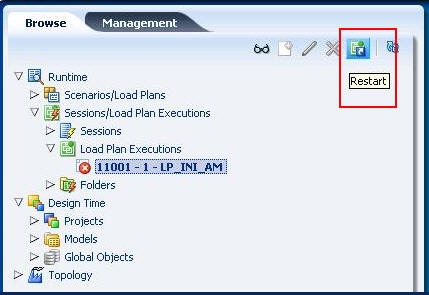
Select the Load Plan, which you want to restart, in the Load Plan Executions folder of the Sessions/Load Plan Executions section and click Restart, as shown in the following figure:
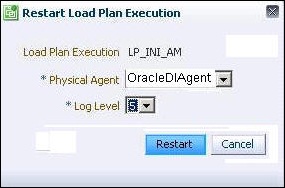
This displays the Restart Load Plan Execution dialog box, as depicted in the following figure:
Select OracleDIAgent from the Physical Agent drop-down list.
Select the required log level from the Log Level drop-down list.
Click Restart. This displays the Information dialog box with the Load Plan restarted message, as depicted in the following figure:
Click OK.
This adds another Load Plan, with the same name as that of the stopped ETL, in the Load Plan Executions folder of the Sessions/Load Plan Executions section. However, this instance of the Load plan is in Green color with a tilted S, which signifies that the ETL is in progress.
If an ETL process fails, you have the option of continuing the process from the failed step or executing it again from the beginning of ETL.
This section explains the steps to continue a failed ETL from the failed step and to execute it again from the beginning of ETL.
This section comprises the following sub-sections:
The process to continue the failed Initial ETL from the failed step is exactly the same as that of the process of restarting the Initial ETL after stopping it.
See the Restarting the ETL section for the step-by-step procedure to continue the failed Initial ETL from the failed step.
The process to restart the failed Initial ETL from the beginning is exactly the same as that of the process of running the Initial ETL.
However, you need to execute certain steps before restarting the Failed Initial ETL, refer to the Restarting the Failed Initial ETL section for the complete details.
See the Running the ETL section for the step-by-step procedure to restart the failed Initial ETL from the beginning of ETL.
This section describes the steps required to monitor the ETL process using the Database Integrator Console.
This section comprises the following sub-sections:
Before executing the Initial ETL, you can view the steps of the Load Plan for the Initial and the Incremental ETL.
To view the steps of Load Plan, execute the following steps:
Log on the Oracle Data Integrator Console and select the Management tab.
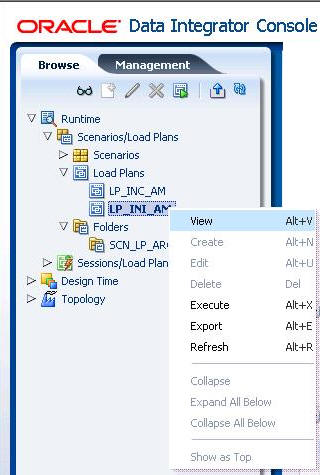
Navigate to Runtime > Scenarios/Load Plans > Load Plans.
Right-click LP_INI_AM (Load Plan for Initial ETL) or LP_INC_AM (Load Plan for Incremental ETL) and select View, as shown in the following figure:
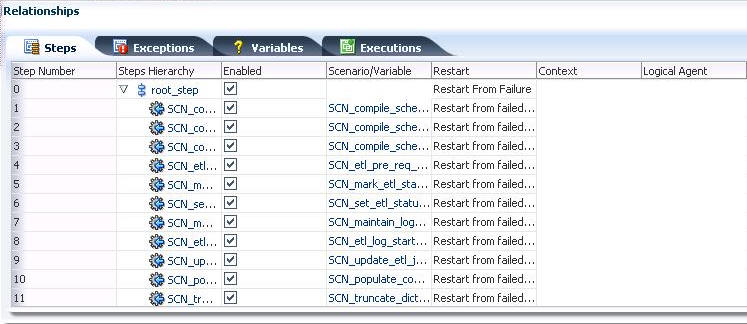
This displays the steps for the Load Plan in the Relationships section in the right pane, as depicted in the following figure:
To monitor the progress of the initial ETL after executing the LP_INI_AM Load Plan, execute the following steps:
Select the Management tab and navigate to Runtime > Sessions/Load Plan Executions > Load Plan Executions.
You can view a tilted s in Green color, which signifies that the ETL process is running properly, as depicted in the following figure:
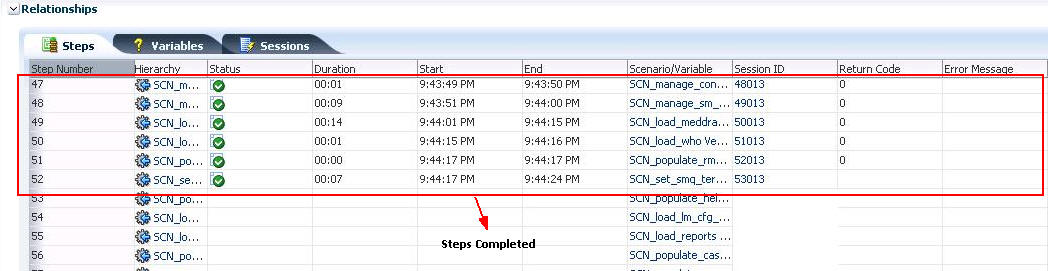
Double-click the session to view the list of steps in the Relationships section in the right pane. It also displays the list of steps that have been completed, as depicted in the following figure:
You can view the step where the ETL process failed and also view the error message related to the ETL process failure, using the following procedure:
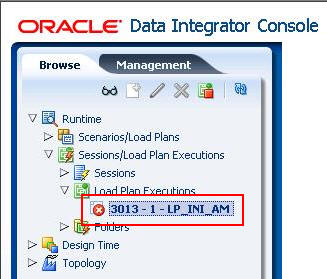
In the Management tab, navigate to Runtime > Sessions/Load Plan Executions > Load Plan Executions, to view the current status of the ETL process, as shown in the following figure:
You can view the status of the Load Plan in Red color with the X symbol, which signifies that the ETL session is not in progress.
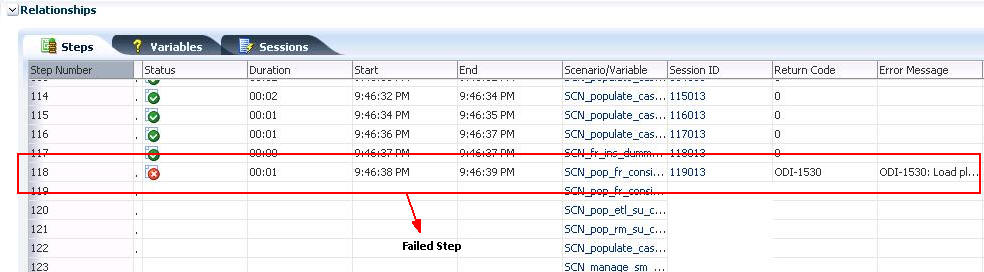
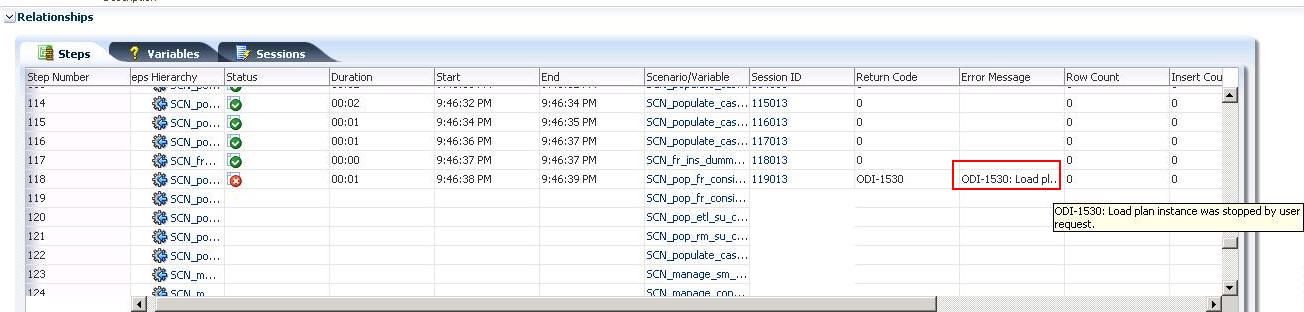
Double-click the Load Plan. This displays the list of steps for the Load Plan in the Relationship section in the right pane. The step because of which the ETL process has failed, is highlighted in Red color with the X symbol, as highlighted in the following figure:
You can move the mouse cursor over the error message to view the complete message, as shown in the following figure:
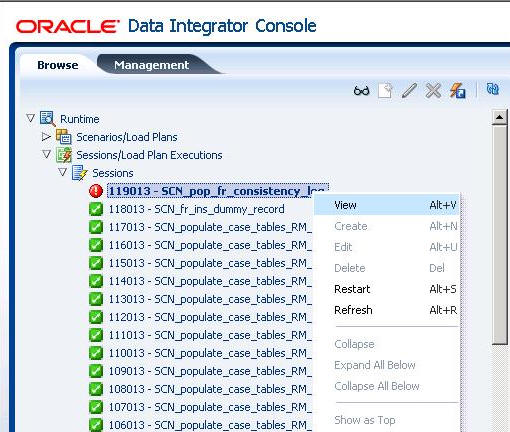
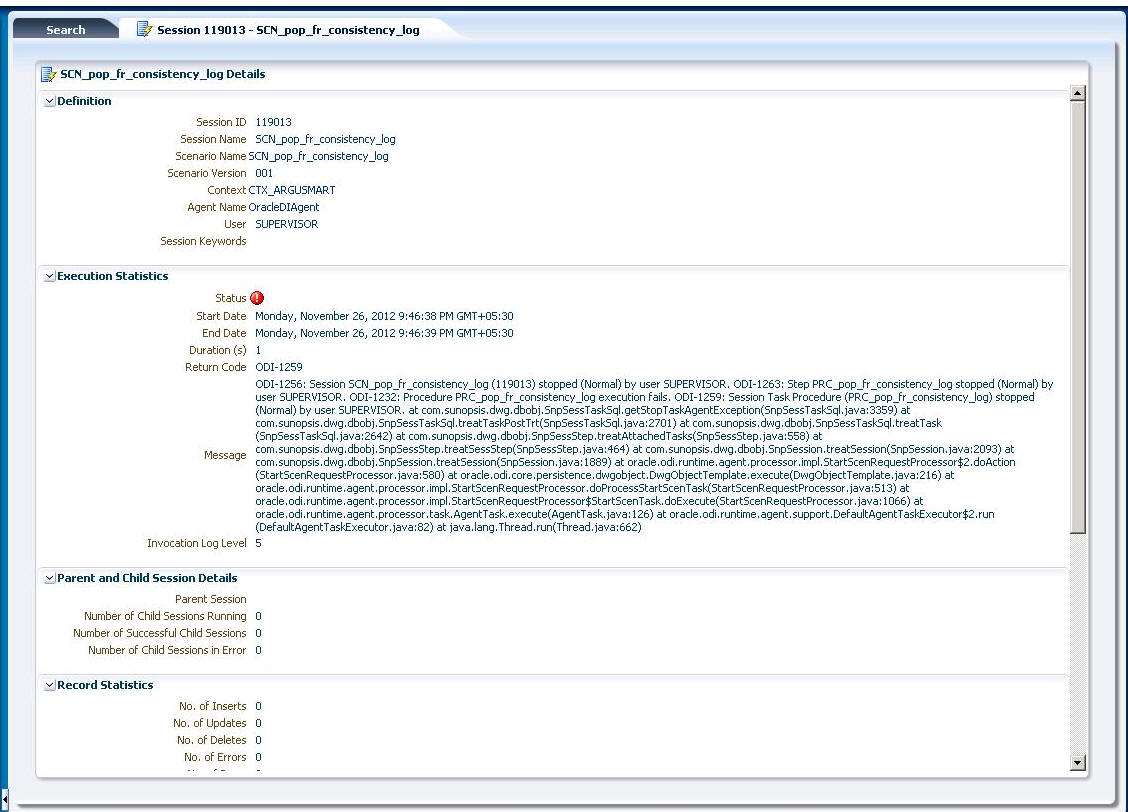
You can also navigate to Runtime > Sessions/Load Plan Executions > Sessions, right-click the stopped session, highlighted in Red color with the ! symbol, and select View, as depicted in the following figure:
This displays the error details in the right pane, as depicted in the following figure:
You can also log on to the Oracle SQL Developer using the Argus ETL user credentials and execute the queries to view the error message, as shown in the following figure:
The following are the queries that you can use to view the location of the error:
SELECT * FROM etl_stage_log ORDER BY id DESC;
If you are not able to view any error message after executing this query, you can execute the query mentioned in point 2.
SELECT * FROM etl_mart_log ORDER BY id DESC;
Once you have restarted a stopped ETL process, you can view the status of the process using the following procedure:
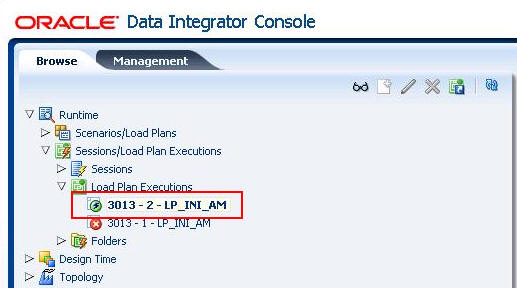
In the Management tab, navigate to Runtime > Sessions/Load Plan Executions > Load Plan Executions section, to view the current status of the ETL process, as shown in the following figure:
This restarted ETL Process is in Green color with a tilted s, which signifies that the ETL is in progress again.
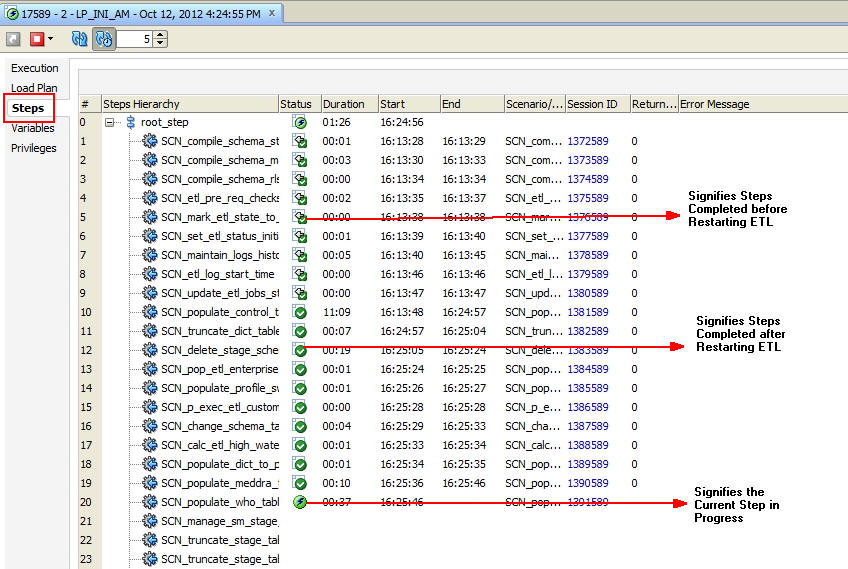
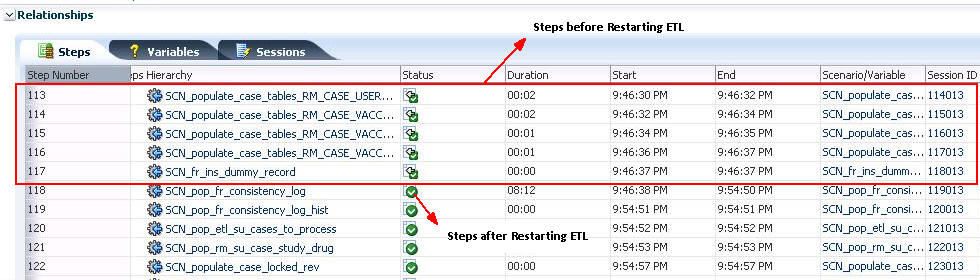
You can view the status of the steps completed before restarting the ETL and the steps after restarting the ETL, by double-clicking the session in progress.
The steps display in the Relationship section in the right pane, as depicted in the following figure:
For step-by-step information related to the Incremental ETL tasks such as Running, Stopping, and Restarting the Incremental ETL through:
ODI Studio, see Section 12.3, "Managing Incremental ETL Process"
ODI Console, see Section 13.3, "Managing Incremental ETL Process"
|
 Copyright © 2011, 2013, Oracle and/or its affiliates. All rights reserved. Legal Notices |
|