Release 1.2
Part Number E36379-01
Contents
Previous
Next
| Oracle Pedigree and Serialization Manager Process Guide Release 1.2 Part Number E36379-01 | Contents | Previous | Next |
The Operations Dashboard in Oracle Pedigree and Serialization Manager (OPSM) provides you with information to support your day-to-day activities that occur in OPSM. The Operations Dashboard contains four different components. These components are:
Location Details
Displays a summary view of how many serials have been imported, generated, shipped, and returned by location for a given date range.
Transaction Exceptions
Displays a summary view of transaction exceptions by location and transaction type for a given date range.
Counterfeit Serials Analysis
Displays a summary view of the total number of suspect counterfeit, verified not counterfeit, or counterfeit serials by either product or location for a given date range.
Serial Range Management
Displays a summary view of serial ranges with a count showing how many ranges by location are within their critical or at-risk thresholds. These serial ranges also include ranges nearing exhaustion, as well as, ranges that are nearing their effective end date expiration.
This chapter covers the following topics:
Use the Location Details component of the Operations Dashboard to view a summary of the total number of serials that were imported, generated, shipped, returned, reserved, commissioned, decommissioned, and edited by location within Oracle Pedigree and Serialization Manager (OPSM) for a given date range.
From the Location Details component you can access the Location Details page where you can view:
More detailed information for each location.
Shipments and returns transaction metric for each location.
Pie graphs displaying the breakdown of shipments and returns by ship to (for shipments) and ship from (for returns).
Location details in a geographic map format using the Location Details Map page.
Use these procedures to view location details:
Prerequisites
For information on setting up locations, see Maintaining Locations.
To View Location Detail Summary Information
Navigate to the Operations Dashboard.
Navigate to the Location Details component.
Location Details component (Transaction Activity of Last 365 Days Selected)
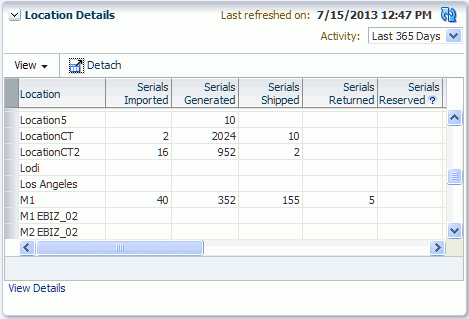
The Location Details component appears displaying in a table format each location and the total number of Serials Imported, Serials Generated, Serials Shipped, Serials Returned, Serials Reserved, Serials Commissioned, Serials Decommissioned, and Serials Edited for those locations within the last thirty days.
Last 30 Days appears in the Transactions Activity field by default.
At the top of the Location Details component appears the date and time the component was last refreshed and the Refresh Dashboard Component icon.
At the bottom of the Location Details component appears the View Details link, which is used to access the Location Details page.
(Optional) Refresh the information that appears in the Location Details component by clicking the Refresh Dashboard Component icon.
The Location Details component is refreshed and displays the most current information. The "Last refreshed on" field is updated with the current date and time.
(Optional) Change the transaction date range for the Location Details component by selecting another date range using the Transactions Activity field. Transaction Activities are:
Last 7 Days
Last 30 Days
Appears by default.
Last 60 Days
Last 90 Days
Last 365 Days
The Location Details component is refreshed and displays the location details for the date range selected.
To View Location Details (Table View)
Navigate to the Location Details component within the Operations Dashboard.
Click the View Details link at the bottom of the Location Details component.
Location Details page
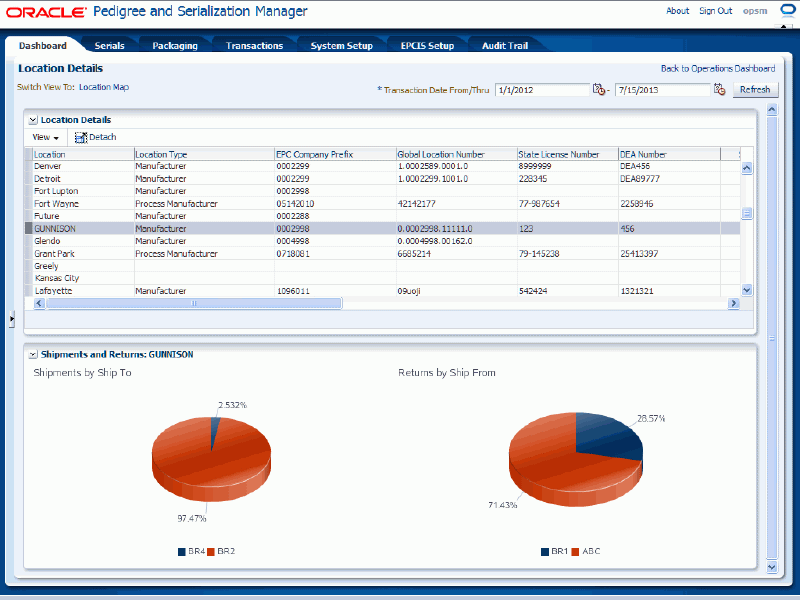
The Location Details page appears displaying two regions. The Location Details region and the Shipments and Returns region. Plus, the system populates the actual dates in the Transaction Date From and Thru fields from the Transactions Activity value entered previously.
The Location Details region displays each location and the total number of Serials Imported, Serials Generated, Serials Shipped, Serials Returned, Serials Reserved, Serials Commissioned, Serials Decommissioned, and Serials Edited for those locations in a table format. In addition, this table provides a few more details (Location Type, EPC Company Prefix, Global Location Number, State License Number, and DEA Number) for each location.
The Shipments and Returns region displays pie graphs that depict the shipment and return transaction activity for the location that is selected in the Location Details region. If no shipment or return transaction activity exists a blank circle appears in the region stating "No Data to Display".
(Optional) Hover over the different sections in the pie graph to view details for that location.
A text box appears displaying the name (ship from or ship to) and the total number of shipment and returns.
(Optional) View the Shipments and Returns pie graphs for another location by selecting a different location in the Location Details region.
The Shipment and Returns region is refreshed and displays the pie graphs for the location selected in the Location Details region.
(Optional) Change the transaction date range by selecting a different date range using the Transaction Date From and Transaction Date Thru fields and then click the Refresh button.
The Location Details page is refreshed and displays the information for the new date range.
To return to the main Operations Dashboard page, click the Back to Operations Dashboard link in the upper right corner of the Location Details page.
To View Location Details (Map View)
Navigate to the Location Details component within the Operations Dashboard.
Click the View Details link at the bottom of the Location Details component.
The Location Details page appears.
Click the Location Map link in the Switch View To field at the top of the page.
Location Details Map page
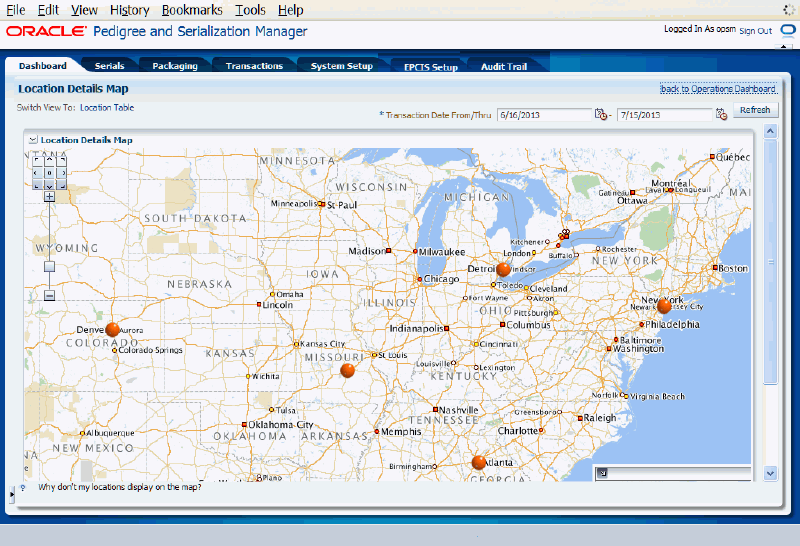
The Location Details Map page appears displaying location data points in a geographic map.
Note: For the geographic map functionality to work correctly you must have specified the longitude and latitude for each location using the Maintain Locations page.
For information on setting up locations, see Maintaining Locations.
(Optional) View basic location information by clicking a location data point on the map.
The Location Details dialog box appears displaying basic information including total number of serials that were imported, generated, shipped, returned, reserved, commissioned, decommissioned, and edited.
Click the OK button to close the dialog box.
(Optional) Navigate within the map by using the Pan and Zoom In and Out buttons provided in the map. You can also use the drag and drop functionality to move around the map view.
Return to the Location table view by clicking the Location Table link in the Switch View To field or you can return to the main Operations Dashboard page by clicking the Back to Operations Dashboard link in the upper right corner of the Location Details Map page.
To return to the main Operations Dashboard page, click the Back to Operations Dashboard link in the upper right corner of the Location Details page.
Use the Transaction Exceptions component of the Operations Dashboard to view a summary of the total number of transaction exceptions for each location and transaction type for a given date range.
From the Transaction Exceptions component you can access the Transaction Exceptions detail page where you can view:
More detailed information for each transaction exception.
Transaction Exceptions metric by location and transaction type.
Stacked bar graphs displaying the total number of transaction exceptions by location and transaction type.
Open (detected) exception messages associated with the transaction exception.
Use these procedures to view transaction exceptions:
To View Transaction Exceptions Summary Information
Navigate to the Operations Dashboard.
Navigate to the Transaction Exceptions component.
Transaction Exceptions component
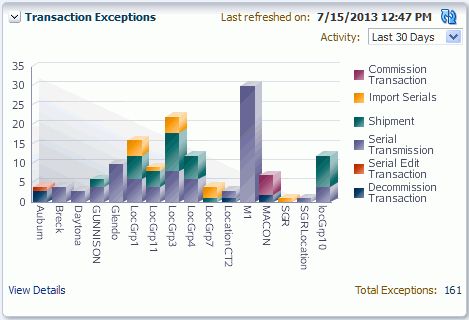
The Transaction Exceptions component appears displaying stacked bar graphs for each location and the total number of exceptions within the last thirty days for each type of transaction within those locations in a different color.
Last 30 Days appears in the Transaction Exceptions Activity field by default.
At the top of the Transaction Exceptions component appears the date and time the component was last refreshed and the Refresh Dashboard Component icon.
At the bottom of the component appears the View Details link and the total number of exception transactions for all locations. The View Details link is used to access the Transaction Exceptions detail page.
(Optional) Hover over the different colors in the bar graphs to view exception details for that location and type of transaction.
A text box appears displaying transaction type, location, and total number of transaction exceptions for that type.
(Optional) Refresh the information that appears in the Transaction Exceptions component by clicking the Refresh Dashboard Component icon.
The Transaction Exceptions component is refreshed and displays the most current information. The "Last refreshed on" field is updated with the current date and time.
(Optional) Change the transaction exception date range for the Transaction Exceptions component by selecting another date range using the Activity field. Activities are:
Last 7 Days
Last 30 Days
Appears by default.
Last 60 Days
Last 90 Days
Last 365 Days
The Transaction Exceptions component is refreshed and displays the transaction exceptions for the date range selected.
To View Transaction Exceptions Detail Information
Navigate to the Transaction Exceptions component within the Operations Dashboard.
Click the View Details link at the bottom of the Transaction Exceptions component.
Transaction Exceptions detail page
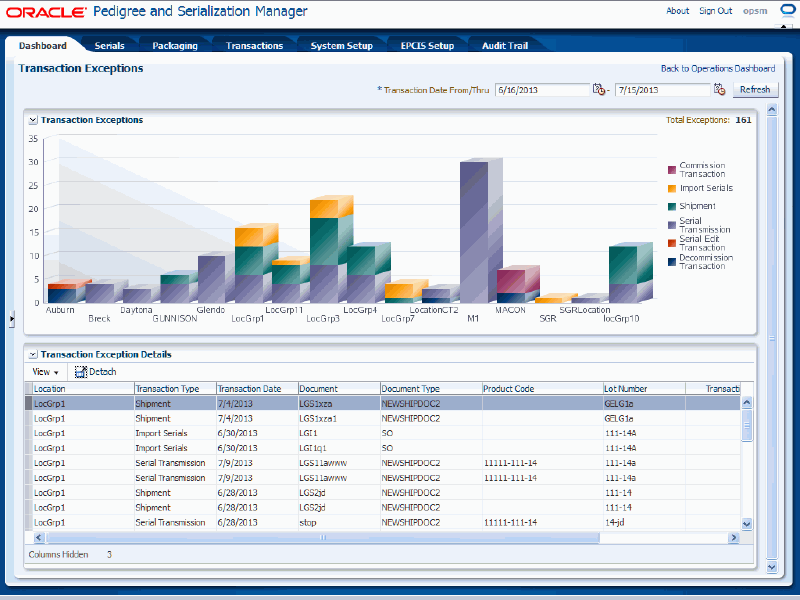
The Transaction Exceptions detail page appears displaying the Transaction Exceptions region and the Transaction Exception Details region for the first location. In the Transactions Exception region of the page, the system displays a summary of the total number of transaction exceptions for each location and transaction type in a stacked bar graph format. Each bar graph represents a different location. In the upper right hand side of the region the total number of exceptions for all locations appears in the Total Exceptions field.
In the Transaction Exception Details region, the system displays in a table format the individual transaction records that make up those transaction exceptions. An "Exception Details" column appears in the table displaying an Exception Details icon. Click the icon to access the Exception Details page where you can view the actual open messages for the exception transaction.
Plus, the system populates the actual dates in the Transaction Date From and Thru fields from the Transaction Exception Activity value entered previously.
(Optional) Hover over the different colors in the bar graphs to view exception details for that location and type of transaction.
A text box appears displaying transaction type, location, and total number of transaction exceptions for that type.
(Optional) View the transaction exception record details for another location by clicking an individual bar graph in the Transaction Exceptions region of the page.
The Transaction Exceptions Detail region is refreshed and displays in table format the detailed transaction exception records for the location selected in the bar graph.
(Optional) View the exception messages for a transaction by clicking the Exception Details icon in the Exception Details column in the table in the Transaction region of the page.
The Exception Details dialog box appears displaying the actual open (detected) exception messages for the transaction. Click the OK button to close the dialog box.
(Optional) Change the transaction exception date range by selecting a different date range using the Transaction Date From and Transaction Date Thru fields and then click the Refresh button.
The Transaction Exceptions page is refreshed and displays the information for the new date range.
To return to the main Operations Dashboard page, click the Back to Operations Dashboard link in the upper right corner of the Transaction Exceptions page.
Use the Counterfeit Serials Analysis component of the Operations Dashboard to view a summary of the total number of suspect counterfeit, verified not counterfeit, or counterfeit serials in Oracle Pedigree and Serialization Manager (OPSM) by either product or location for a given date range.
From the Counterfeit Serials Analysis component you can access the Counterfeit Serials Analysis by Product or the Counterfeit Serials Analysis by Location pages where you can view:
More detailed information for each suspect counterfeit, verified not counterfeit, or counterfeit serial by product or location.
Counterfeit serials analysis metric by product or location.
Bar graphs displaying the total number of suspect counterfeit, verified not counterfeit, or counterfeit serials by product or location.
Duplicate serial information for the suspect counterfeit, verified not counterfeit, or counterfeit serial.
Use these procedures to view counterfeit serial analysis information:
To View Counterfeit Serials Analysis Summary Information
Navigate to the Operations Dashboard.
Navigate to the Counterfeit Serials Analysis component.
Counterfeit Serials Analysis component (Product View By)
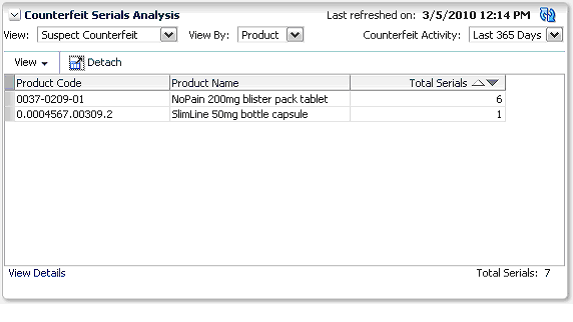
The Counterfeit Serials Analysis component appears displaying in a table format each product and the total number of suspect counterfeit serials for those products within the last thirty days.
Suspect Counterfeit appears in the View field by default.
Product appears in the View By field by default.
Last 30 Days appears in the Counterfeit Activity field by default.
At the top of the Counterfeit Serials Analysis component appears the date and time the component was last refreshed and the Refresh Dashboard Component icon.
At the bottom of the component appear the View Details link and the total number of suspect counterfeit serials for all products. The View Details link is used to access the Counterfeit Serials Analysis by Product or the Counterfeit Serials Analysis by Location pages.
(Optional) Refresh the information that appears in the Counterfeit Serials Analysis component by clicking the Refresh Dashboard Component icon.
The Counterfeit Serials Analysis component is refreshed and displays the most current information. The "Last refreshed on" field is updated with the current date and time.
(Optional) View a different counterfeit type analysis by selecting a different view using the View field. Values are:
Counterfeit
Verified Not Counterfeit
Suspect Counterfeit
Appears by default.
The Counterfeit Serials Analysis component is refreshed and displays the serial information pertaining to that counterfeit type. For example, you can change from viewing suspect counterfeit serials by product to viewing counterfeit serials by product.
(Optional) View a different counterfeit serial analysis breakdown by selecting a value in the View By field. Values are:
Location
Product
Appears by default.
Counterfeit Serials Analysis component (Location View By)
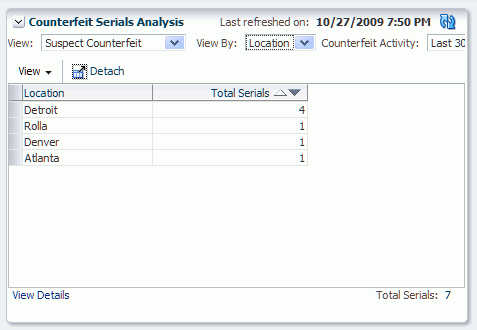
The Counterfeit Serials Analysis component is refreshed and displays in a table format the total number of suspect counterfeit, verified not counterfeit, or counterfeit serials by product or location.
(Optional) Change the counterfeit activity date range for the Counterfeit Serials Analysis component by selecting another date range using the Counterfeit Activity field. Counterfeit Activities are:
Last 7 Days
Last 30 Days
Appears by default.
Last 60 Days
Last 90 Days
Last 365 Days
The Counterfeit Serials Analysis component is refreshed and displays the counterfeit serial analysis for the date range selected.
To View Counterfeit Serials Analysis Detail Information
Navigate to the Counterfeit Serials Analysis component within the Operations Dashboard.
Click the View Details link at the bottom of the Counterfeit Serials Analysis component.
Counterfeit Serials Analysis by Product page
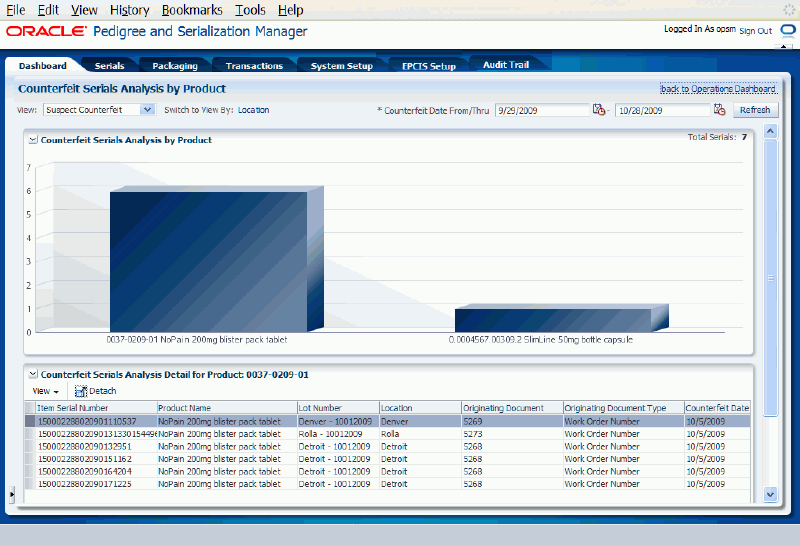
Depending on the value in the View By field either the Counterfeit Serials Analysis by Product page or Counterfeit Serials Analysis by Location page appears. These two pages operate the same way except one page displays the counterfeit serial analysis details by product and the other one the counterfeit serial analysis details by location.
In the upper region of the page, the system displays a summary of the total number of suspect counterfeit, verified not counterfeit, or counterfeit serials by product or location in a bar graph format. Each bar graph represents a different product or location. In the upper right hand side of the region the total number of serials appears in the Total Serials field.
In the lower region of the page, the system displays in a table format the individual serial records that make up those suspect counterfeit, verified not counterfeit, or counterfeit totals for the product or the location. A "Duplicates Exist" column appears in the table displaying a Duplicates Exists icon if there are duplicate serials. Click the icon to access the Duplicate Serial dialog box where you can view the original serials and any other serials that may be duplicates.
Plus, the system populates the actual dates in the Counterfeit Date From and Thru fields from the Counterfeit Activity value entered previously.
(Optional) Hover over the bar graph to view details for that product or location.
A text box appears displaying either the product code, product name, and total number of serials or location and total number of serials.
(Optional) View the serial record details for another product or location by clicking an individual bar graph in the upper region of the page.
The lower region of the page is refreshed and displays in table format the detailed serial records for the product or location selected in the bar graph.
(Optional) View the duplicate information for a serial by clicking the Duplicates Exist icon in the Duplicates Exist column in the table in the lower region of the page.
The Duplicate Serials dialog box appears displaying the original and other serial numbers that are duplicates. These serials may be the reason for the suspect counterfeit or counterfeit serials.
(Optional) View a different counterfeit type analysis by selecting a different view using the View field. Values are:
Counterfeit
Suspect Counterfeit
The Counterfeit Serials Analysis by Product or by Location page is refreshed and displays the serial information pertaining to that counterfeit type. For example, you can change from viewing suspect counterfeit serials by product to viewing counterfeit serials by product.
View a different counterfeit serial analysis breakdown by clicking the link next to the Switch to View By field. Links are:
Location
Product
Counterfeit Serials Analysis by Location page
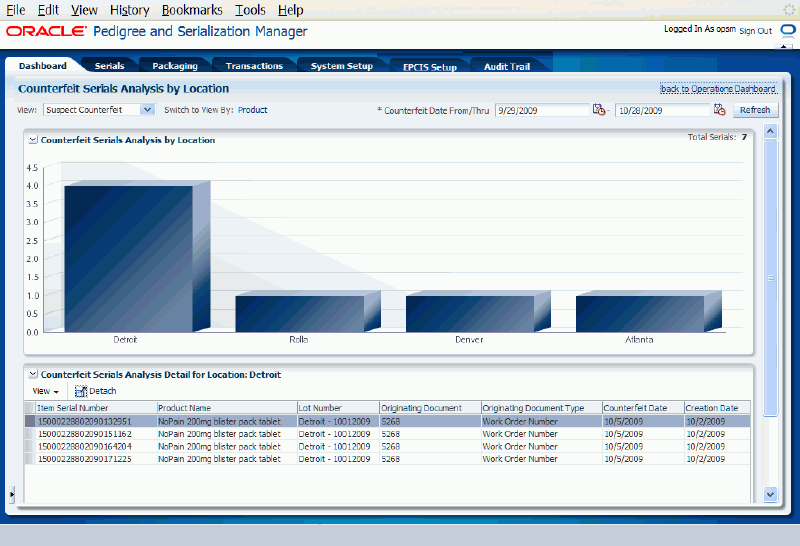
The Counterfeit Serials Analysis by Product or by Location page is refreshed and displays in a table format the total number of suspect counterfeit, verified not counterfeit, or counterfeit serials by product or location.
(Optional) Change the counterfeit date range by selecting a different date range using the Counterfeit Date From and Counterfeit Date Thru fields and then click the Refresh button.
The Counterfeit Serials Analysis by Product or by Location page is refreshed and displays the information for the new date range.
To return to the main Operations Dashboard page, click the Back to Operations Dashboard link in the upper right corner of the Counterfeit Serials Analysis by Product or by Location page.
Use the Serial Range Management component of the Operations Dashboard to view a summary of serial ranges with a count showing how many ranges by location or location group are within their critical or at-risk thresholds (range exhaustion) as well as ranges that are nearing their effective end date expiration (date expiration).
From the Serial Range Management component you can access the Serial Range Management page where you can view:
More detailed information for each serial range by individual location, location group, or for all locations and location groups at once.
Use these procedures to view serial range information:
Prerequisites
For information on setting up locations or serial ranges, see Maintaining Locations or Maintaining Serial Ranges.
To View Serial Range Summary Information
Navigate to the Operations Dashboard.
Navigate to the Serial Range Management component.
Serial Range Management component
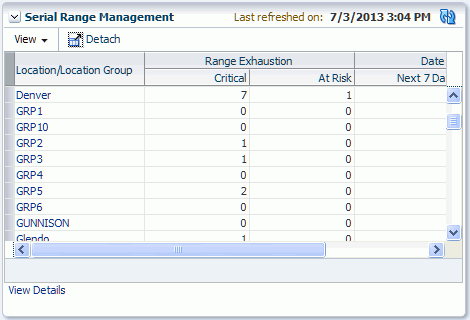
The Serial Range Management component appears displaying in a table format each location or location group and a total count of how many ranges are near range exhaustion (within their critical or at-risk thresholds) and how many ranges are near their end date expiration (next 7 days or next 8-30 days).
At the top of the Serial Range Management component appears the date and time the component was last refreshed and the Refresh Dashboard Component icon.
At the bottom of the Serial Range Management component appears the View Details link which is used to access the Serial Range Management page.
(Optional) Refresh the information that appears in the Serial Range Management component by clicking the Refresh Dashboard Component icon.
The Serial Range Management component is refreshed and displays the most current information. The "Last refreshed on" field is updated with the current date and time.
To View Serial Range Detail Information
Navigate to the Serial Range Management component within the Operations Dashboard.
Click the View Details link at the bottom of the Serial Range Management component or click a Location or Location Group link in the table.
Serial Range Management page
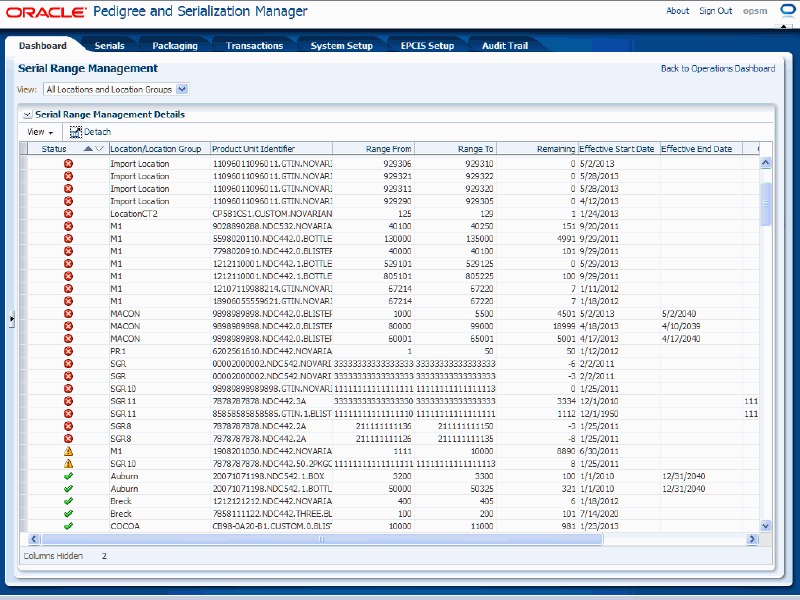
The Serial Range Management page appears displaying detailed information for all active serial ranges in the system for all locations and location groups, a specific location, or a specific location group in a table format. All Locations and Location Groups appears in the View field by default when you access the page from the View Details link. Otherwise, the specific location or location group appears in the View field by default when accessing the page from the Location or Location Group link in the table.
The Status column in the table displays a different icon to indicate if the ranges are within a critical or at-risk threshold based on either running out of serial numbers in the range or the ranges effective end date is nearing expiration. A different icon appears for each serial range status. Statuses are:
Green check mark: Indicates that the range is not critical or at risk of exhaustion or expiration, or no thresholds have been defined.
Yellow Triangle with Exclamation Point: Indicates that the range is at risk of nearing exhaustion.
Red Circle with an X in the Middle: Indicates that the range is critical of nearing exhaustion.
Blue Calendar page: Indicates the range is at risk of nearing effective date expiration.
Yellow Calendar page with Exclamation Point: Indicates the range is critical and nearing effective end date.
View the serial ranges for a specific location, location group, or all locations and location groups by selecting a value in the View field at the top of the page. Views are:
All Locations and Location Groups
Each individual location that has serial ranges is listed.
Each individual location group that has serial ranges is listed.
The Serial Range Management page is refreshed and displays the serial ranges for that specific location, location group, or all locations and location groups.
To return to the main Operations Dashboard page, click the Back to Operations Dashboard link in the upper right corner of the Serial Range Management page.
The Operations Dashboard in Oracle Pedigree and Serialization Manager (OPSM) enables you to add up to five custom URLs to the Dashboard. Using the Maintain System Parameters page you specify the URL name and the fully qualified URL (location) for each of the five custom URLs. After you specify the URLs using the Maintain System Parameters page these URLs are available from the Operations Dashboard Navigation menu.
Use this procedure to add custom URLs to the Operations Dashboard:
To Add Custom URLs to the Operations Dashboard
Navigate to the Maintain System Parameters page.
On the Dashboard tab, enter the Dashboard URL Name and the fully qualified Dashboard URL for one or more of the URLs you want to add to the Operations Dashboard.
Save your work.
Log out of Oracle Pedigree and Serialization Manager and then log back in.
Navigate to the Operations Dashboard.
The new Dashboard URLs appear for selection at the top of the Tasks (Navigation) menu under the Operations Dashboard link. The Names that appear for the URLs on the Operations Dashboard are what you specified as the names for the URLs on the Maintain System Parameters page.
Note: To remove the URLs go back the Maintain System Parameters page and remove the entries.
When you access the Operations Dashboard in Oracle Pedigree and Serialization Manager (OPSM) the information that displays on the Dashboard is for that particular point in time. Using the Refresh icon you can periodically refresh the information that displays for the entire dashboard or you can use the Refresh icon associated with the different components of the page to refresh the information that appears just for that component.
Use these procedures to refresh the information that displays on the Operations Dashboard:
To Refresh the Information that Displays on the Operations Dashboard (Entire Dashboard)
Navigate to the Operations Dashboard.
The Operations Dashboard appears displaying information for each component (Location Details, Transaction Exceptions, Counterfeit Serial Analysis, and Serial Range Management) in the dashboard.
Click the Refresh All Dashboard Components icon located at the very top right hand corner of the Operations Dashboard.
The system refreshes the information for the entire dashboard. The "Last refreshed on" field for each component is updated with the current date and time.
To Refresh the Information that Displays on the Operations Dashboard (Individual Component)
Navigate to the Operations Dashboard.
The Operations Dashboard appears displaying information for each component (Location Details, Transaction Exceptions, Counterfeit Serial Analysis, and Serial Range Management) in the dashboard.
Click the Refresh Dashboard Component icon located at the top right hand corner of an individual component.
All of the components (Location Details, Transaction Exceptions, Counterfeit Serial Analysis, and Serial Range Management) have the refresh icon.
The system refreshes the information for the individual component of the dashboard. The "Last refreshed on" field for the component is updated with the current date and time.
![]()
Copyright © 2013, Oracle and/or its affiliates. All rights reserved.