Navigating Source Files
The IDE provides advanced navigation features for viewing your source code. To explore these features, continue using the Quote_1 project.
Window Management and Grouping
You can perform actions on groups of windows in addition to individual windows. Each window belongs to a group you can minimize, drag to a new location, float in a separate window, or dock back into the IDE window.
-
Minimize the Projects, Files, Classes, Classes, and Services windows in the top left by clicking the Minimize Window Group button on the right side of the group.
-
Right-click in the tab area of the group or choose Window > Configure Windows and select Maximize (Shift+Escape) to maximize the Window Group.
Note that you can choose other options such as Float or Dock your window group.
Using the Classes Window
The Classes window lets you see all of the classes in your project, and the members and fields for each class.
-
Click the Classes tab to display the Classes window.
-
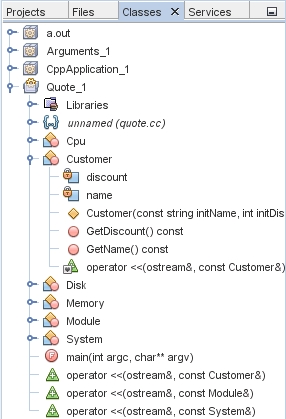
Expand the Quote_1 node. All classes in the project are listed.
-
Expand the Customer class.
-
Double-click on the name variable to open the customer.h header file.
Using the Navigator Window
The Navigator window provides a compact view of the file that is currently selected, and simplifies navigation between different parts of the file. If the Navigator window is not open, choose Window > Navigating > Navigator (Ctrl-7) to open it.
-
Click anywhere in the quote.cc file in the Editor. window.
-
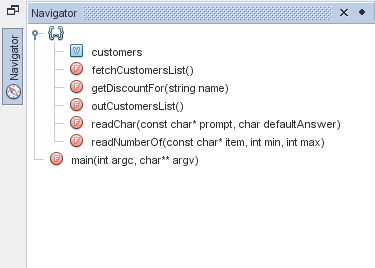
A compact view of the file is displayed in the Navigator window. Click the node at the top of the window to expand the view.
-
To navigate to an element of the file, double-click the element in the Navigator window and the cursor in the Editor window moves to that element.
-
Right-click in the Navigator window to see options for sorting the elements in the window, grouping the items, or filtering.
-
To see what the icons in the Navigator window represent, open the IDE online help by choosing Help > Help Contents. In the Help browser, click the Search tab and type navigator icons in the Find field.
Finding Class, Method, and Field Usages
You can use the Usages window to show you everywhere a class (structure), function, variable, macro, or file is used in your project's source code.
-
In the customer.cc file, right-click the Customer class on line 42, and choose Find Usages (Alt-F7).
-
In the Find Usages dialog box, click Find.
-
The Usages window opens and displays all of the usages of the Customer class in the source files of the project.
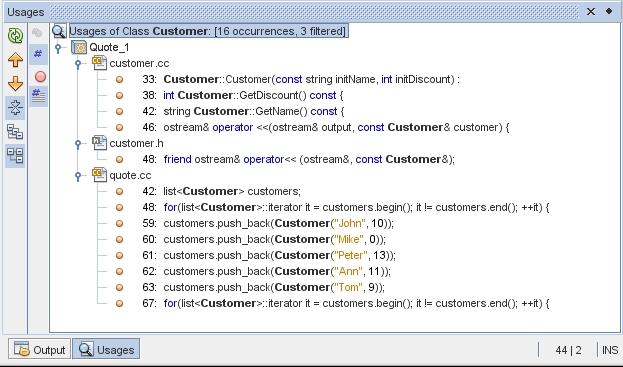
Find Usages runs in the background so you can do other tasks while it is search a large number of files. The Usages window updates results as they are incrementally found. There is a progress indicator and an incrementing count of occurrences. You can stop the search at any point and your search results up to that point are saved. You can navigate between the search hits, change the view from logical to physical, and run Find Usages again with different settings.
Using the Call Graph
The Call Graph window displays two views of the calling relationships between functions in the classes. A tree view shows the functions called from a selected function, or the functions that call that function. A graphical view shows the calling relationships using arrows between the called and calling functions.
-
In the quote.cc file, right-click on the main function and choose Show Call Graph.
-
The Call Graph window opens and displays a tree view and a graphical view of all of the functions called from the main function.
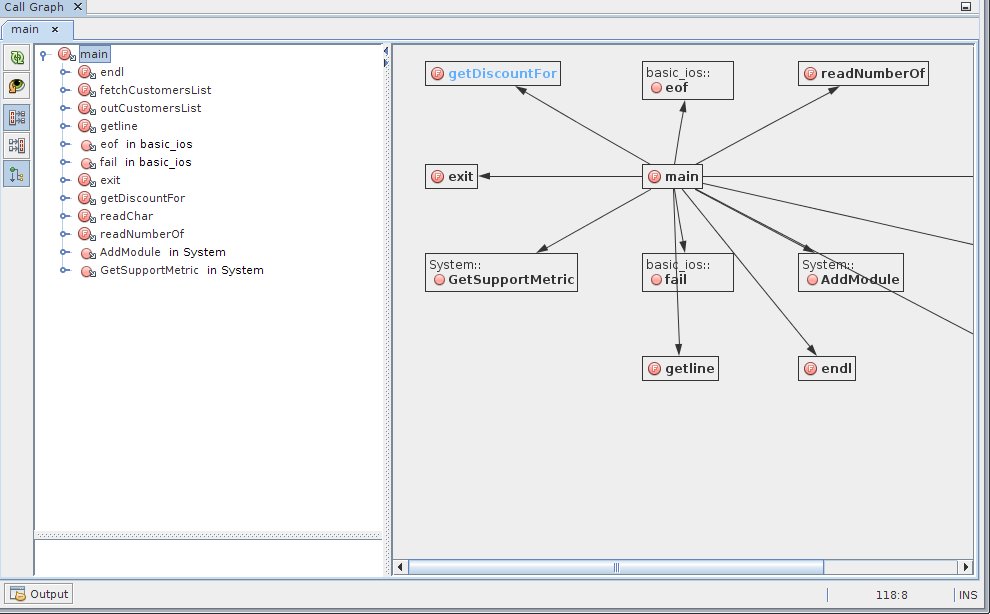
If you do not see all of the functions shown in the screen shot, click Who is Called From the Function button on the left side of the Call Graph window to show who is called from the main function.
-
Expand the end1 node to display the functions called by that function. Notice that the graph is updated to add the functions called by end1.
-
Select the end1 node and click the Bring Into Focus button on the left side of the window to focus on the endl function, then click the Who Calls This Function button to view all of the functions that call the end1 function.
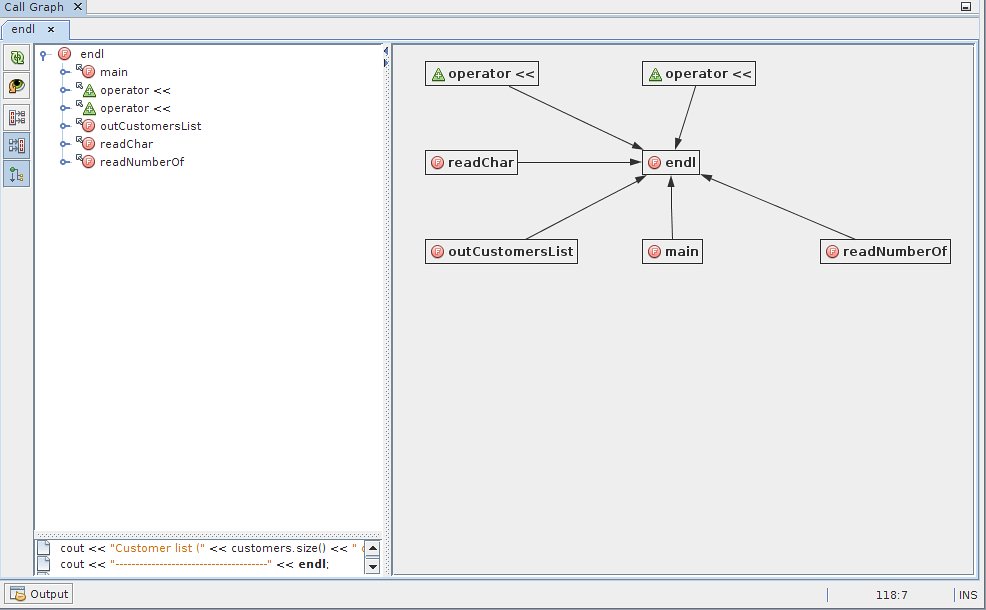
-
Expand some of the nodes in the tree to see more functions.
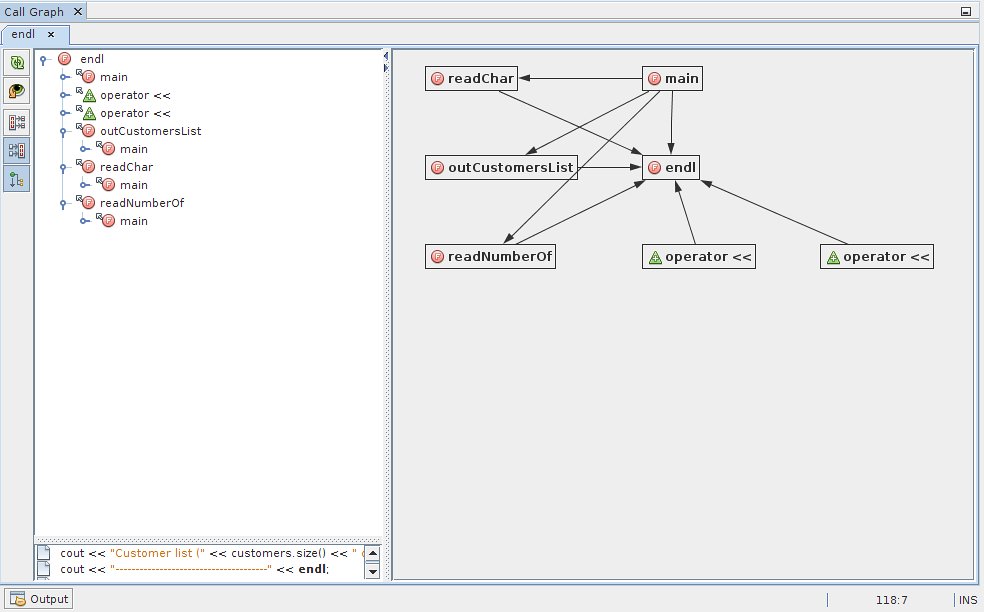
Using Hyperlinks
Hyperlink navigation lets you jump from the invocation of a class, method, variable, or constant to its declaration, and from its declaration to its definition. Hyperlinks also let you jump from a method that is overridden to the method that overrides it, and the reverse.
-
In the cpu.cc file of the Quote_1 project, mouse over line 37 while pressing Ctrl. The ComputeSupportMetric function is highlighted and an annotation displays information about the function.

-
Click the hyperlink and the editor jumps to the definition of the function.
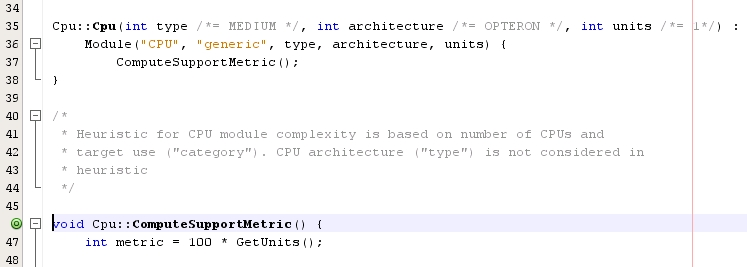
-
Mouse over the definition while pressing Ctrl, and click the hyperlink. The editor jumps to the declaration of the function in the cpu.h header file.
-
Click the left arrow in the editor tool bar and the editor jumps back to the definition in cpu.cc.
-
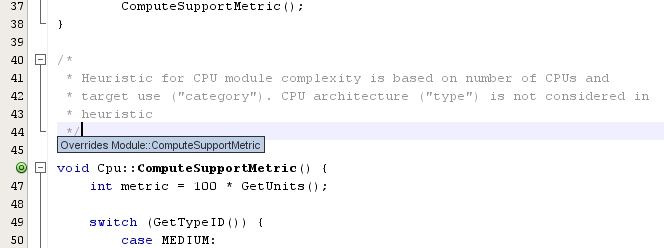
Hover the mouse cursor over the green circle
 in the left margin and see the annotation that
indicates that this method overrides another method.
-
Click the green circle to go to the overridden method and the editor jumps to the module.h header file, which shows a gray circle in the margin to indicate the method is overridden.
-
Click the gray circle and the editor displays a list of methods that override this method.

-
Click the Cpu::ComputerSupportMetric item and the editor jumps back to the declaration of the method in the cpu.h header file.
Using the Include Hierarchy
The Include Hierarchy window lets you inspect all header and source files that are directly or indirectly included in a source file, or all source and header files that directly or indirectly include a header file.
-
In the Quote_1 project, open the module.cc file in the Source Editor.
-
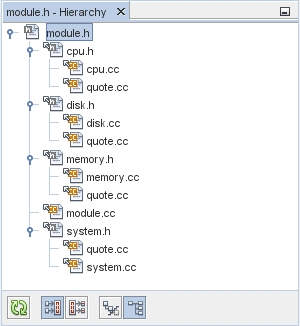
Right-click on the #include "module.h" line in the file and choose Navigate > View Includes Hierarchy.
-
By default, the Hierarchy window displays a plain list of files that directly include the header file. Click the Show Tree View button at the bottom of the window . Click the Show Direct Includes Only button to display all files that include or are included. Expand the nodes in the tree view to see all of the source files that include the header file.
Using the Type Hierarchy
The Type Hierarchy window lets you inspect all subtypes or supertypes of a class.
-
In the Quote_1 project, open the module.h file.
-
Right-click on the declaration of the Module class and choose Navigate > View Type Hierarchy.
-
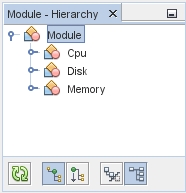
The Hierarchy window displays all of the subtypes of the Module class.
