Debugging an Executable File
You can debug an executable binary that is not in an IDE project. However, the executable should be located with the source code that was used to build it so the debugger can find debugging information. This is also called Projectless Debugging.
To debug an executable:
-
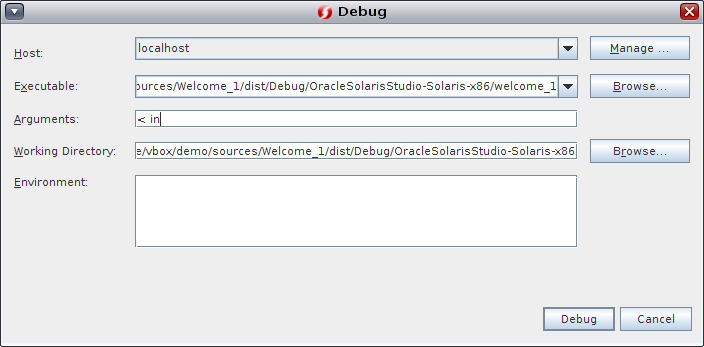
In the menu, choose Debug > Debug Executable.

-
In the Debug dialog box, select which development host you want to use from the Host drop-down list.
-
Click the Browse button to find the executable path or type it directly into the Executable text field. If you clicked Browse to find the executable path, the Working Directory text field is auto generated.
-
Add any arguments to the Arguments text field.
-
If the Working Directory is not specified, either type the working directory path directly into the Working Directory text field or by click Browse and selecting the directory in the Working Directory Dialog box and then clicking Select.
-
Specify any environment variables by typing the settings in the Environment pane.
-
Click Debug.
The program you selected is loaded into the IDE, but is in the Pause state. You can continue debugging by clicking Continue.
For more information about Debugging an Executable, see the corresponding IDE help page.