You can view the results of an experiment by clicking on the View Detailed Results link either in the Completed Experiments or In Progress Experiments pages, or by clicking on the Results button on the Experiment Configuration page.
This opens the Experiment Configuration screen with the Results panel on display.
Results panel
The results screen displays the following information:
Experiment Status: This is the current status of the experiment. It informs you whether the experiment is currently in progress and, if not, whether a future schedule is in place to re-run the experiment.
If the experiment is currently in progress it also displays the Start Date and scheduled End Date for the experiment.
If the experiment has been re-scheduled it also displays the re-scheduled Start Date and End Date for the experiment.
Unique Participants: This is a count of the unique participants for the control and variant for the experiment.
Goal Name: This is the name of the goal.
Participants/%: This is the number of unique participants who met this goal, displayed as a number and as a percentage of unique participants.
Note: Participants/% is only visible if you expand the result set by clicking on the Expand button at the top of the result set and is hidden if you click on the Collapse button.

Collapse and Expand buttons
Baseline Comparison: This figure is a rounded percentage figure which shows whether more participants performed the goal action after seeing the variant page compared against the number who perform the goal action after seeing the control page. The control page value is taken as the baseline and the variant value is compared against this.
If the goal occurred more often in the variant than in the control, this figure is green and is prefixed with a +. If the goal occurred the same number of times in the variant as in the control, the figure is black. If the goal occurred less often in the variant than in the control, the figure is red and is prefixed with a -.
Confidence Level: This is a rounded percentage figure which shows the statistical significance level for each goal. It is measured against a set statistical significance level of 95%. A traffic-light system is in place to indicate how close to statistical significance the result is for the relevant goal. A value of 84% or lower is displayed in red, 85%-94% is displayed in yellow, and 95% or above is displayed in green.
If the experiment is currently in progress you can refresh the result set by clicking on the Refresh icon in the Results panel.
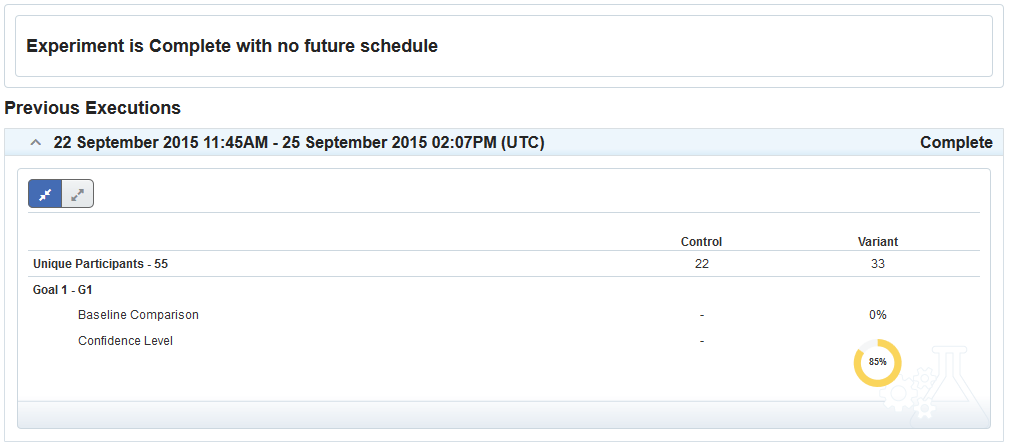
The results sets for any previous executions of the experiment are displayed as an accordion view ordered by End Date with the most recent result set at the top of the list. You can expand or collapse these result sets by clicking on the chevron beside the start and end dates for the result set. Expanding a result set will display the result data for that execution of the experiment.
Experiment Date: This is the date range across which the experiment ran. If the experiment is currently in progress, it shows an end date in the future.
Unique participants: This shows how many visitors participated in the experiment. If the experiment is currently in progress, this is a count of how many visitors have participated in the experiment to date. This value may increase if the page is refreshed.
Primary Goal: This is the name of the goal that was selected as the primary goal for the experiment.
Baseline Comparison: This is the baseline comparison value for the primary goal for the experiment.
Results Grid: This displays results that have been separated out into Control and Variant streams to make it easy to compare their relative performances in the experiment. You can expand or collapse the result grid by clicking on the appropriate button.
The fields displayed in the result grid are:
Unique Participants: This shows how many visitors who participated in the experiment were shown the control page, and how many were shown the variant page.
Goal Name: This is the name of the goal to which the results displayed in this row apply.
Participants / %: This is the number of participants in the experiment who were shown the control or variant page and includes this number as a percentage of all participants in the experiment. This is only displayed when the results grid is expanded.
Baseline Comparison: This figure is a rounded percentage figure which shows whether more participants performed the goal action after seeing the variant page compared against the number who perform the goal action after seeing the control page. The control page value is taken as the baseline and the variant value is compared against this.
If the variant page results in more participants performing the goal action, this value is displayed in green. If the control page results in more participants performing the goal action, this value is displayed in red.
Confidence Level: This is a rounded percentage figure which shows the statistical significance level for each goal. It is measured against a set statistical significance level of 95%. A traffic-light system is in place to indicate how close to statistical significance the result is for the relevant goal. A value of 84% or lower is displayed in red, 85%-94% is displayed in yellow, and 95% or above is displayed in green.
