Dashboard
The VSM GUI Dashboard indicates current VSM system status and provides alerts for key performance metrics.
The Dashboard is initially displayed when you log in to VSM GUI and remains active throughout the VSM GUI session. To re-display the Dashboard during a session, just click the Dashboard tab at the top of the pane.
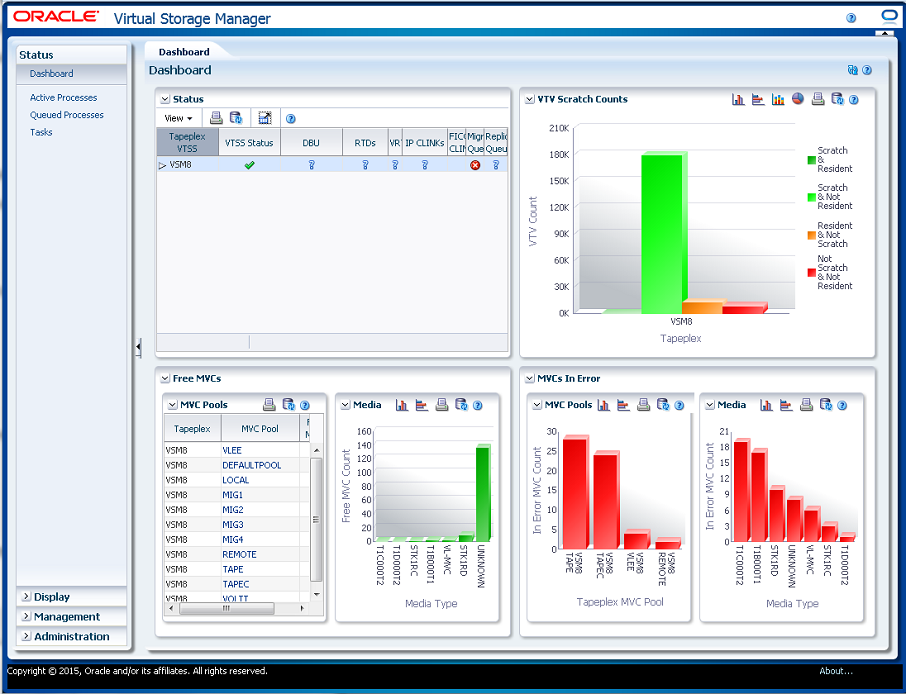
Dashboard elements include:
A database update error message is displayed at the top of the Dashboard if there has been an issue with the database refresh process. Click the error message to display the Database Update Log and manage the database refresh process manually.
Status
This data table shows current system status summarized for all VTSSs in each tapeplex or expanded to show each VTSS in a selected tapeplex.
To display, select Status and Dashboard on the navigation tree.
You may need to scroll horizontally or detach the table to view all columns.
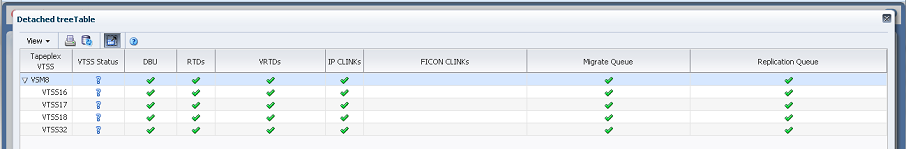
Click the Expand button left of the tapeplex name to display the VTSSs for that tapeplex.
The status for each field is summarized with a status indicator:
| Icon | Name | Description |
|---|---|---|
| Good | Indicates no threshold violations are detected | |
| Caution | Indicates warning thresholds have been exceeded | |
| Critical | Indicates critical thresholds have been exceeded | |
| Unknown | Indicates status could not be detected |
Click a status indicator to display its details:
-
Click a VTSS Status or DBU indicator to view the "Display VTSS" panel filtered for the selected tapeplex or VTSS.
-
Click a RTDs or vRTDs indicator to view the "Display Drive" panel filtered for that drive type on the selected tapeplex or VTSS.
-
Click an IPCLINKs or FICON CLINKs indicator to view the "Display CLINK" panel filtered for the selected tapeplex or VTSS.
-
Click a Migrate Queue or Replication Queue indicator to view the "Queued Processes" panel filtered for the selected tapeplex or VTSS.
Table columns and descriptions include:
| Column | Description |
|---|---|
| Tapeplex VTSS | The tapeplex name and the VTSS names in the tapeplex. |
| VTSS Status | Indicates VTSS status:
Good: Indicates the VTSS is Online. Warning: Indicates the VTSS is Online-p, Quiescing, Quiesced, or Started. Critical: Indicates the VTSS is Offline or Offline-p. Unknown: Indicates a value other than Online, Online-p, Offline, Offline-p, Quiescing, Quiesced, or Started. |
| DBU | Indicates the DBU level:
Good: Indicates the DBU is less than the high auto-migrate threshold (HAMT). Warning: Indicates the DBU is greater than or equal to the high auto-migrate threshold (HAMT). Critical: Indicates the DBU is greater than the alert level for this VTSS. Unknown: Indicates the DBU, alert level, or HAMT values are missing. |
| RTDs | Indicates the RTD status:
Good: Less RTDs are offline than the warning number for this VTSS. Warning: More RTDs are offline than the warning number for this VTSS. Critical: More RTDs are offline than the critical number for this VTSS. Unknown: Status of some RTDs is unknown, or critical/warning alert levels are missing. |
| vRTDs | Indicates the vRTD status:
Good: Less vRTDs are offline than the warning number for this VTSS. Warning: More vRTDs are offline than the warning number for this VTSS. Critical: More vRTDs are offline than the critical number for this VTSS Unknown: Status of some vRTDs is unknown, or critical/warning alert levels are missing. |
| IP CLINKs | Indicates the IP Clinks status:
Good: Less IP CLINKs are offline than the warning number for this VTSS. Warning: More IP CLINKs are offline than the warning number for this VTSS. Critical: More IP CLINKs are offline than the critical number for this VTSS. Unknown: Status of some IP CLINKs is unknown, or critical/warning alert levels are missing. |
| FICON CLINKs | Indicates the FICON CLINKs status:
Good: Less FICON CLINKs are offline than the warning number for this VTSS. Warning: More FICON CLINKs are offline than the warning number for this VTSS. Critical: More FICON CLINKs are offline than the critical number for this VTSS |
| Migrate Queue | Indicates the migrant queue level status:
Good: Less Migration processes in the queue than the warning number for this VTSS. Warning: More Migration processes in the queue than the warning number for this VTSS. Critical: More Migration processes in the queue than the critical number for this VTSS. Unknown: Critical/warning alert levels are missing, or Queued Processes data is missing. |
| Replication Queue | Indicates the replication queue level status:
Good: Less Replication processes in the queue than the warning number for this VTSS. Warning: More Replication processes in the queue than the warning number for this VTSS. Critical: More Replication processes in the queue than the critical number for this VTSS. Unknown: Critical/warning alert levels are missing, or Queued Processes data is missing. |
Columns Hidden indicates the number of columns in the table that are not being displayed. These are displayed using the View menu.
Columns Frozen is the number of left-hand columns that remain static when the horizontal scroll bar is moved. A blue vertical line separates these columns from the others.
Use the View menu to perform the following operations:
| View Option | Description |
|---|---|
| Columns | Show all or selected columns and manage hidden/visible status |
| Detach | Display the table in a separate window |
| Expand | Show individual VTSSs in the selected tapeplex |
| Expand All Below | Expands all tapeplexes below the current selection |
| Collapse All Below | Collapses all tapeplexes below the current selection |
| Expand All | Expands all tapeplexes |
| Collapse All | Collapse all tapeplexes |
| Scroll to First | Scroll to the top of the list of tapeplexes |
| Scroll to Last | Scroll to the bottom of the list of tapeplexes |
| Reorder Columns | Select the column sequence for Visible columns |
Use the Page Size menu to specify the number of rows to include on a data table page.
If there are multiple pages, use the Page feature at the bottom of the table to navigate among them. Enter or select a page number or use the arrow buttons to move forward or backward in the list of pages.
Click the icons above the table to perform the following operations:
| Icon | Name | Description |
|---|---|---|
| Display as a printable page | ||
| Refresh | Refresh with data from the VSM GUI database | |
| Detach | Display in a separate window | |
| Help | Display VSM GUI Help | |
| Run ELS | Refresh data by running the necessary ELS commands to update all of the database tables that are referenced on the page | |
| Close All Tabs | Close all tabs and display just the Dashboard |
VTV Counts
This graph shows VTV scratch and resident counts for each tapeplex.
To display, select Status and Dashboard on the navigation tree.
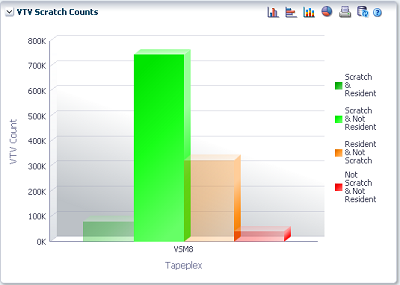
Hover the mouse on an object to display summary data for the object.
Hover on a label to highlight related objects on the graph.
Click the icons above the graph to perform the following operations:
| Icon | Name | Description |
|---|---|---|
| Vertical bar graph | Display the graph as a vertical bar chart | |
| Horizontal bar graph | Display the graph as a horizontal bar chart | |
| Stacked bar graph | Display the graph as a stacked bar chart | |
| Pie chart | Display the graph as a pie chart | |
| Display as a printable page | ||
| Refresh | Refresh with data from the VSM GUI database | |
| Help | Display VSM GUI Help | |
| Run ELS | Refresh data by running the necessary ELS commands to update all of the database tables that are referenced on the page | |
| Close All Tabs | Close all tabs and display just the Dashboard |
Free MVCs
Free MVCs reports show free MVC status for MVC Pools or media types:
To display, select Status and Dashboard on the navigation tree.
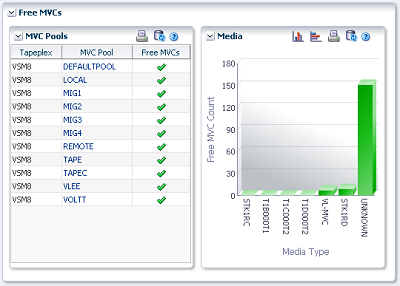
Free MVCs: MVC Pools
The MVC Pools data table indicates Free MVCs current status for each MVC Pool on each tapeplex.
The status for each field is summarized with a status indicator:
| Icon | Name | Description |
|---|---|---|
| Good | Indicates no threshold violations are detected | |
| Caution | Indicates warning thresholds have been exceeded | |
| Critical | Indicates critical thresholds have been exceeded | |
| Unknown | Indicates status could not be detected |
Click a status indicator to display its details:
MVC Pools are shown to be in a critical state if the number of free MVCs is less than the Minimum Free MVCs value for the pool.
MVC Pools are shown to be in a warning state if the number of free MVCs is equal to than the Minimum Free MVCs value for the pool.
MVC Pools are shown to be in a good state if the number of free MVCs is greater than the Minimum Free MVCs value for the pool.
MVC Pools are shown to be in an unknown state if the Minimum Free MVCs value or the number of free MVCs is not known.
Hover the mouse on an object to display summary data for the object.
Click an MVC Pool in the data table to show the Display MVC Pool panel, filtered for that MVC Pool.
Click the icons above the graph to perform the following operations:
| Icon | Name | Description |
|---|---|---|
| Display as a printable page | ||
| Refresh | Refresh with data from the VSM GUI database | |
| Help | Display VSM GUI Help | |
| Run ELS | Refresh data by running the necessary ELS commands to update all of the database tables that are referenced on the page | |
| Close All Tabs | Close all tabs and display just the Dashboard |
Free MVCs: Media
The Media graph shows Free MVCs sorted by media type.
Click an object in the graph to show the Display MVC panel, filtered for that media type.
Click the icons above the graph to perform the following operations:
| Icon | Name | Description |
|---|---|---|
| Vertical bar graph | Display the graph as a vertical bar chart | |
| Horizontal bar graph | Display the graph as a horizontal bar chart | |
| Display as a printable page | ||
| Refresh | Refresh with data from the VSM GUI database | |
| Help | Display VSM GUI Help | |
| Run ELS | Refresh data by running the necessary ELS commands to update all of the database tables that are referenced on the page | |
| Close All Tabs | Close all tabs and display just the Dashboard |
MVCs in Error
MVCs in Error reports show MVCs in error sorted by MVC Pool or media type:
To display, select Status and Dashboard on the navigation tree.
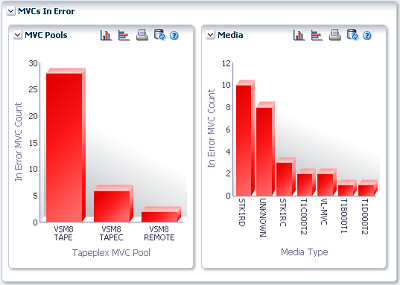
MVCs in Error: MVC Pools
The MVC Pools graph show MVCs in error, sorted by MVC Pool.
Hover on an object to display summary data for the object.
Click an MVC Pools object to show the Display MVC Pool panel, filtered for that MVC Pool.
Click the icons above the graph to perform the following operations:
| Icon | Name | Description |
|---|---|---|
| Vertical bar graph | Display the graph as a vertical bar chart | |
| Horizontal bar graph | Display the graph as a horizontal bar chart | |
| Display as a printable page | ||
| Refresh | Refresh with data from the VSM GUI database | |
| Help | Display VSM GUI Help | |
| Run ELS | Refresh data by running the necessary ELS commands to update all of the database tables that are referenced on the page | |
| Close All Tabs | Close all tabs and display just the Dashboard |
MVCs in Error: Media
The Media graphs show MVCs in error, sorted by media type.
Hover on an object to display summary data for the object.
Click a media object to show the Display MVC panel, filtered for that media type.
Click the icons above the graph to perform the following operations:
| Icon | Name | Description |
|---|---|---|
| Vertical bar graph | Display the graph as a vertical bar chart | |
| Horizontal bar graph | Display the graph as a horizontal bar chart | |
| Display as a printable page | ||
| Refresh | Refresh with data from the VSM GUI database | |
| Help | Display VSM GUI Help | |
| Run ELS | Refresh data by running the necessary ELS commands to update all of the database tables that are referenced on the page | |
| Close All Tabs | Close all tabs and display just the Dashboard |