You can define a group on a dashboard by combining attribute elements with a calculation. A calculated group creates a new element; it does not replace the selected elements. In a Grid visualization, a calculated group adds a row of data; in a bar graph, it creates a new bar risers; in a Network visualization, it adds a node; and so on.
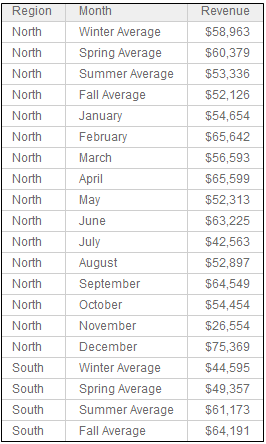
For example, if your Grid visualization displays revenue data from each month on separate rows, you can display the averages for each season, as shown below. Notice that the individual months are still displayed, as well as the separate row for each season’s average. (Only the averages for South are shown, not all the months, to save space.)

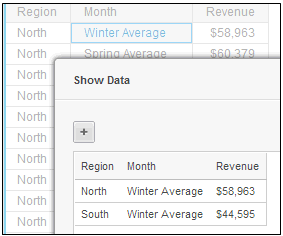
If this was a longer Grid visualization, you might not be able to see all the averages at once. You can show the data for all the winter averages, for example, as shown below:

To do this, right-click the group element (Winter Average in the above example) and select Show Data. You can select multiple group elements at the same time, such as Winter Average and Spring Average in the example.
When you create a group, any attribute elements not used in the group are grouped together. By default, these elements are displayed individually, but you can choose to consolidate the remaining elements into a group.
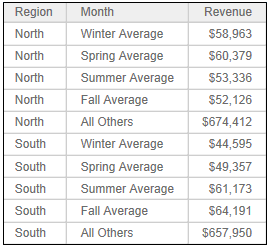
Because a calculated group does not replace the attribute elements that the group contains, all the elements are considered unused. In the Grid visualization above, although the groups contain all the month elements, the months are still considered unused by the groups. If you choose to consolidate the unused elements into a group, the Grid visualization would look like the following:

By default, the consolidated group is named All Others, but you can change the name.
You can create multiple groups on the same attribute. For example, you can add a Lowest Revenue group, an Average Revenue group, subtract January’s revenue from February’s, subtract February’s revenue from March’s, and so on. Because the calculated group does not replace attribute elements, you can reuse attribute elements in these groups. The available calculations are described below:
| If You Select... | The Available Calculations are... |
| One element |
|
| Two elements |
|
| Three or more elements |
|
You can create groups on different attributes, but each group can contain elements from only one attribute. If this Grid visualization contained more regions, for example, you could create separate groups for the northern regions, southern regions, and central regions.
You can group elements of an attribute imported from your data sources, or of a derived attribute that you created on the dashboard. For steps to create a derived attribute, and general information about them, see Creating an attribute based on existing objects: Derived attributes.
Although these examples use Grid visualizations to make it easier to see the data, you can create groups on other types of visualizations. For example, you can select multiple nodes on a Network visualization, and attribute elements or data points on a Graph visualization or Heat Map visualization.
For example, your Grid visualization displays monthly revenue by region. You can select all the months and choose the calculation as Highest. If your Graph visualization displays revenue data from each month in separate bar risers, you can select all the months and choose the calculation as Highest. This displays a new bar riser in the Graph visualization with the highest monthly revenue in each region. The bar risers for each month are still displayed in the visualization.
Steps to create a calculated group are provided below. For steps to consolidate unused elements into a group, see Consolidating unused elements into a group on a dashboard. For steps to modify a group, see Renaming, rearranging, and removing groups on a dashboard.
You have created the dashboard to add the group to. For steps, see Creating a dashboard.
You have created the visualization to add the group to. For steps, see About visualizations.
To define a group with a calculation:
Click the name of the dashboard to run it.
Click the visualization to add the group to.
In the visualization, select each attribute element to use in the group.
Right-click the selected elements and point to Calculation, then select the type of calculation to create the derived element based on, such as Add or Greatest. Some calculations, such as Element1-Element2, are available if you have selected exactly two attribute elements. The New Calculation dialog box opens.
If you point to Calculation and a Base On list is displayed, you have selected elements from multiple attributes (for example, by using a lasso on a Heat Map visualization). A group can contain elements from a single attribute. Select the attribute to group from the Base On list, select the calculation, and click OK. The New Calculation dialog box opens.
In the Name field, type a name for the group.
Click Save. The group is created and added to the visualization.
By default, the grouped attribute is renamed AttributeName (Group), where AttributeName is the attribute that you selected elements from. You can rename the grouped attribute by right-clicking it in the Editor panel, selecting Rename, and typing the new name.
All elements of the selected attribute are still displayed on the visualization, regardless of whether they are included in the calculated group. You can display the attribute elements as a group, by consolidating them. (The calculated group will not be included in the consolidated group and will still display separately.) For steps, see Consolidating unused elements into a group on a dashboard. You can also modify the groups to rearrange the order that the groups are displayed, rename the group, delete the group, and so on. For steps, see Renaming, rearranging, and removing groups on a dashboard.
Grouping attribute elements in a dashboard
Consolidating unused elements into a group on a dashboard
Renaming, rearranging, and removing groups on a dashboard
_____________________________
Copyright © 2019, Oracle and/or its affiliates. All rights reserved.
Legal Notices