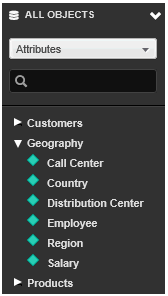
The All Objects panel displays the data in the current project. You can click and drag dataset objects from the All Objects panel onto the appropriate area of a dashboard to add filters, dynamic text, data to display in visualizations in the dashboard, and so on.
To display the All Objects panel, from the bottom of the Datasets panel, click the arrow icon next to All Objects. The All Objects panel is displayed.
Note: If the Datasets panel is not displayed, from the View menu, select Datasets Panel.

The following options are available:
You can quickly navigate to a specific folder location using the drop-down list at the top of the panel. The list at the bottom of the panel is updated to display the contents of the selected folder, including dataset objects and other folders. To expand the contents of a folder, click the folder's name. The contents of the folder are displayed.
You can search for a dataset object by typing its name in the search field at the top of the panel. To search within a selected folder, select the name of the folder from the list.
You can add, replace, or remove data from a visualization, as follows:
To add data to the visualization, click and drag an attribute or metric from the All Objects panel onto the appropriate area in the visualization's Editor panel, so that an indicator line is displayed in the location in which you want to place the attribute or metric. The attribute or metric is added to the visualization and displayed.
To replace the data displayed in a visualization, click and drag an attribute or metric from the All Objects panel onto the dataset object on the visualization's Editor panel that you want to replace, so that a blue arrow icon is displayed next to the cursor. The data is replaced in the visualization and displayed.
To remove data from the visualization, click and drag an attribute or metric from the visualization's Editor panel onto the All Objects panel.
You can add filters for the displayed sheet to the dashboard, or remove them, as follows:
To add a filter, from the All Objects panel, click the dataset object to create the filter from, and drag it onto the Filter panel.
To remove a filter, click and drag the name of the filter from the Filter panel onto the All Objects panel.
You can display an object from the All Objects in a text field or use it to create a filter for a specific visualization. For steps, see Adding a project's dataset objects directly to a dashboard.
When you add objects from the All Objects panel to the dashboard, a dataset containing each object is automatically added to the dashboard and displayed in the Datasets panel. The dashboard is given the same name as the project whose dataset objects it contains. For additional information about this dataset, as well as a general overview of creating, editing, and deleting datasets in a dashboard, see About datasets in Visual Insight.
After you add an object from the All Objects panel to the dashboard, you can use the object to create derived attributes and derived metrics, and groups of attribute elements. (You create derived objects from the Datasets panel or a visualization's Editor panel, not directly from the All Objects panel.)
Dashboard Editor: Datasets panel
Dashboard Editor: Editor panel
Dashboard Editor: Filter panel
Dashboard Editor: Visualization Gallery
_____________________________
Copyright © 2019, Oracle and/or its affiliates. All rights reserved.
Legal Notices