Understanding the Coverage Report in Performance Analyzer
By default, when you run the uncover command on the coverage directory, the coverage report opens as an experiment in Oracle Developer Studio Performance Analyzer. This section describes Performance Analyzer interface that displays the coverage data.
For more information about Performance Analyzer, see the integrated help and Oracle Developer Studio 12.6: Performance Analyzer.
Overview Screen
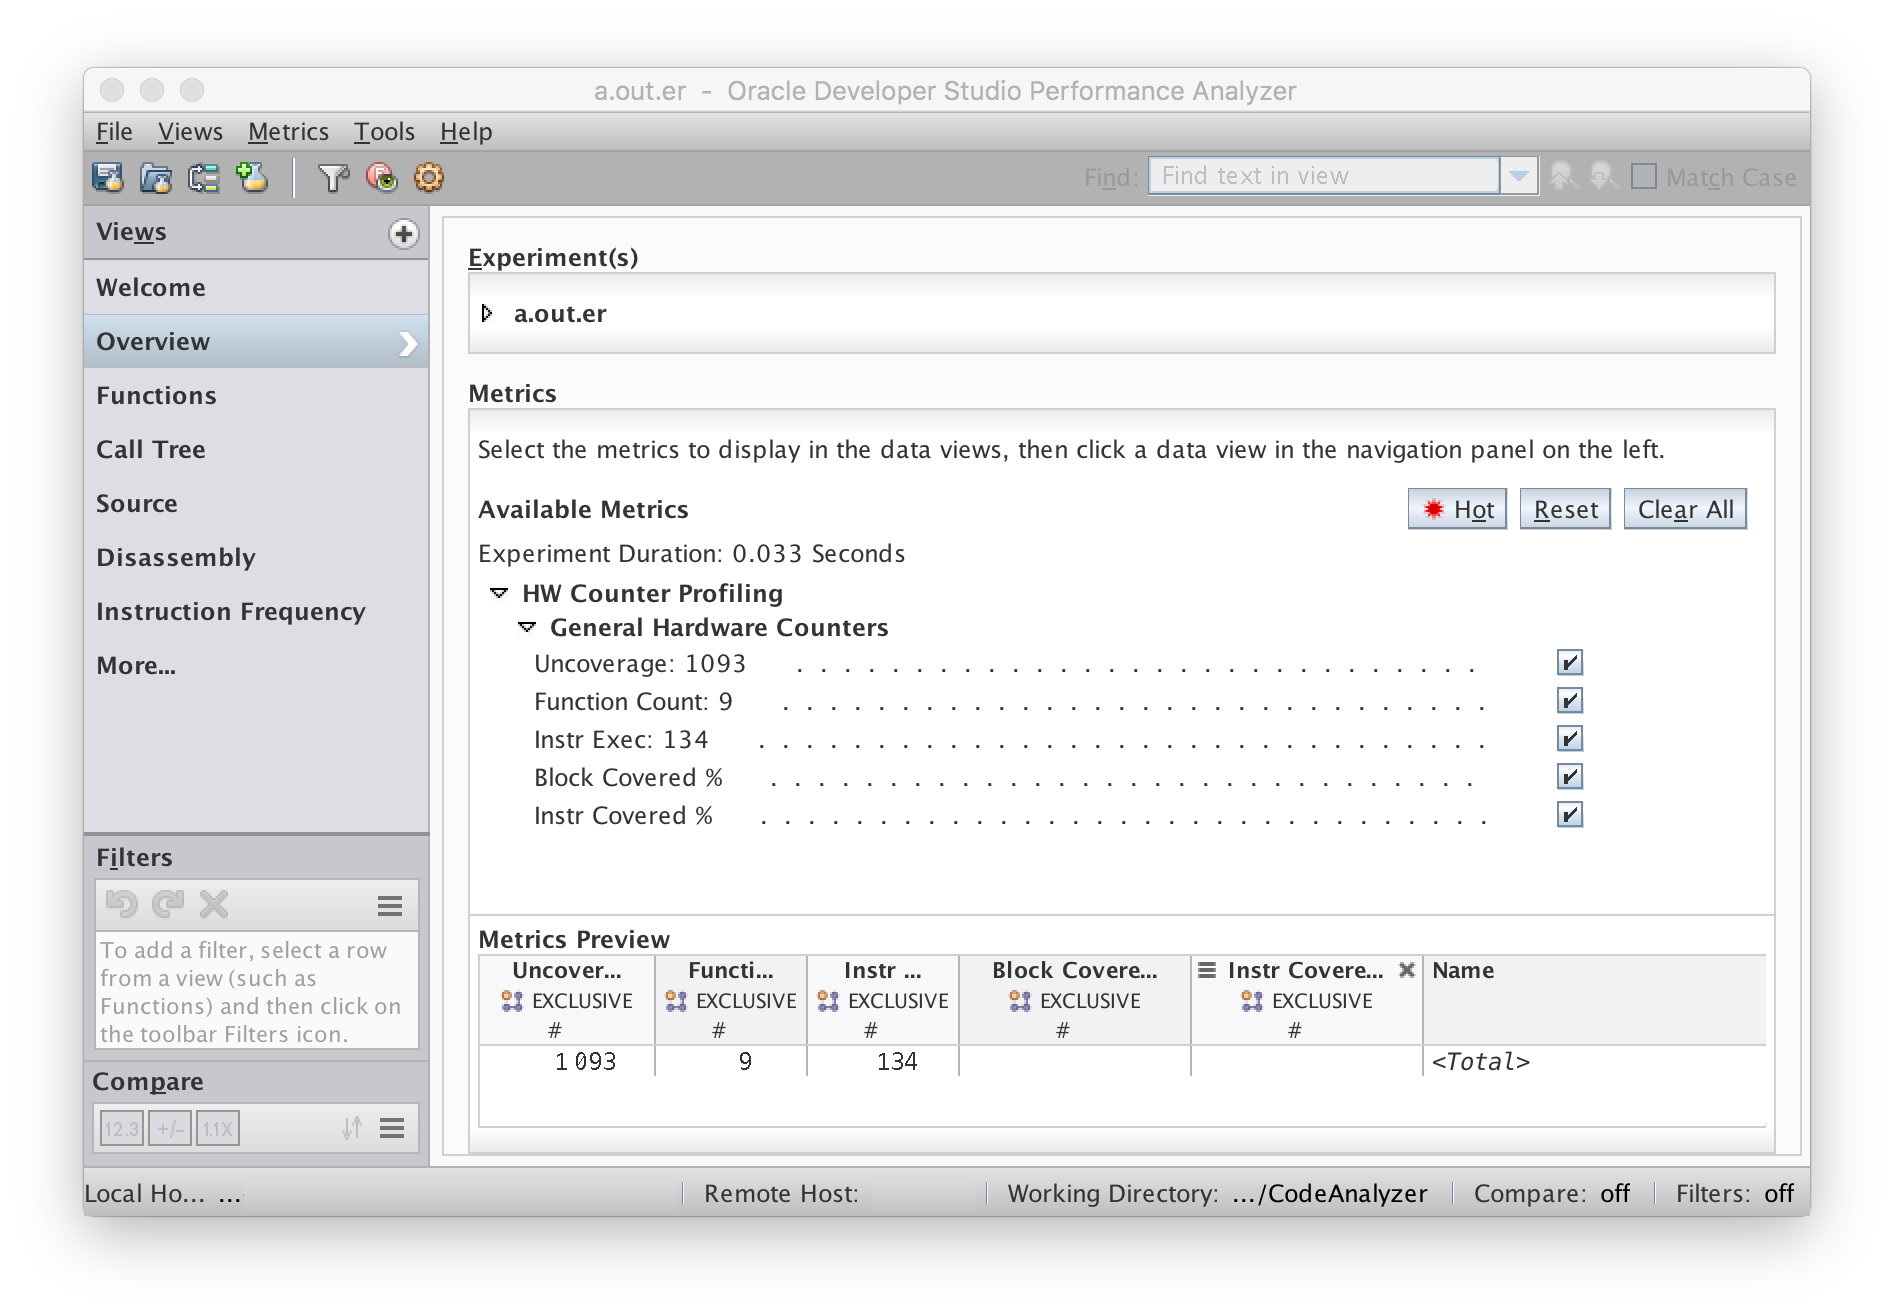
When you open the coverage report in Performance Analyzer, the Overview screen is displayed. This view shows the Experiment(s) that you are running, the Metrics of the experiment, and the Metrics Preview.
The following figure shows the Overview screen in Performance Analyzer.
Functions View
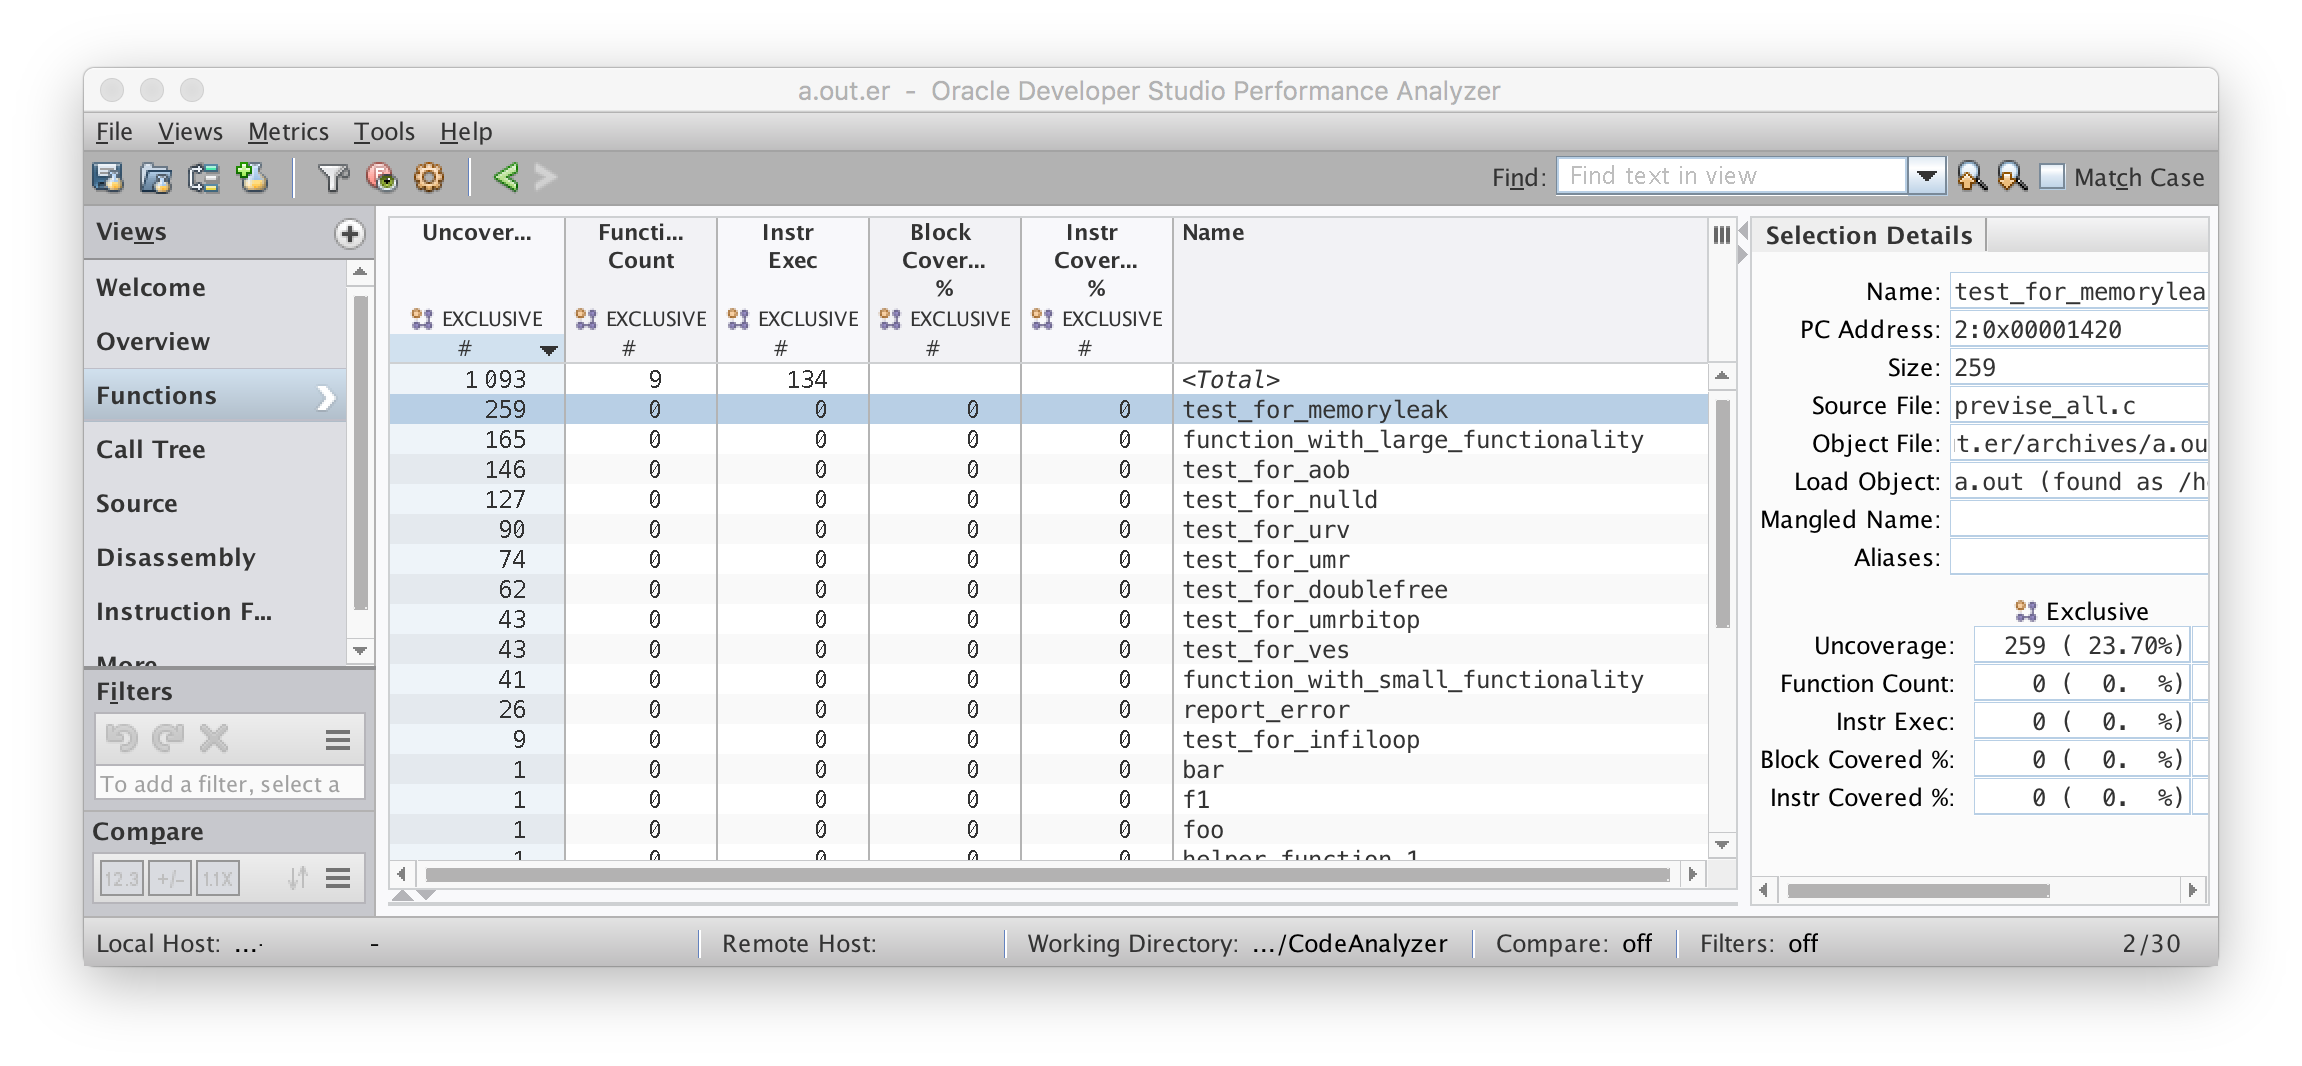
In the navigation panel, click the Functions view to display the program's functions and exclusive metrics. To sort the data according to the value of a particular metric, click the desired column header. Clicking the arrow under the column header reverses the sort order.
The metrics include the following:
- Uncoverage
-
Uncoverage counter, indicating the number of bytes that can be covered for the function.
- Function Count
-
Function counter, indicating which functions are covered.
- Instr Exec
-
Instr-Exec counter, indicating if an instruction was executed in a function.
- Block Covered %
-
Block covered % counter, indicating the percentage of blocks covered in a function.
- Instr Covered %
-
Instr covered % counter, indicating the percentage of instructions covered in a function.
The following figure shows a coverage report in Performance Analyzer, sorted by Uncoverage.
Uncoverage Counter
The Uncoverage counter is a very powerful feature of uncover. If you use this column as the sort key in decreasing order, the top functions in the display are the functions that offer the greatest potential to increase coverage. In the previous figure, the test_for_memory_leak() function is at the top of the list because it has the largest number in the Uncoverage column.
The Uncoverage number for the test_for_memory_leak() function is number of bytes of code that could potentially be covered if a test is added to the suite that causes the function to be called. The amount that coverage would actually increase varies according to the structure of the function. If no branches are in the function, and all the functions it calls are also straight line functions, then coverage will increase by the stated number of bytes. However, the coverage increase usually is less than the potential, perhaps much less.
The uncovered functions with non-zero values in the Uncoverage column are called root uncovered functions, meaning that they are all called by covered functions. Functions that are called only by non-root uncovered functions do not have their own Uncoverage numbers. It is presumed that these functions will be either covered or revealed as uncovered, in subsequent runs as the test suite is improved to cover the high-potential uncovered functions.
The coverage numbers are non-exclusive.
Function Count
The Function Count column reports the covered functions and uncovered functions. If the count is zero, the function is not covered. If the count is non-zero, the function is covered. If any instruction in the function is executed, the function is considered to be covered.
You can detect non-top-level uncovered functions in this column. If both the Function Count and Uncoverage columns state zero, then the function is not a top-level covered function.
Instr Exec Counter
The Instr Exec counter displays the covered instructions and uncovered instructions. A zero count means that the instruction is not executed; a non-zero count means that the instruction is executed.
In the Functions view, this counter shows the total number of instructions executed for each function. This counter also appears in the Source view and the Disassembly view.
Block Covered % Counter
For each function, the Block Covered % counter, which displays the percentage of basic blocks in the function that are covered. This number indicates how well the function is covered. Disregard this entry in the Total row; it is the sum of percentages in the column and is meaningless.
Instr Covered % Counter
For each function, the Instr Covered % counter displays the percentage of instructions in the function that are covered. This number indicates how well the function is covered. Disregard this entry in the Total row; it is the sum of percentages in the column and is meaningless.
Source View
If you compiled your binary with the –g option, the Source view displays the source code of your program. Because uncover instruments your program at the binary level and you have compiled the program with optimization, the coverage information in this view can be difficult to interpret.
The Instr Exec counter in the Source view shows the total number of instructions executed for each source line, which is essentially the statement-level code coverage information. A non-zero value implies that the statement is covered; a zero value means that the statement is not covered. Variable declarations and comments have no Instr Exec counts.
The following figure shows an example of the Source view opened.
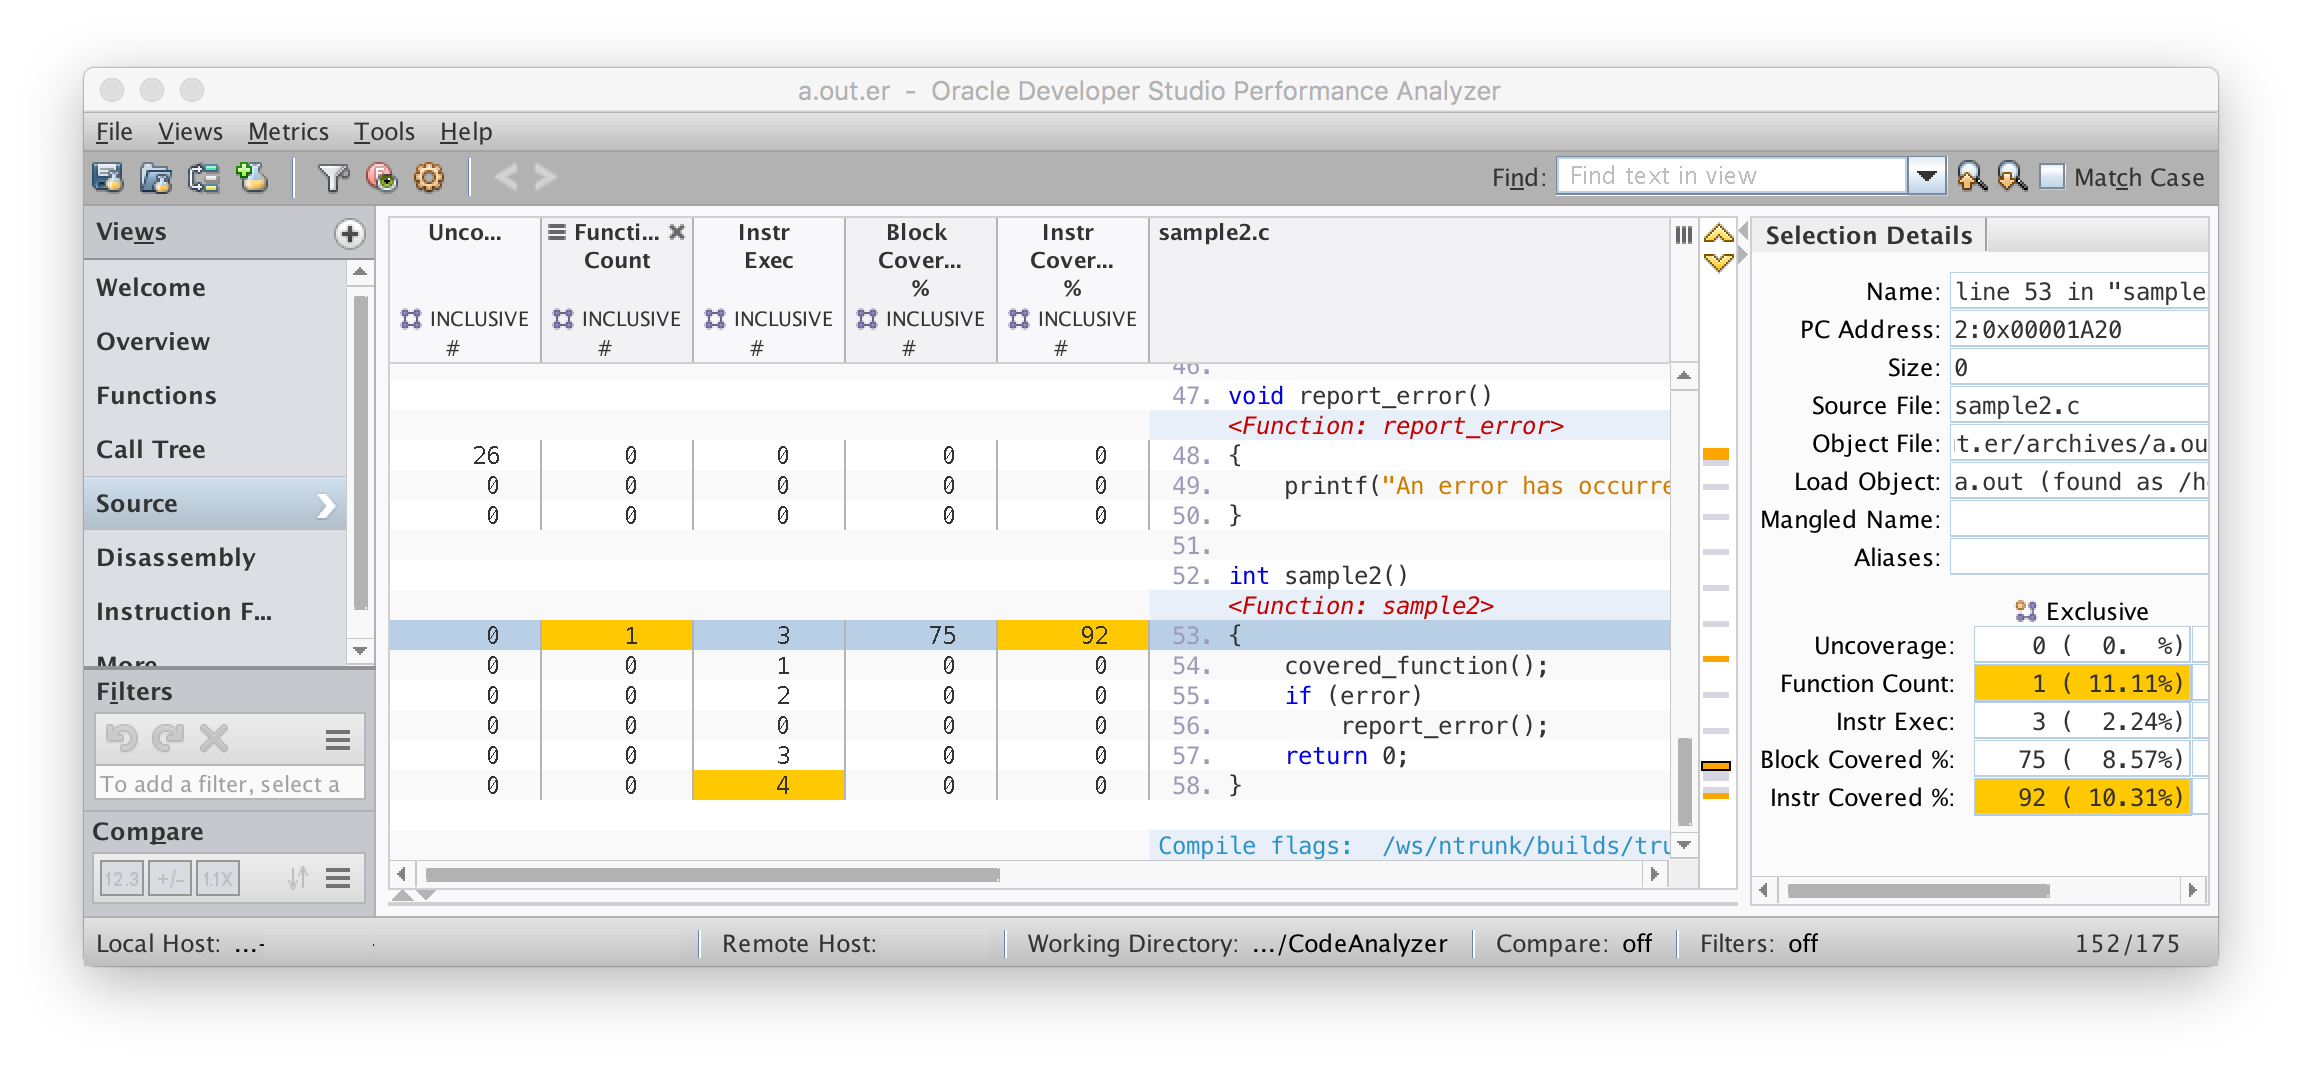
For source code lines that do not have any coverage information associated with them, the rows are blank and have no numbers in any of the fields. These empty rows can occur because of the following reasons:
-
Comments, blank lines, declarations, and other language constructs do not contain executable code.
-
Compiler optimizations have deleted the code corresponding to the lines due to either of the following reasons:
-
The code will never be executed (dead code).
-
The code can be executed but is redundant.
-
For more information, see Limitations When Using uncover.
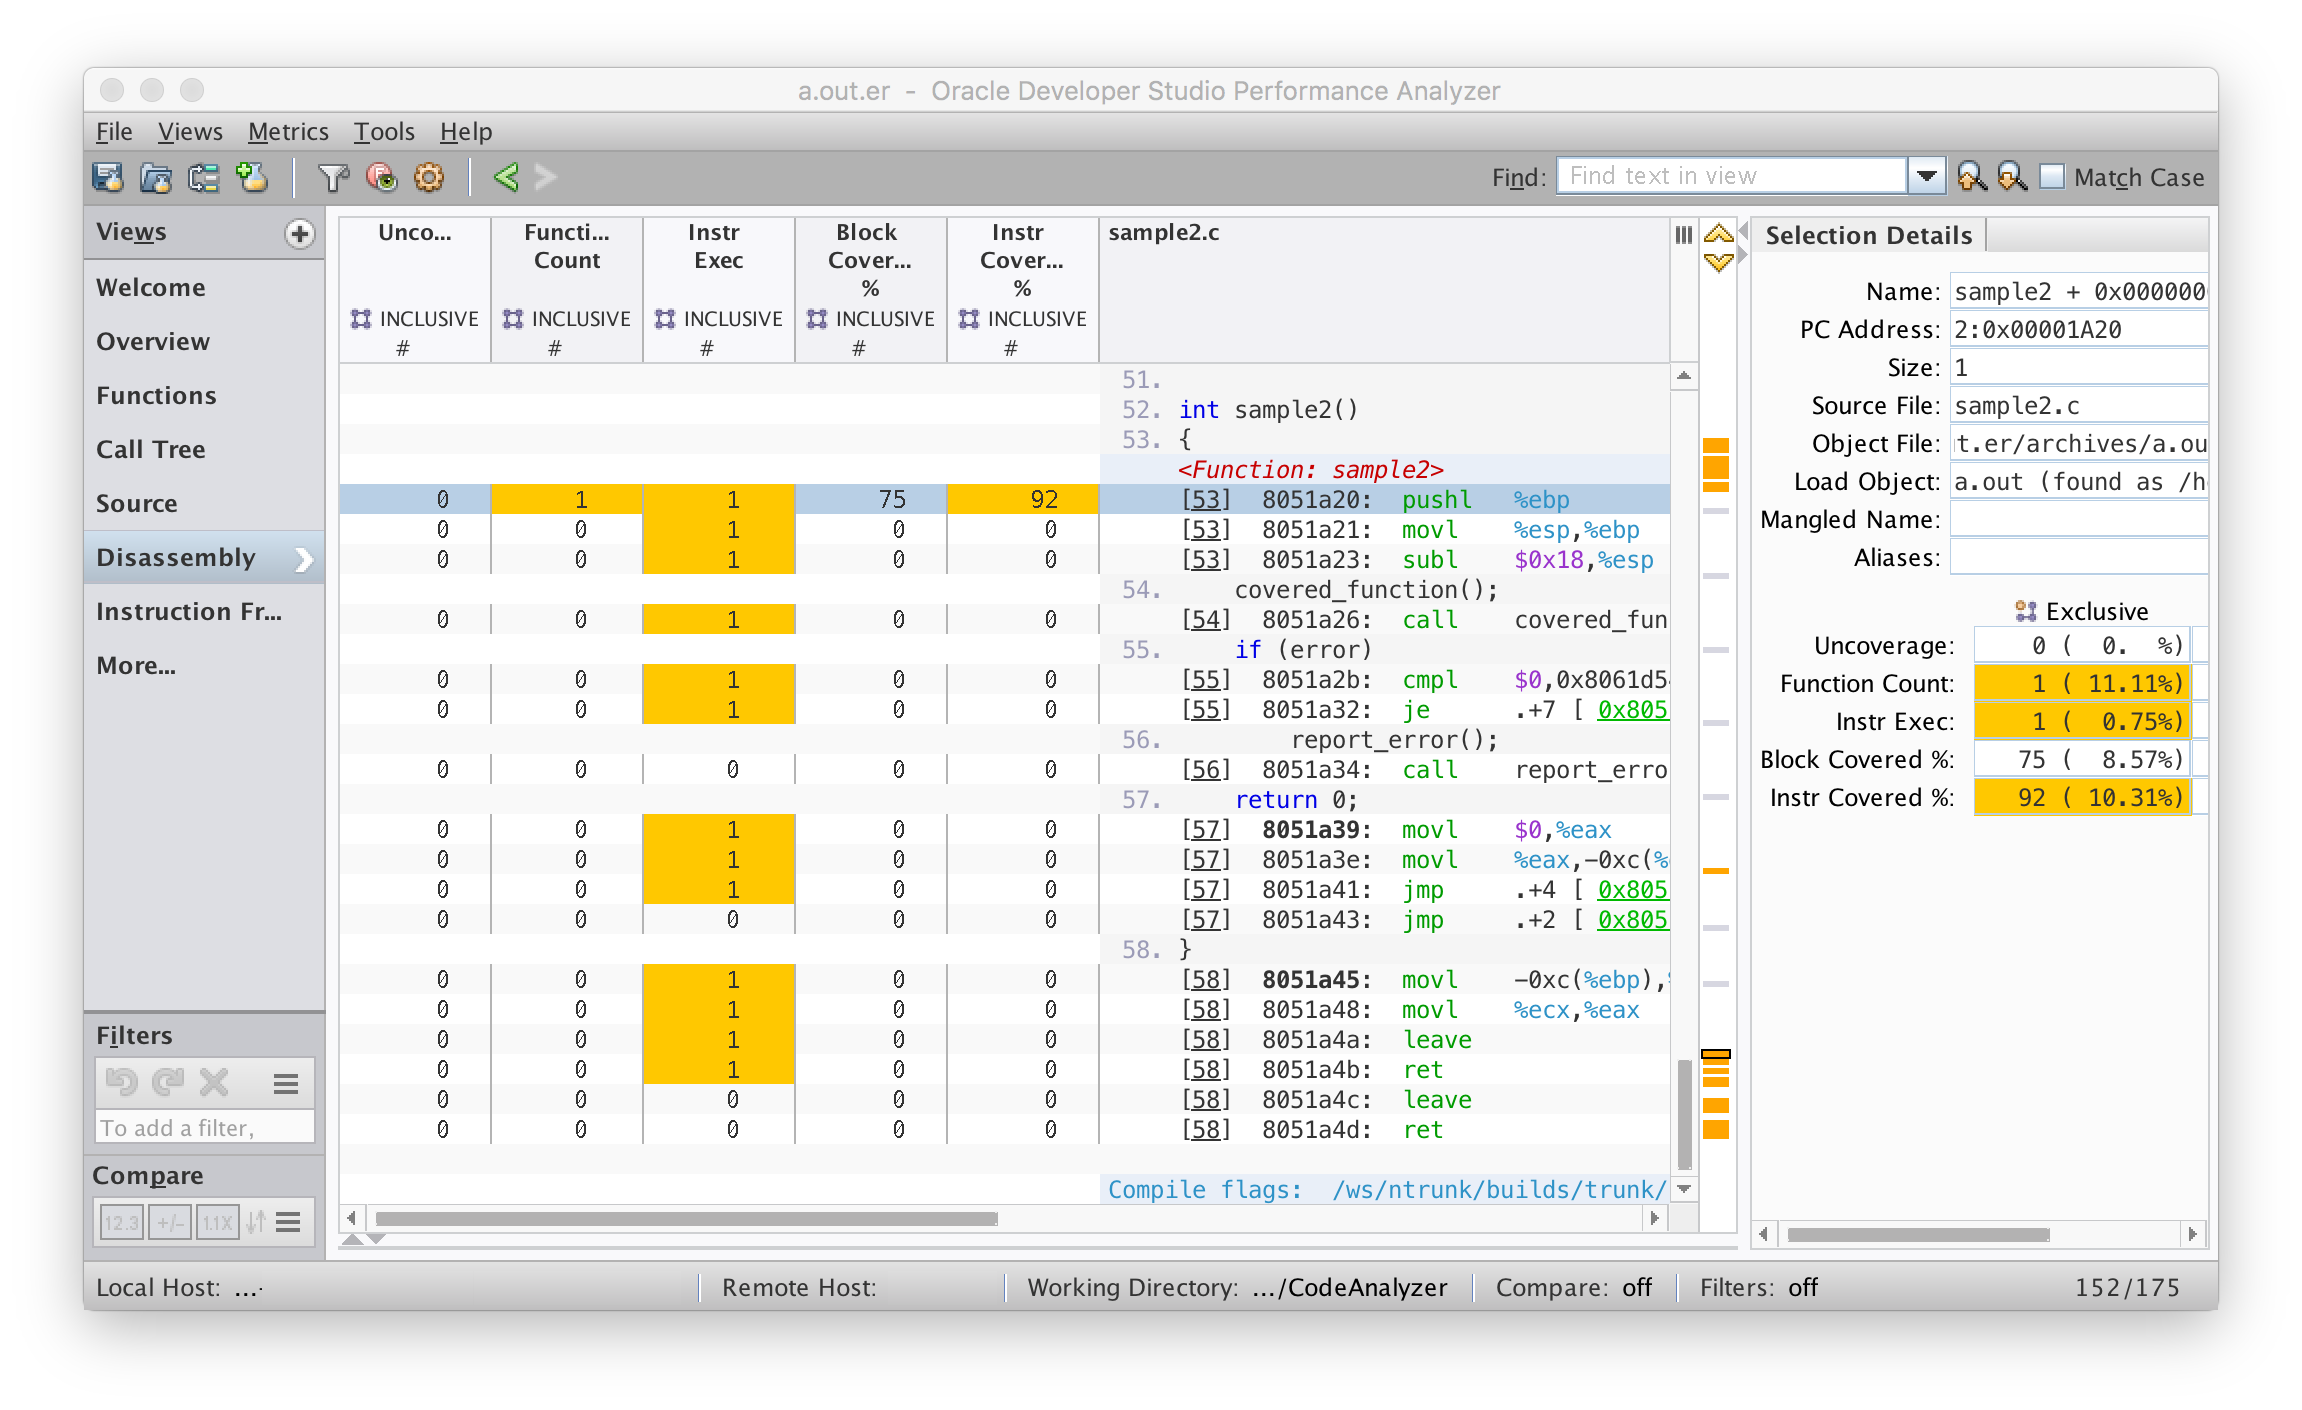
Disassembly View
If you select a line in the Source view and then select the Disassembly view, Performance Analyzer tries to find the selected line in the binary and display its disassembly.
Tip - If you do not see Disassembly in the Views pane, then select More Views... and check the Disassembly option.
The Instr Exec counter in this view shows the number of times each instruction was executed:
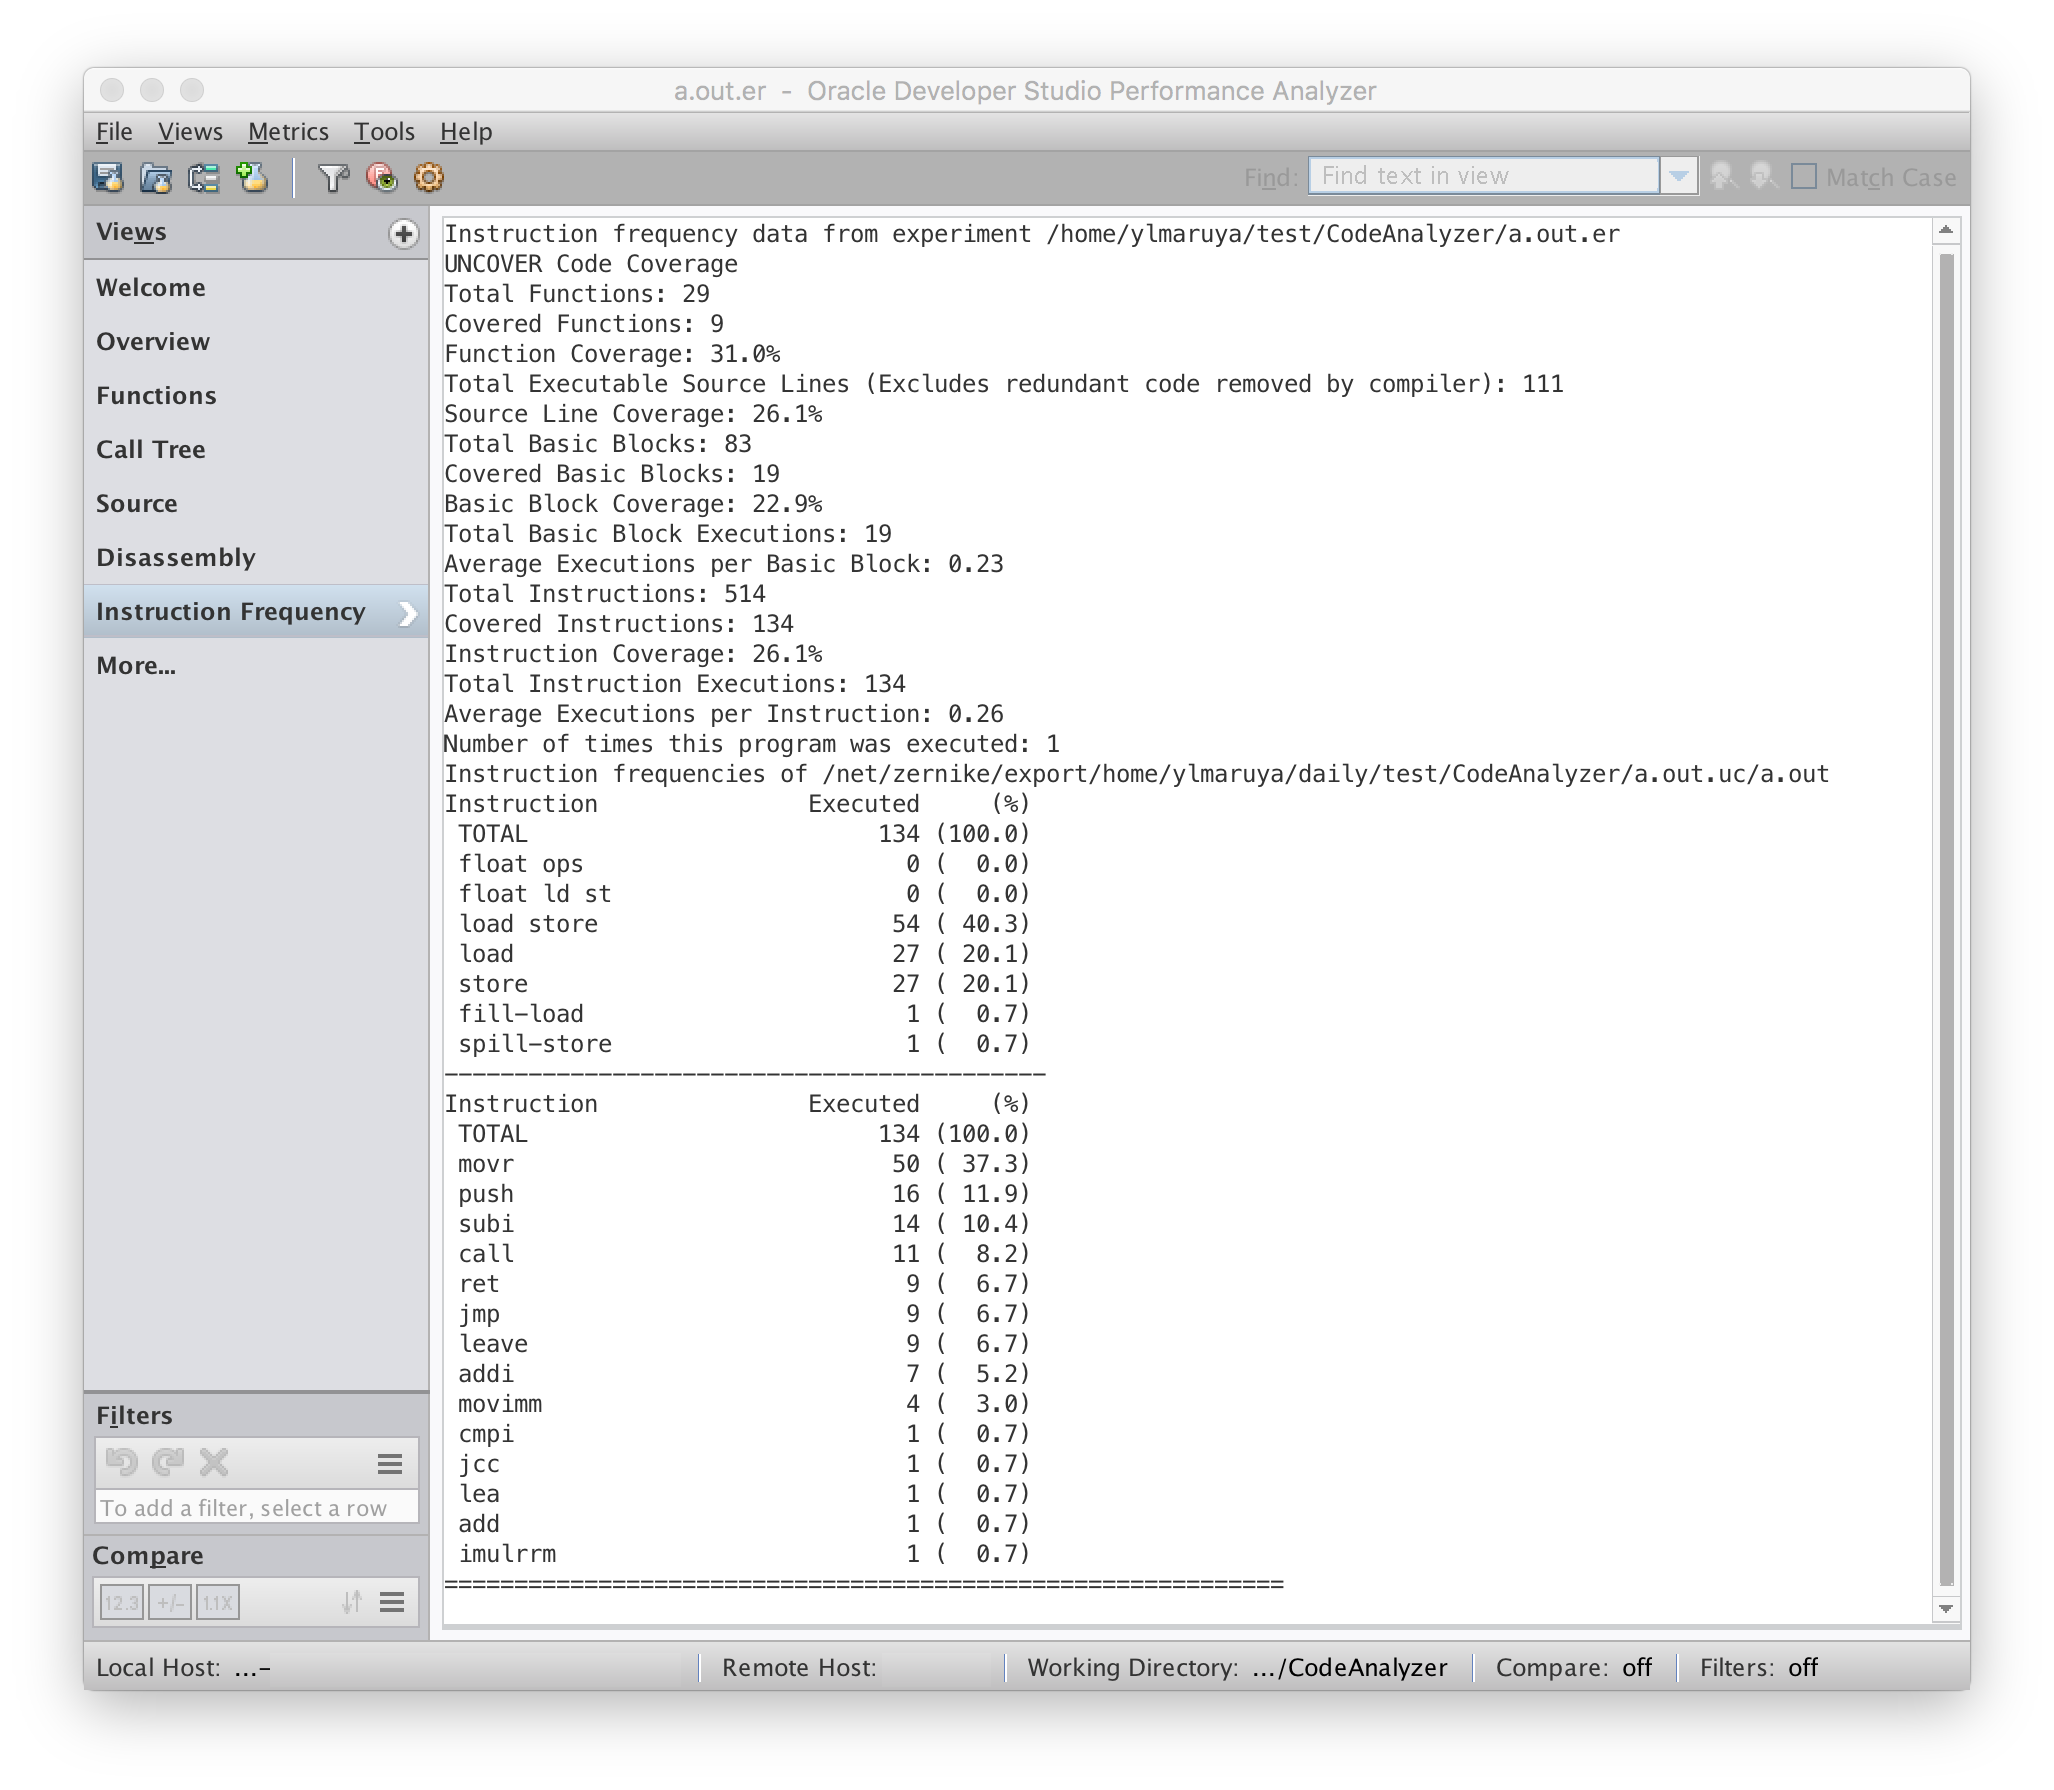
Instruction Frequency View
The Instruction Frequency view displays the overall coverage summary:
