Using the PeopleSoft Fluid User Interface to Perform Manager Tasks
This topic provides an overview on how to view manager reporting structures and discusses how managers use the My Team fluid pages to view team information and perform manager actions.
The My Team pages allow managers to see at glance a broad range of human resources information for their direct line reports, including job information, contact information, leave balances, performance data, and compensation data.
For information about who is considered part of a manager’s team, see Understanding Direct Reports.
For general information about fluid pages in PeopleSoft HCM, see Understanding PeopleSoft Fluid User Interface Home Pages.
The following videos provide an overview and demonstration of the PeopleSoft Fluid User Interface:
PeopleSoft Fluid User Interface Experience in HCM
Image Highlights, PeopleSoft HCM Update Image 26: Fluid Manager Self Service -- Profile Management
|
Page Name |
Definition Name |
Usage |
|---|---|---|
|
HC_HR_DR_TEAM_FLU_GBL (this is the cref for the tile) |
Click this tile to access a group of fluid pages that are used to perform manager tasks. |
|
|
HR_DIRTEAM_FLU |
View summary information about your teams that report to you directly or indirectly. |
|
|
HR_MGR_SEL_FLU |
Search for and select one of your reporting managers in order to view the summary information for that manager’s team. |
|
|
HR_DIRTEAM_EP_FLU |
View performance information for a team. |
|
|
HR_DIRTEAM_EC_FLU |
See how employees fit into the salary range for their jobs. |
|
|
HR_DIRTEAM_AB_FLU |
View leave balances for team members. |
|
|
Leave Balances - View Details Page Leave Balances - View More Balances Page |
HR_DT_LEAVE_SCF |
View detailed information about leave balances, including the balance and the as-of date for each type of leave. |
|
PTPG_NUI_VWR |
View the performance verses the compensation data for your team. |
The My Team fluid pages enable you to browse reporting team structures by manager.
The PeopleSoft My Team pages enable higher-level managers to view summary information about their direct and indirect reports. When a manager accesses the My Teams pages, the page lists his or her direct reports. When the manager has a direct report that is also a manager, the My Team - Summary page will display the View My Team icon and the number of direct reports for that person, as well as all those that report up to that person, in the Directs/Total column or at the bottom of the card.
A manager can access the reporting structure of other employee’s within his or her reporting structure through various means:
Click the View My Team icon or number link to access that manager’s reporting structure.
Note: Available only from the My Team – Summary Pagepage.
Click the Change Team link at the top of the My Team pages.
Note: Available at the top of all My Team pages.
Image Highlights, PeopleSoft HCM Update Image 17: Manager View As Feature
Use the My Team tile to access a group of fluid pages that are used to perform manager tasks.
Navigation
Select Fluid Home under the main menu. On the page that appears, select Manager Self Service. The My Team tile is available on the Manager Self Service landing page.
As a manager, you can add the tile, through personalization, to a system-delivered home page or a home page that you create.
Image: My Team tile
This example illustrates the My Team tile.
Click the tile to access the My Team page and navigate to these manager self-service transactions easily without using traditional menu navigations:
View employee summaries
Review employee performances
See employee compensation
Check leave balances
View related information, such as pivot grids analytics.
Use the My Team – Summary page (HR_DIRTEAM_FLU) to view summary information about your teams that report to you directly or indirectly.
The My Team – Summary page has two viewing modes: a grid view and a card view. The card view displays information in a business card format, with different information on the front and back of the card.
Navigation
Click the My Team tile on the Manager Self Service home page, or click the Summary touch point on the My Team page.
Image: (Tablet) My Team - Summary page: grid view
This example illustrates the grid view on the My Team - Summary page for the tablet.
Note: The grid view is not supported on smartphones.
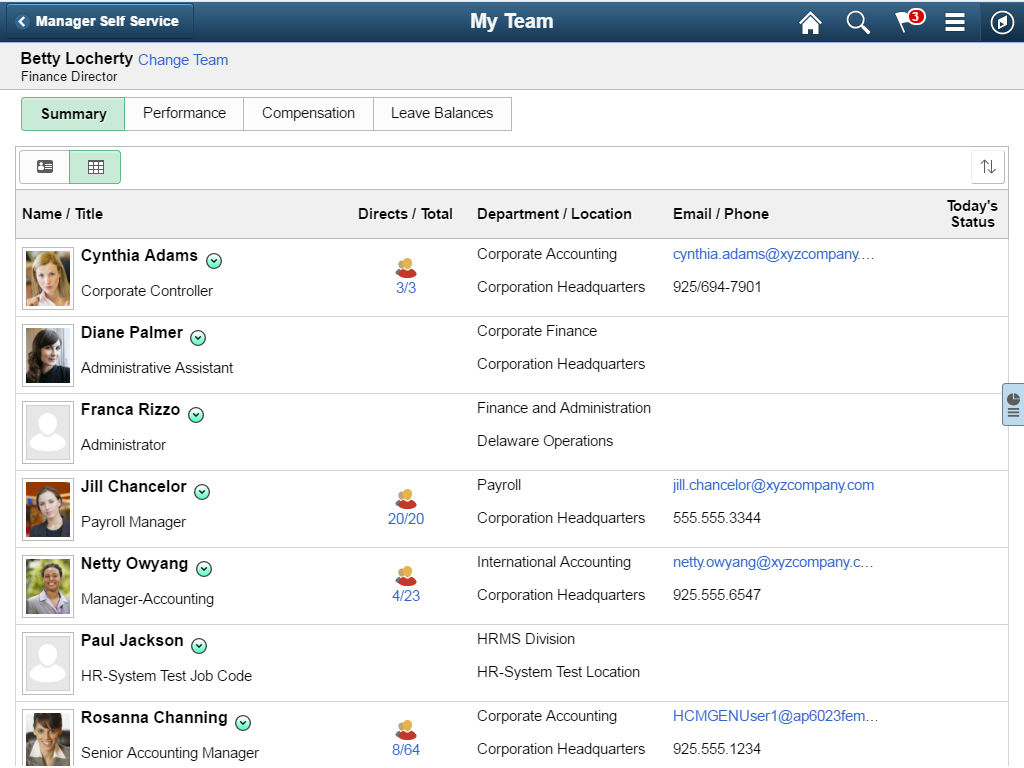
Image: (Tablet) My Team - Summary page: card view
This example illustrates the card view on the My Team - Summary page for the tablet. This example displays both the front of the card (with the employee photo and contact information) and the back of the card (with performance and compensation information).
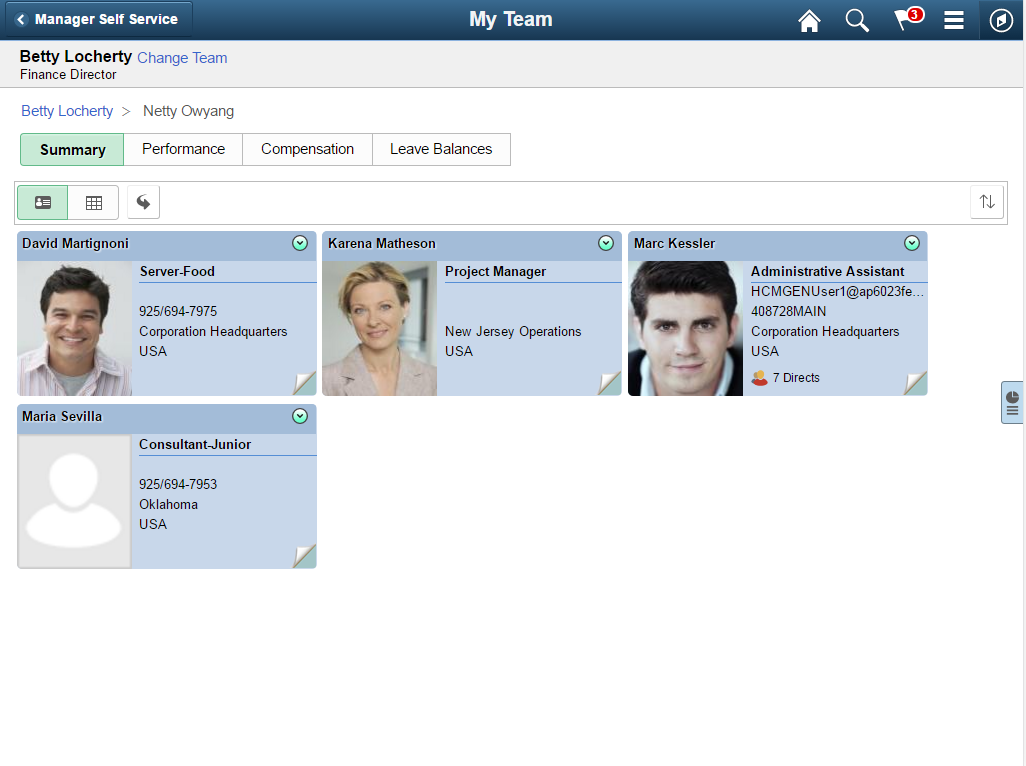
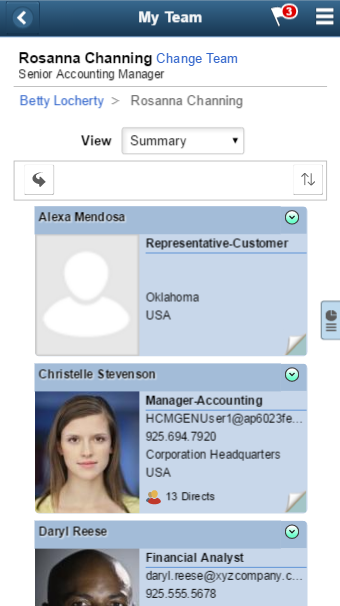
Image: (Smartphone) My Team - Summary page: card view
This example illustrates the card view on the My Team - Summary page for the smartphone.
Note: Information on this page is similar to the information on the Direct Line Reports Pagelet on the Summary, Contact, and Performance tabs.
Header Information
|
Field or Control |
Definition |
|---|---|
| Team of |
Displays the name and title of the manager of the team you are viewing. Click the Change Team link to change the manager. When you are viewing the team of one or your reporting managers, breadcrumbs at the top of the page show the reporting hierarchy between you the user and the currently displayed manager’s team. Click the user names in the breadcrumbs to view the team of one of the other managers. |
| Change Team |
Select this link to access the Select Manager Page and select a manager to change the team view. This allows you to view the team of any of the managers that report up through you. |
| View |
(Smartphones) This field is applicable when the page is viewed with small form factor devises and work the same as the large form factor touch points. Click to select and access a specific My Team page (touch point). The pages that are available for selection are Summary, Compensation, Performance, and Leave Balances. |
Data Sources
PeopleSoft HR Administer Workforce provides most of the information on the My Team - Summary page, including name, contact information, job information, and reporting relationship.
PeopleSoft ePerformance provides the performance-related information that appears on the back of the card view.
Information for the Today’s Status column comes from PeopleSoft Absence Management, Time and Labor, HR Administer Training, and Enterprise Learning Management.
Summary Views
|
Field or Control |
Definition |
|---|---|
 (Card View) (Card View) |
Click the Card View icon to display team member information in a business card format. The front of the card displays a photo of the team member (if available) along with general information such as name, job title, email address, and phone number, and location. The back of the card displays performance and compensation information and the team member’s work status for the day: The card view is the default mode on small form factors (phones). |
 (Grid View) (Grid View) |
Click the Grid View icon to display team member information in a grid format. The grid shows the same information as the front of the card. It also shows the team member’s department and an icon that represents the team member’s work status for the day. The grid view is the default mode on large form factors (tablets, desktops, and laptops). |
 (Show Back of All Cards) (Show Back of All Cards) |
When the card view is active, click this icon to show the back of all cards. This icon is not visible from the grid view. |
 (Show Front of All Cards) (Show Front of All Cards) |
When the card view is active, click this icon to show the front of all cards. This icon is not visible from the grid view. |
 (More Information This Card) (More Information This Card) |
When the card view is active, this icon appears at the bottom right corner of individual cards. Click this icon to flip over the card. |
 (Sort) (Sort) |
Click this icon to change the sort order of team members. You can sort by any field shown except by direct reports. |
Name/Title
|
Field or Control |
Definition |
|---|---|
 Related
Action Menu icon Related
Action Menu icon |
Click the related actions menu icon to display a drop-down menu of self-service transactions. These links provide the manager quick access to self service transactional pages. |
When using Position Management and you have enabled the system to show empty positions, the Name/Title column will display the text Empty Position and the position number.
Image Highlights, PeopleSoft HCM Update Image 19: Displaying Empty Position within My Teams
Reporting Hierarchy
|
Field or Control |
Definition |
|---|---|
 (View My Team) (View My Team) |
This icon appears in all views for team members who have direct reports. In all views, the number of direct reports appears next to the icon. The grid view and the back of the card view additionally display the total number of reports in the reporting hierarchy. Click the icon (or the number of reports) to drill down the reporting hierarchy. As you drill down:
|
Today’s Status
The Today’s Status field on the grid view (and on the back of the card) indicate where an employee is today. The column displays only one icon to indicate the employee schedule for the day, even if more than one schedule applies. There are five icons. The system determines which icon to display using this priority sequence:
|
Field or Control |
Definition |
|---|---|
 (planned absence) (planned absence) |
Indicates that the employee has a planned absence for today. |
 (holiday) (holiday) |
Indicates that the employee is on a holiday break today. |
 (off) (off) |
Indicates that the employee is not scheduled to work today based on the employee’s holiday schedule in Job Data. |
 (training) (training) |
Indicates that the employee is in training today. Information is obtained from ELM or HR Training. |
 (no show) (no show) |
Indicates that the employee did not show up to work today when he or she is scheduled to work. |
Supplementary Panel for the My Team Pages
If you use PeopleTools 8.57 or later, the My Team pages includes a supplementary panel that provides access to related information and simplified analytics to help managers complete their transactions.
For more information about simplified analytics, see product documentation for PeopleTools: Pivot Grid, “Working with Simplified Analytics.”
These videos demonstrate simplified analytics:
Navigation
Click the Supplementary Panel tab button on any of the My Team pages.
Image: (Tablet) Supplementary Panel for the My Team Pages
This example illustrates the Supplementary Panel content for the My Team pages for the tablet.
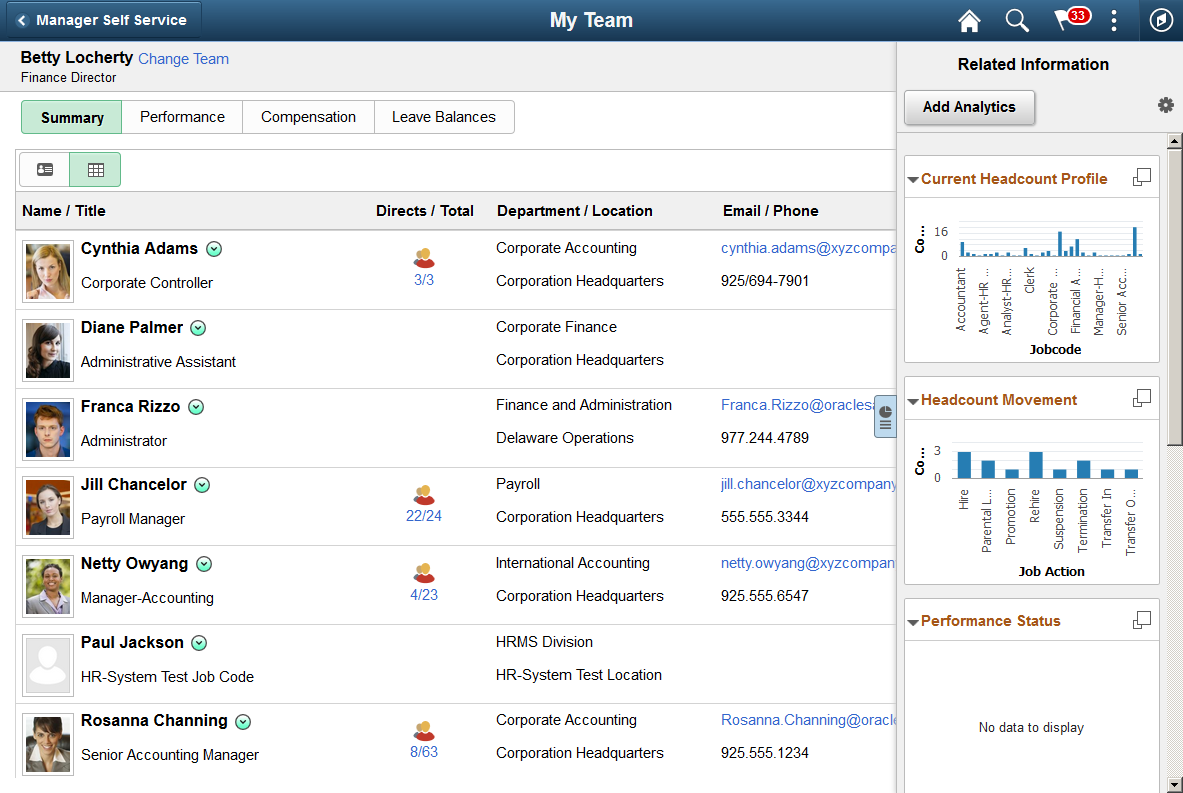
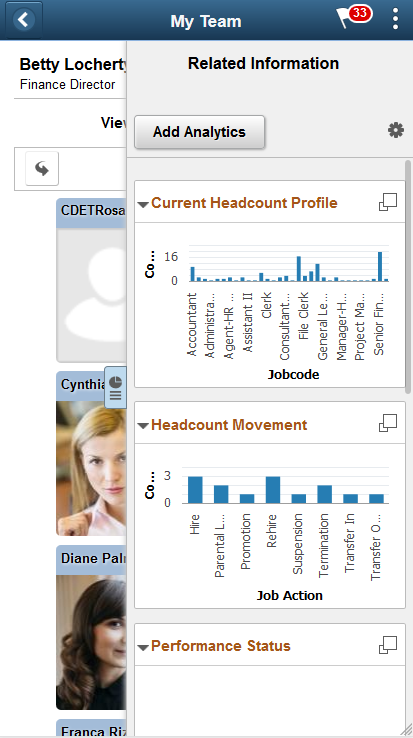
Image: (Smartphone) Supplementary Panel for the My Team Pages
This example illustrates the Supplementary Panel content for the My Team pages for the smartphone.
|
Field or Control |
Definition |
|---|---|
 (Supplementary Panel tab) (Supplementary Panel tab) |
Click this tab to open the Related Information panel and view related information. |
| Add Analytics |
Click to create their own helpful charts and graphs, available with PeopleTools 8.55 and later. Click this button to create a new chart. When you select to add a new analytic report, the system opens the Create Analytics page where you will use the Analytics Wizard to guide you through the process of creating a new report. The system uses templates based on the manager transaction page from which you are creating the new report. Select different My Team touch point pages to select from various template options. The templates determine the fields and prompts in the next step of the wizard. The delivered role PivotGridSuperUser gives users the ability to create and publish reports. |
 [Personalize RC (Related Content) icon] [Personalize RC (Related Content) icon] |
This icon appears at the top of the Related Information panel. Click to open the Personalize page. This page lists the available related content so you can choose whether the Related Information panel shows or hides each item. |
 (Display <Related
Content Item> in Modal Window icon) (Display <Related
Content Item> in Modal Window icon) |
This icon appears at the top of each individual related content item in the Related Information panel. Click to expand the item to open a modal dialog with a larger interactive version of the content. |
| Related Information |
The Related Information panel displays touch friendly and responsive charts and information related to the content on the page. It displays simplified version of existing charts. These include:
Image Highlights, PeopleSoft HCM Update Image 18: Simplified Analytics For information on how to use the Related Information tab content and the Simplified Analytics Wizard, see PeopleTools: Pivot Grid, Viewing Pivot Grid Models, Viewing Pivot Grid Models in Fluid Mode. |
For information on how to use the Related Information panel (also known as the Unified Related Content Analytics pane), see PeopleTools: Pivot Grid, “Working with Simplified Analytics,” Accessing Simplified Analytics.
Use the Select Manager page (HR_MGR_SEL_FLU) to search for and select one of your reporting managers in order to view the summary information for that manager’s team.
Navigation
Click the Change Team link in the header of any of the My Team pages.
Image: (Tablet) Select Manager page
This example illustrates the Select Manager page for the tablet.
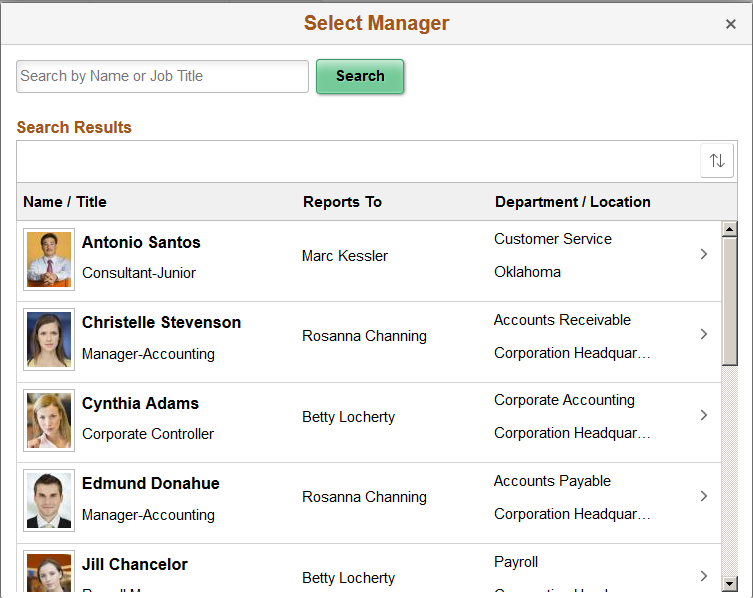
Image: (Smartphone) Select Manager page
This example illustrates the Select Manager page for the smartphone.
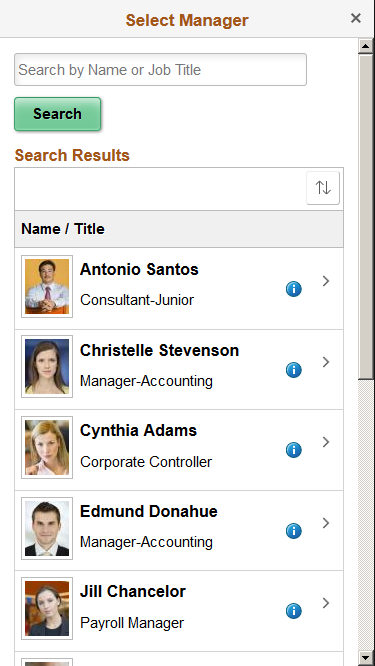
This page displays a list of all the managers that report up to you. Click a row to change the view to that manager’s team.
Use the My Team – Performance page (HR_DIRTEAM_EP_FLU) to view performance information for a team. The data comes from PeopleSoft ePerformance and HR Careers and Successions.
Navigation
Click the Performance touch point on the My Team page.
Image: (Tablet) My Team – Performance page
This example illustrates the My Team – Performance page for the tablet.
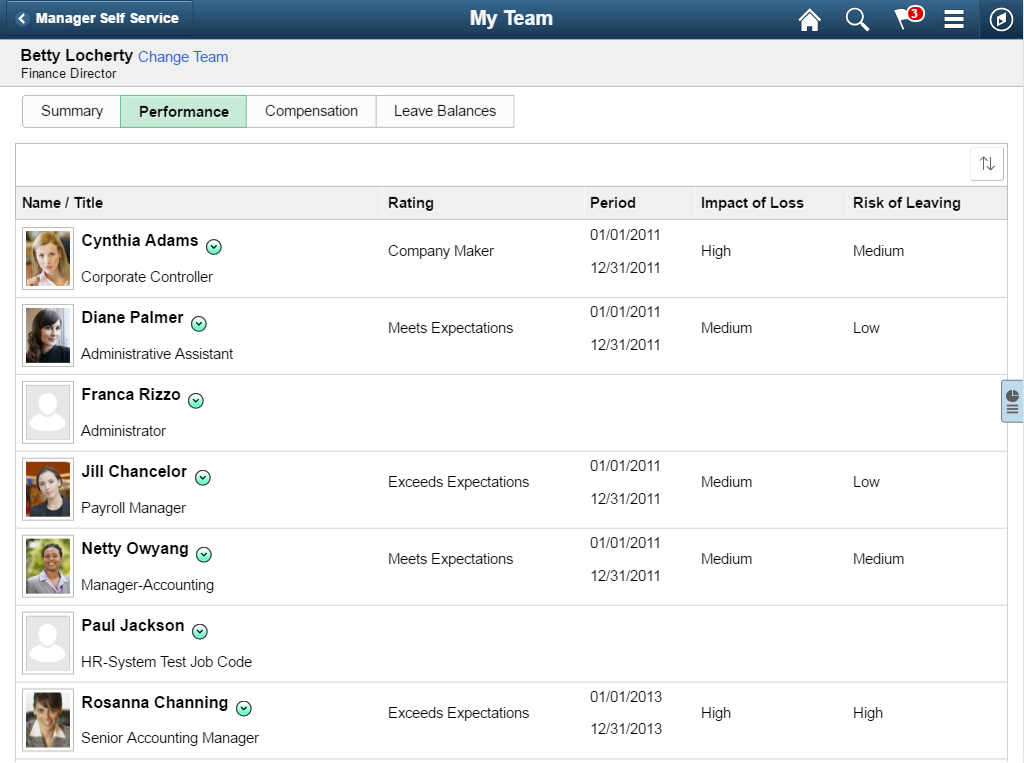
Image: (Smartphone) My Team – Performance page
This example illustrates the My Team – Performance page for the smartphone.
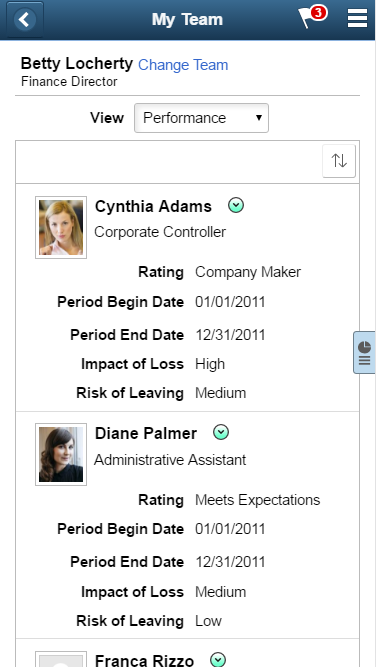
Note: Information on this page is similar to the information on the Performance tab of the Direct Line Reports Pagelet.
Performance Grid
|
Field or Control |
Definition |
|---|---|
| Impact of Loss and Risk of Leaving |
These columns are visible only if relevant data exists. |
|
Click this icon to change the sort order of team members. You can sort by any field shown |
Data Source
Performance data comes from PeopleSoft ePerformance. Specifically, the data is based on the most recent completed document of the type specified on the Assign Document Defaults Page. This is also the data shown on the back side of the card on the My Team - Summary page. If a default document type has not been specified, the My Team page does not provide a touch point for accessing the performance data.
Employee ratings are taken from the overall rating section of the performance document. If an employee does not have a completed performance rating from the specified document type, no performance rating information will be displayed in that individual’s row.
Use the Performance Document History Page, addressed in the Viewing Historical Documents topic, to view the performance document that contains the employee’s last rating.
Use the My Team – Compensation page (HR_DIRTEAM_EC_FLU) to see how employees fit into the salary range for their jobs.
Navigation
Click the Compensation touch point on the My Team page.
Image: (Tablet) My Team – Compensation page
This example illustrates the My Team – Compensation page for the tablet.
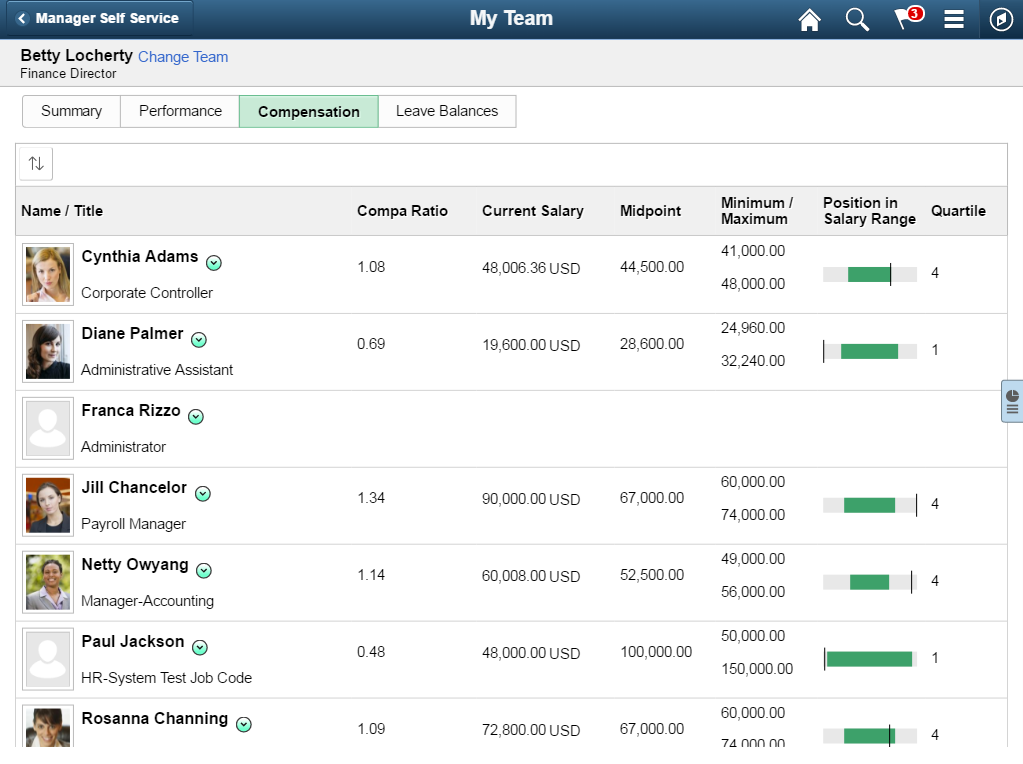
Image: (Smartphone) My Team - Compensation page
This example illustrates the My Team – Compensation page for the smartphone.
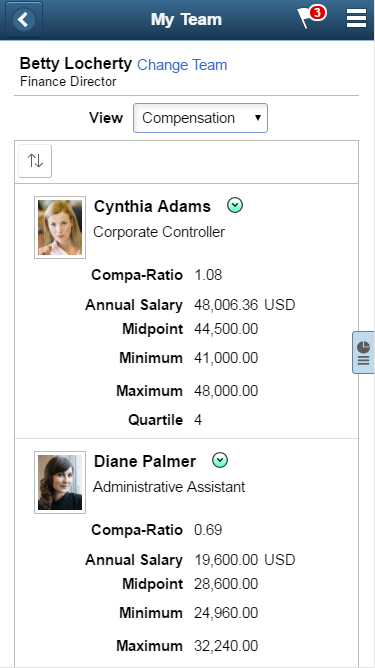
Note: Information on this page is similar to the information on the Compensation tab of the Direct Line Reports Pagelet.
Compensation Grid
|
Field or Control |
Definition |
|---|---|
 (Currency) (Currency) |
Click this icon to open a dialog box where you can choose whether to display salary information in each employee’s paid currency or in your own preferred currency (as identified in your user profile). This icon is visible only if at least one employee is compensated in a currency other than your own preferred currency. |
|
Click this icon to change the sort order of team members. You can sort by any field shown (except by the graphical column that shows the employee’s position within the salary range). |
| Position In Salary Range |
Displays a graphical representation of the data appearing in the grid. This column does not appear on the small form factor (phone) or in accessible mode. |
Data Sources
Compensation data comes from PeopleSoft HR Administer Workforce. Data for individuals comes from the job data tables, and midpoint data comes from salary plan data table.
Use the My Team – Leave Balances page (HR_DIRTEAM_AB_FLU) to view leave balances for team members.
Navigation
Click the Leave Balances touch point on the My Team page.
Image: (Tablet) My Team – Leave Balances page
This example illustrates the My Team – Leave Balances page for the tablet.
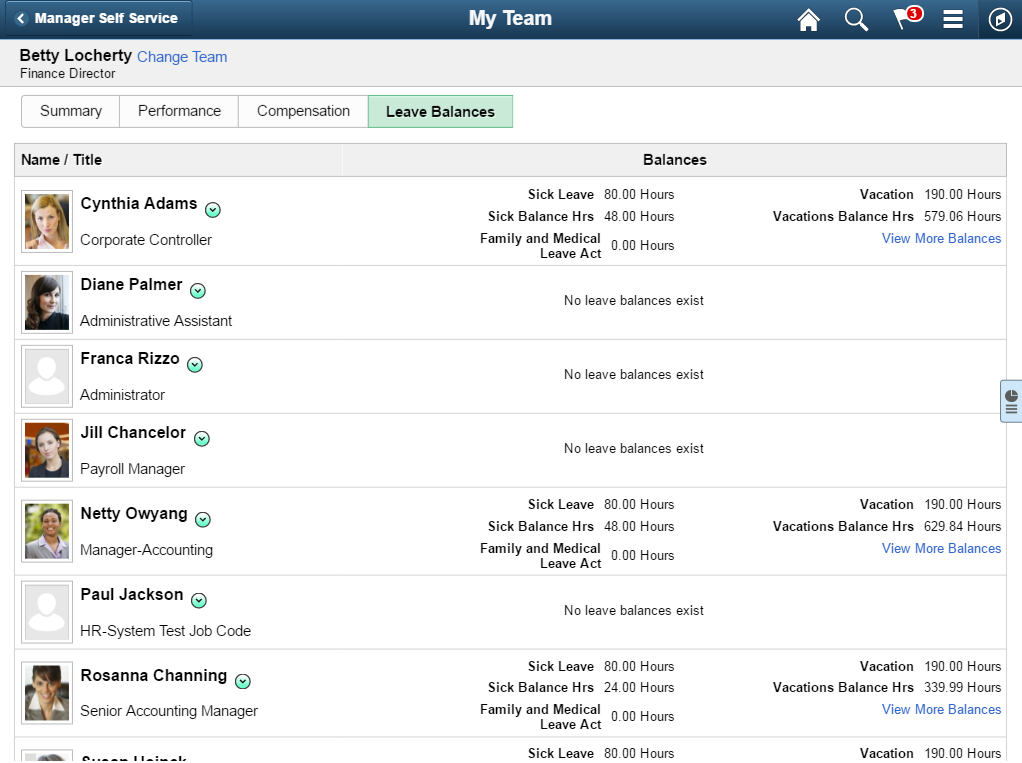
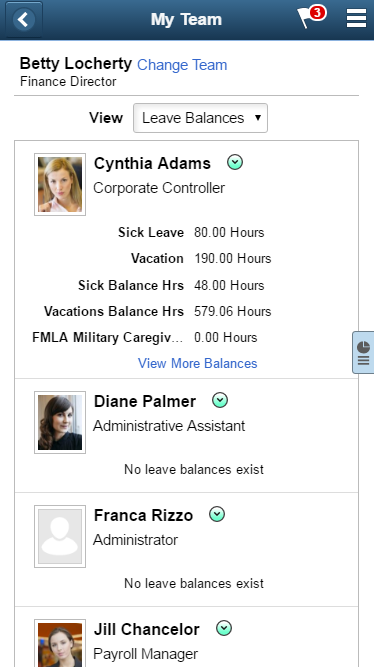
Image: (Smartphone) My Team – Leave Balances page
This example illustrates the My Team – Leave Balances page for the smartphone.
Note: Information on this page is similar to the information on the Time tab of the Direct Line Reports Pagelet.
The Leave Balances page always sorts employees by name.
|
Field or Control |
Definition |
|---|---|
| Balances |
Displays up to five leave balances for each team member. |
| View More Balances or View Details |
The View More Balances link appears after the fifth leave balance if an employee has more than five leave types. The View Details link appears if the employee has five or fewer leave types. Click either link to access the Leave Balances - View Details page, which displays all of the employee’s leave balances along with the as-of date for each balance. |
Data Sources
Leave balances come from PeopleSoft HR Base Benefits, if available, then from PeopleSoft Absence Management.
Data for compensatory time comes from PeopleSoft Time and Labor. An employee must be enrolled in Time and Labor to accrue compensatory time.
Use the Leave Balances - View Details or View More Balances page (HR_DT_LEAVE_SCF) to view detailed information about leave balances, including the balance and the as-of date for each type of leave.
Navigation
Click the View Details or View More Balances link on the My Team - Compensation page.
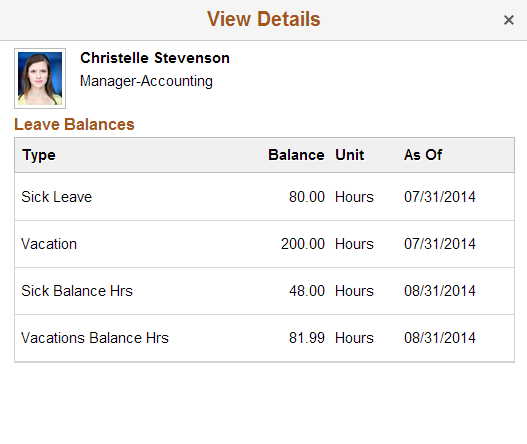
Image: Leave Balances - View Details page
This example illustrates the Leave Balances - View Details page for the tablet and smartphone.
|
Field or Control |
Definition |
|---|---|
| As Of |
Displays the end date of the last period of time for which the leave balance was calculated. |
Use the Performance vs. Compa-Ratio page (PTPG_NUI_VWR) to view the Performance v. Compa-Ratio chart and assess the performance and compensation data for your team.
This chart and grid provides managers a quick way to perform the following tasks for their teams:
Identify outliers within their team (i.e. individuals who are paid too little or too much relative to their performance).
Perform a manager self-service action on an individual.
Assess the performance and compensation data.
Navigation
Click the Supplementary Panel tab button on the My Team - Leave Balances page. To open a larger version of the grid in it’s own modal, click the Display Performance vs. Compa-Ratio in Modal Window icon.
Image: (Tablet) Performance vs. Compa-Ratio Pivot Grid
This example illustrates the fields and controls on the Performance vs. Compa-Ratio pivot grid for the tablet.
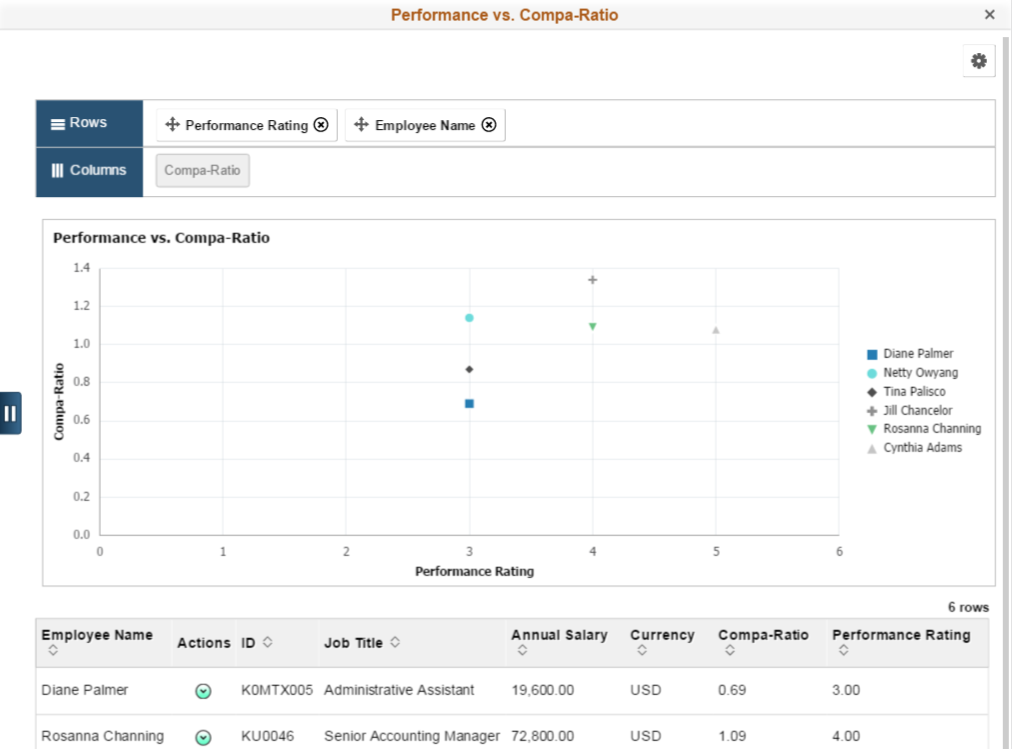
Image: (Smartphone) Performance vs. Compa-Ratio Pivot Grid
This example illustrates the fields and controls on the Performance vs. Compa-Ratio pivot grid for the smartphone.
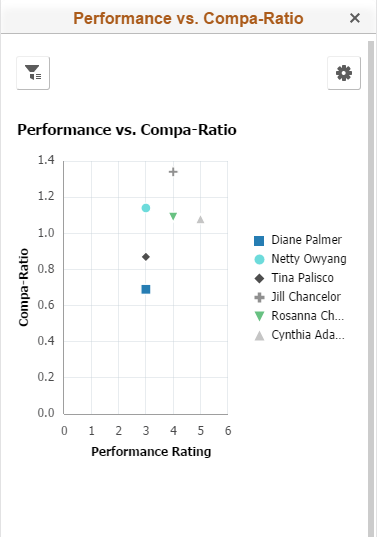
The PeopleSoft Fluid User Interface provides a scatterplot chart that enables managers to view compensation vs. performance data for their team members. This page populates the scatterplot chart with the current compa-ratio and the current overall performance evaluation rating of your direct reports. Direct reports that do not have a performance evaluations will not appear on this chart.
Note: Employees must have a performance rating that uses the default document type in order to appear on the chart. The system uses the document type linked to the My Team transaction, as specified on the Assign Document Defaults Page, when retrieving the most recent performance rating. If the administrator has not associated a document type with the My Team transaction on the Assign Document Defaults page, the My Team page will not display the Analytics tab, since the system will have no way of knowing which document type to look for when retrieving performance documents.
Note: To provide pivot charts with the most up-to-date information, you should periodically access the Direct Reports Tables Build Page to run the direct reports process. This process populates direct report flat tables corresponding to each access type. The pivot chart selects data from flat tables through PSQuery.
This page displays those employees that are part of the reporting structure you selected on the My Team – Summary Page. When a manager has multiple jobs, the system will show direct reports of the selected job record.
Hover over a data point to view the performance rating, name, and compa-ratio associated with the data point.
The grid below the chart displays the following information:
The employee name and ID.
The related actions icon, from which you can access and perform manager self-service transactions.
The employee’s current job data, including the department, job code, salary, currency, and compa-ratio.
The last performance review scores.
Click a data point in the chart to display only that person’s data in the detailed grid at the bottom of the page. Click elsewhere on the pivot grid to once again show all employees for that team.
|
Field or Control |
Definition |
|---|---|
(Tablet)  Show
Filters or Hide Filters tab button or (smartphone) Show
Filters or Hide Filters tab button or (smartphone)  Filters button Filters button |
(Tablet) Select the Show Filters tab button to display the filters options on the left side of the page and specify which criteria facets should be included in the graph. Select the Hide Filters tab to close the panel that shows filter options. (Smartphone) Select the Filters button to open the Filters page and specify which criteria facets should be included in the graph. Select the Done button to close the Filters pages and apply the filters. |
Image: (Tablet) Performance vs. Compa-Ratio page showing the filter options
This example illustrates the fields and controls on the Performance vs. Compa-Ratio page showing the filter options for the tablet.
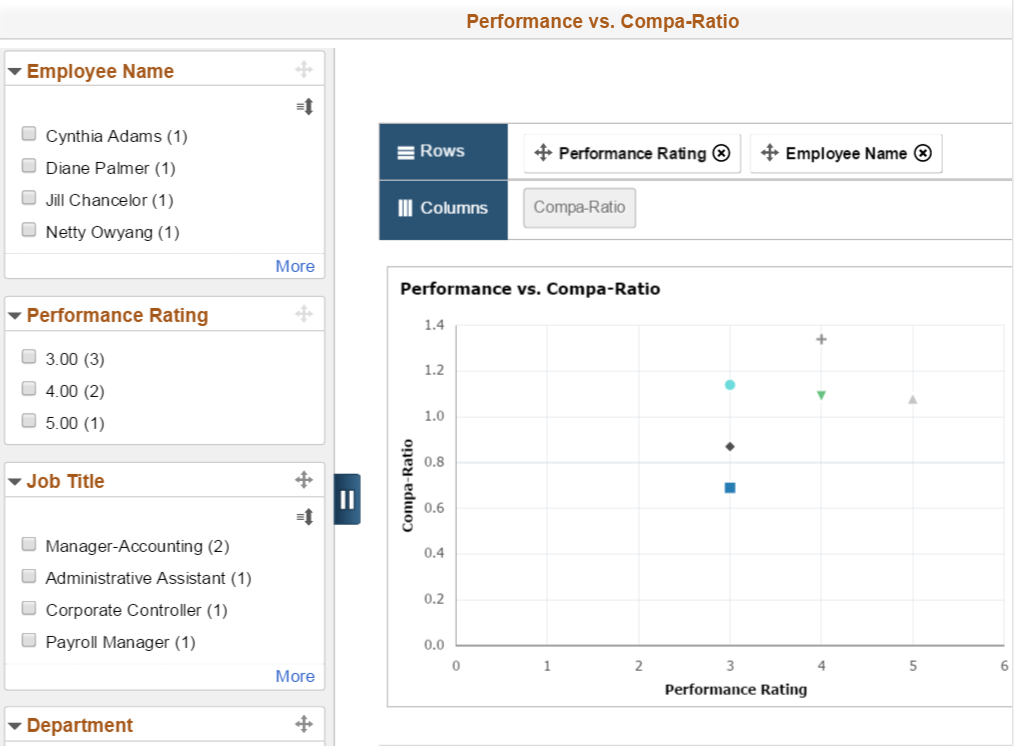
Image: (Smartphone) Performance vs. Compa-Ratio page showing the filter options
This example illustrates the fields and controls on the Performance vs. Compa-Ratio page showing the filter options for the smartphone.
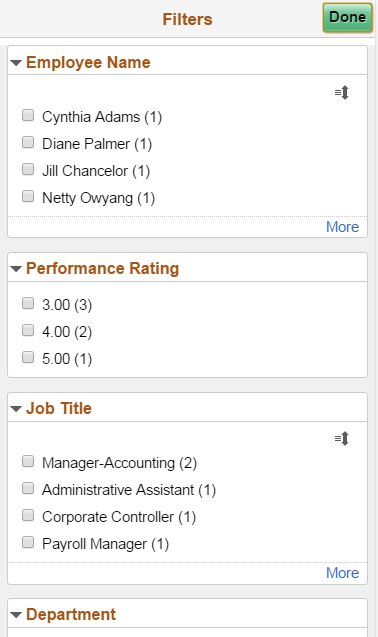
The filter panel displays the various categories reflected in the chart: Employee Name and Performance Rating, as well as Job Code, Location, and Department. When you select the check boxes within the filter categories using a tablet or large form factor, the filter panel, chart, and grid dynamically update to reflect data from the criteria you have selected. When you select the check boxes within the filter categories using a smartphone or small form factor, and select Done, the chart and grid dynamically update to reflect data from the criteria you have selected. The group of direct reports appearing on the chart are restricted to those that match the filter criteria and the filter options are limited to match the criteria of those displayed on the chart. For example, if you select to display just the managers in a team and none of them have a performance rating of 5.00, then the chart will show only those employees that are managers and the number 5.00 performance rating will not appear within the Performance Rating category filter. If you do not select any check boxes within a filter category, the chart will display all criteria that applies within the category.