Viewing the Manager Dashboard Pagelets
These topics discuss viewing the Manager Dashboard pagelets.
Note: You can personalize many of these pagelets so they appear differently on the dashboard.
See Personalizing Column and Sort Order within the Pagelet Grids.
|
Page Name |
Definition Name |
Usage |
|---|---|---|
|
UX_ALERT_DTL |
View details regarding all alerts associated with your direct reports. |
|
|
UX_EPO_ALIGN_DET |
View the detailed alignment information and the progress of the employee goals compared to the business objective. |
|
|
UX_DIRECTS_HGRID |
View information about your direct and indirect reports in a hierarchical list (or Hgrid) format. |
|
|
EP_PG_DOCSTS_SEC |
Edit the default settings used for launching the My Team’s Performance Status pagelet. |
The Alerts pagelet displays alerts associated with direct reports.
Image: Alerts pagelet
This example illustrates the fields and controls on the Alerts pagelet. You can find definitions for the fields and controls later on this page.
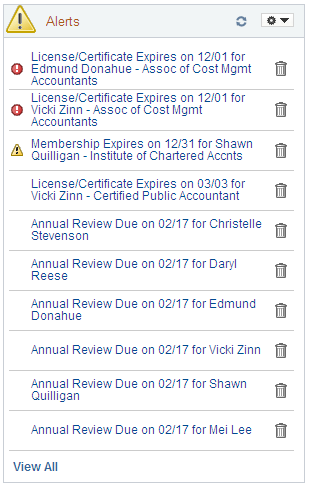
Use this pagelet to view past or upcoming events and dates related to your direct reports. These alerts are grouped by alert level: critical appearing first, then by all warning alerts, and finally informational alerts. Within each level, the pagelet then sorts the alerts by type. There are seven alert types delivered for the Alerts pagelet:
ePerformance
eCompensation
Expiring Licenses/Certificates
Expiring Memberships
Scheduled Training
Birthday Alerts
Anniversary Alerts
The administrator defines the rules for when an alert moves to another level for each alert type. All alerts are time sensitive and the system generates them by comparing the current date to the date specified for each alert type and level.
|
Field or Control |
Definition |
|---|---|
| <alert message link> |
Click the link of any of the alert messages to have the system display the appropriate application detail page to provide more information about the alert. These secondary pages are view only. |
| View All |
Click this link to open the More Alert Information page and view all alerts associated with your direct reports. |
Use the More Alert Information page (UX_ALERT_DTL) to view details regarding all alerts associated with your direct reports.
Navigation
Click the View All link on the Alerts pagelet in Manager Dashboard.
Image: More Alert Information page
This example illustrates the fields and controls on the More Alert Information page. You can find definitions for the fields and controls later on this page.
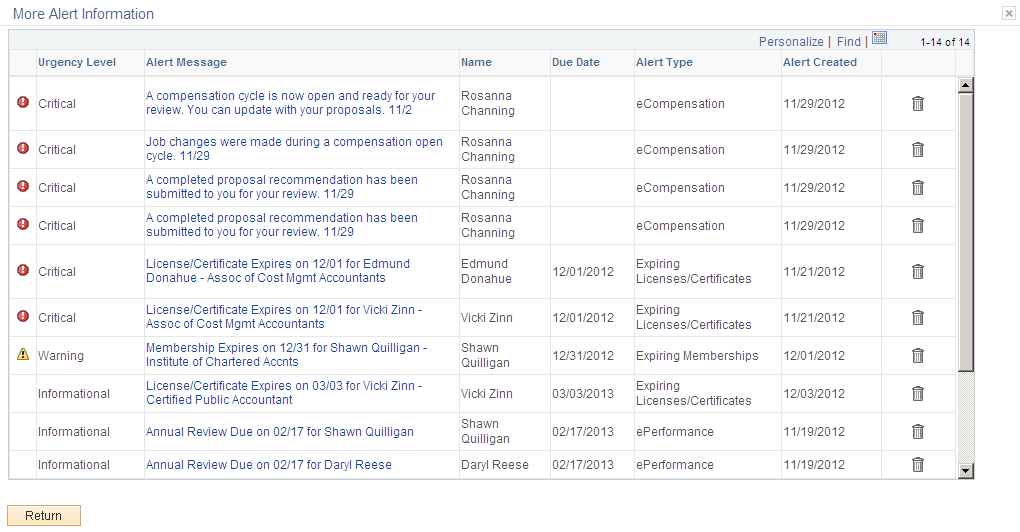
Use this page to view details regarding all alerts associated with your direct reports.
If you have set the number of alerts to appear on the pagelet as a number less than all the alerts in your queue, you can view all remaining alerts on this page.
The Objective Alignment pagelet displays narrow version of the manager’s department business objectives.
Image: Objective Alignment pagelet
This example illustrates the fields and controls on the Objective Alignment pagelet. You can find definitions for the fields and controls later on this page.
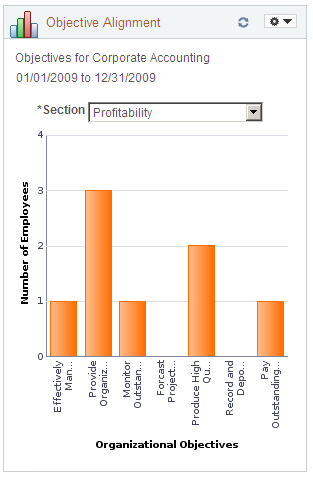
The business objective is listed at the top of the pagelet, with the business objective beginning and end date below it. If you have not saved a default value through the Personalize Business Objectives Alignment page, the system will display the most recently created business objective.
|
Field or Control |
Definition |
|---|---|
 |
Select the Pagelet Settings drop-down list in the header and select the Personalize option to open the Personalize Business Objectives Alignment page and define a default business objective and section. If you are associated with more than one department objective, you would select the business objective through this page. |
| Section |
Chose a section from the business objective of this department. The pagelet refreshes and displays a graphical representation of the corresponding Business Objective Alignment data. The chart is a 2D bar chart. The X-Axis lists all the objectives under the selected section. When you pause over a bar in the graphic, the objective name shows as well as the number of employee aligned to this objective. The Y-Axis gives the number of employees that currently have their goals aligned to the business objective. If no employees aligned, the bar does not appear, but the objective label still appears on the X-Axis. Click an objective bar within the graphic to open the Objective Alignment Progress page and see the detailed alignment information and the progress of the employee goals. |
The Business Objective Alignment pagelet displays wide version of the manager’s department business objectives.
Image: Business Objective Alignment pagelet
This example illustrates the fields and controls on the Business Objective Alignment pagelet. You can find definitions for the fields and controls later on this page.
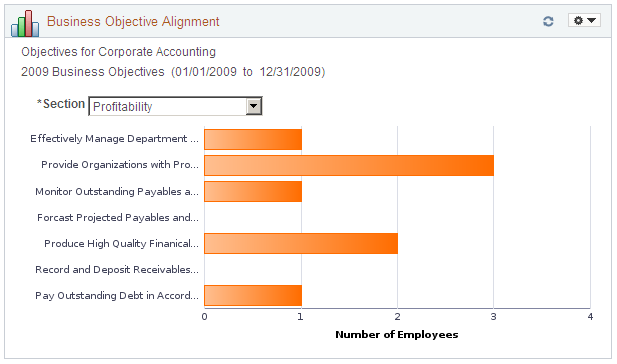
The Business Objective Alignment pagelet works the same as the Objective Alignment Pagelet, but the graph and bars are displayed in a horizontal, wide view with longer objective labels and the X- and Y-axis reversed.
Use the Objective Alignment Progress page (UX_EPO_ALIGN_DET) to view the detailed alignment information and the progress of the employee goals compared to the business objective.
Navigation
Click a bar from within the Objective Alignment pagelet.
Click a bar from within the Business Objective Alignment pagelet.
Image: Objective Alignment Progress page
This example illustrates the fields and controls on the Objective Alignment Progress page. You can find definitions for the fields and controls later on this page.
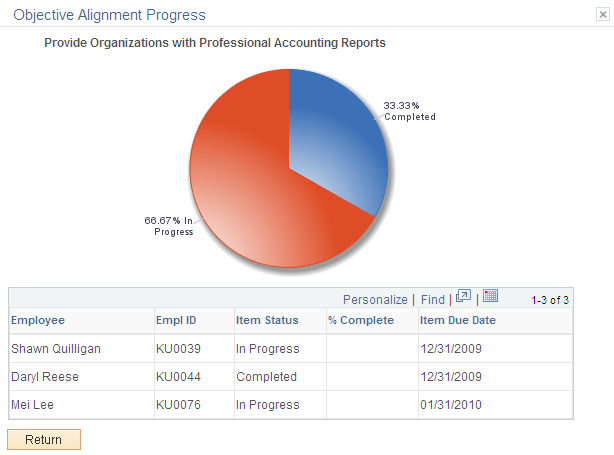
The objective name that corresponds to the bar you clicked. The page displays the goal progress chart for the department employees as a 2D pie chart.
The grid at the bottom shows all the employees that have their goal aligned to the objective. It includes the employee name, employee ID, status, percentage complete, and due date of the objective.
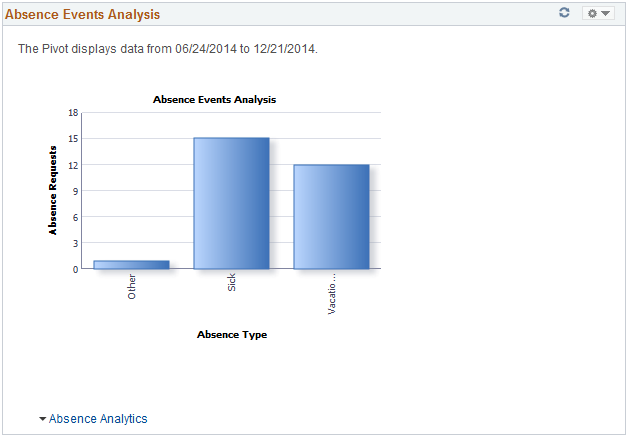
The Absence Events Analysis pagelet displays a bar chart of your employees’ absence requests organized by absence type.
Image: Absence Events Analysis pagelet
This example illustrates the fields and controls on the Absence Events Analysis pagelet.
|
Field or Control |
Definition |
|---|---|
| Absence Analytics |
Click to access modal versions of the following pivot grids:
|
Adding the Absence Events Analytics Pagelet to the Manager Dashboard
By default, the Absence Events Analytics pagelet is not available to add to the Manager Dashboard using the Personalize Content: Manager Dashboard Page. To enable managers to add the Absence Events Analytics pagelet to the Manager Dashboard:
Access the Manage Dashboard Pages page ()
Click the Pagelets button for the Manager Dashboard row to access the Tab Content page for Manager Dashboard.
Select the Include all? check box in the Absence Mgmt Manager Pagelets group box.
The Pending Approvals pagelet displays time sensitive approvals requiring action by the manager.
Image: Pending Approvals pagelet
This example illustrates the fields and controls on the Pending Approvals pagelet. You can find definitions for the fields and controls later on this page.
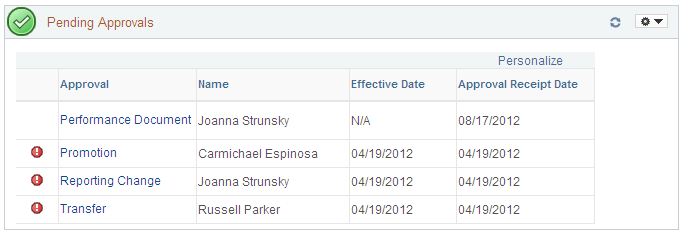
Use this pagelet to view the pending approvals for your direct reports and determine what approval actions must be taken right now. Only approvals that use the Approval Workflow Engine (AWE) framework appear in this pagelet. If enabled by the administrator, the pagelet can display the Response due or Response overdue icon, indicating that the date upon which an approval is required is nearing. These dates are set by the administrator.
When there are no pending approvals in your queue, then the Pending Approvals pagelet will display the text No approvals are pending at this time.
|
Field or Control |
Definition |
|---|---|
| <warning level icon> |
The first column displays a warning icon when warning levels are associated with transactions. When no warnings are associated with any of the transactions appearing in the grid, this column is hidden. The warning icons that can appear in the first column are determine using the rules the administrator defines on the Approvals Pagelet Setup page, and are based on the number of days before a transaction effective date or days after the approval receipt date. The two levels of warnings are:
|
| Approval |
Click the approval transaction name link in the Approval column to view the application specific transaction approval page. Here you can view transaction details, approve or deny the transaction request, and enter comments regarding your response. |
| Name |
Displays the name of the employee associated with the approval transaction. If multiple employees are linked to the same transaction, then the field will display the text Transaction Number X (where X is the number of transactions), with the exception of the Reporting Change approval. For Reporting Change approvals, the system will fetch the name of the first employee tied to the transaction and display it in this column, if there is more than one, an ellipsis (...) is added to indicate more employees are tied to the approval transaction. When there is no employee associated with an approval transaction, such as a nonperson job profile, then the field will display N/A (not applicable). |
| Effective Date |
Displays the date on which a transaction is scheduled to take place. For example, the date an employee is scheduled for a promotion, and still needing your approval, will display here. When there is no transaction date associated with the approval transaction, then the field will display N/A (not applicable). The transaction effective date for Compensation approvals is the budget start date. |
| Approval Receipt Date |
Displays the date the approval was sent to you. |
You can refresh your queue as by clicking the Refresh icon on the pagelet header.
Note: You can also personalize the columns of the grid in this pagelet by clicking the Personalize link above the grid in the pagelet.
Access the application specific transaction approval page (click the approval transaction name link in the Approval column of the Pending Approvals pagelet).
Image: Example of an application specific approval page for a Performance document
This example illustrates an example of an application specific approval page for a Performance document.
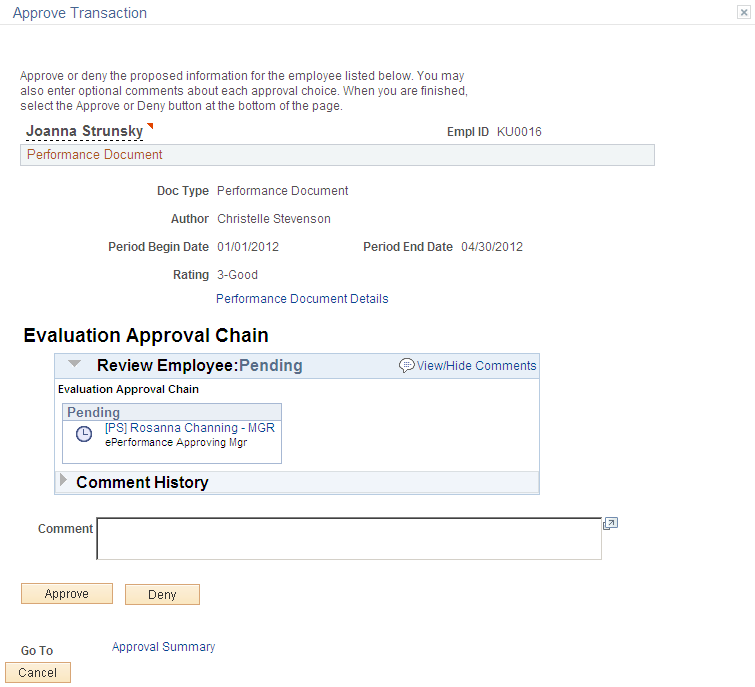
Use the approval page specific to the business process to approve, deny, or perform any other response to an approval. This approval page is identical to the application page you would typically access using the standard menu navigation.
The page displays who the approval has been routed to and the approval status. Click the approver’s name or the text Multiple Approvers to see a list of approvers.
The Approve, Deny, and other actions options appear at the bottom of the page. After clicking Approve or Deny, you should receive the appropriate confirmation. To return to the Pending Approvals pagelet and the Manager Dashboard, click the Cancel button.
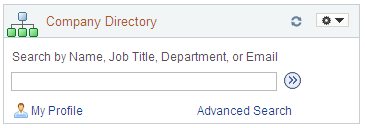
The Company Directory pagelet enables managers to search for employees in the company directory.
Image: Company Directory pagelet
This example illustrates the fields and controls on the Company Directory pagelet. You can find definitions for the fields and controls later on this page.
|
Field or Control |
Definition |
|---|---|
 (Search) (Search) |
Enter search criteria and click the Search button to retrieve a person in the Org Chart Viewer - Company Directory pages. |
| My Org Chart or My Profile |
Click one of these links to access either the Org Chart page or your Profile page in the Company Directory. The link that appears here is determined by your personal preferences for the Org Chart Viewer - Company Directory. |
| Advanced Search |
Click this link to open the Advanced Search page and enter multiple search criteria, like a name and department, to locate a person. |
The My Job Openings pagelet displays all job openings assigned to the manager.
Image: My Job Openings pagelet
This example illustrates the fields and controls on the My Job Openings pagelet. You can find definitions for the fields and controls later on this page.
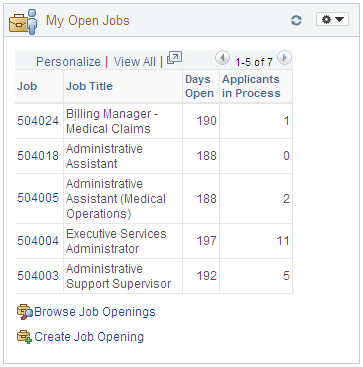
Use this pagelet to view your job openings with an Open status. You must be designated as the assigned hiring manager to have a job opening visible in this pagelet. Job openings in which you are assigned as the recruiter, interviewer, screener, approver, or reviewer, but not as the hiring manager, will not appear in this list.
If you are not assigned as a hiring manager to any open job openings, the grid will be hidden and the following will be displayed: You are not assigned to any open jobs.
The pagelet displays the job openings in sets of five. To view additional job openings, use the Find link, View All link, Zoom icon, or scroll arrows at the top of the grid. Job openings are listed in descending job number order by default but can personalize the columns and sort order by clicking the Personalize link.
|
Field or Control |
Definition |
|---|---|
| Job |
Click the job number link to access the Find Job Opening - Job Opening page in the Talent Acquisition Manager application. Manage all aspects of a job opening, including managing applicants, finding applicants, reviewing activity, creating notes, attachments, and expenses, and viewing or updating the job opening itself from this page. |
 Browse Job Openings Browse Job Openings |
Click this link to open the Browse Job Openings page to view all existing job openings in the Talent Acquisition Manager application. This link is hidden if you do not have security access to the Browse Job Openings page. |
 Create Job Opening Create Job Opening |
Click this link to open the Enter Primary Job Opening Information page to enter the primary job opening details in the Talent Acquisition Manager application. This link is hidden if you do not have security access to create job openings. |
The Quick Links pagelet provides navigation links to menu items frequently used by the manager.
Image: Quick Links pagelet
This example illustrates the fields and controls on the Quick Links pagelet. You can find definitions for the fields and controls later on this page.
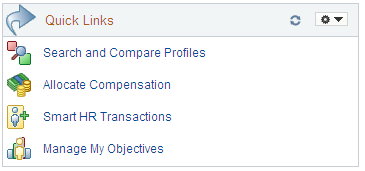
Use this pagelet as an alternative to navigating to frequently used pages. This enables you to access these pages with one click as opposed to traditional navigation. You must have security permission to access these quick link pages.
The administrator can create or add quick links to this pagelet by using Navigation Collections and Pagelet Wizard. To add additional links, you would use the following steps:
Navigate to
Search for Quick Links and click the Edit link. Navigate to
Click the Add Link button to add additional links to this pagelet.
The My Reports pagelet enables manager to display selected reports on the dashboard.
Image: My Reports pagelet
This example illustrates the fields and controls on the My Reports pagelet. You can find definitions for the fields and controls later on this page.
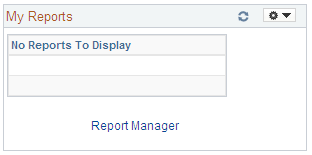
Click the report name to access the report run control page. Click the Report Manager link to access the Report Manager.
The Learning pagelet displays the training status of employees. This information comes from the Enterprise Learning Management (ELM) system.
Image: Learning pagelet
This example illustrates the fields and controls on the Learning pagelet. You can find definitions for the fields and controls later on this page.
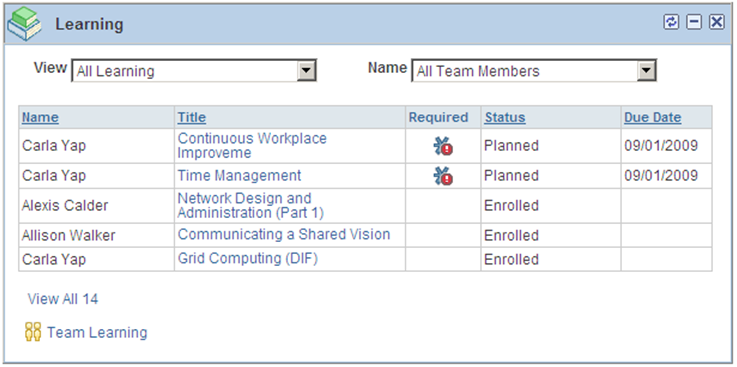
Use this pagelet to see an overview of learning events for direct reports. This pagelet highlights required learning and certifications which are expired or in warning status, with the Past Due and Due Soon warnings appearing first. The pagelet presents the classes, programs, and courses in Planned status for each direct report.
The View and Name drop-down fields enable you to filter the data that you see in the grid.
|
Field or Control |
Definition |
|---|---|
| View |
Select which view of data you wish to display in the grid. Choices are:
|
| Name |
Select the individuals you want to display in the grid. You can chose to display all team members by selecting All Team Members, or you can select an individual direct report team member by name. Indirect team member will not be available in this pagelet. |
| Title |
Click the title link to open an application page that corresponds to the type of learning item it is, for example, a class, course, or program. Note: The data for ELM Learning is pulled from ELM database via IB Integration setup. |
 (Past Due icon) (Past Due icon) |
Indicates that this learning event is required and past due. |
 (Due Soon icon) (Due Soon icon) |
Indicates that this learning event is required and due soon. |
| View All <number> |
The pagelet displays five rows of information in the grid. Click this link to open a modal Learning grid page to view all rows of employee learning. The number of employees that appear in the page grid will appear in the link name. |
 Team Learning Team Learning |
Click this link to open the Team Learning page in Manager Self Service. |
See the documentation for PeopleSoft Enterprise Learning Management.
The Direct Line Reports pagelet displays data about a manager’s direct reports from information stored across the HCM product line. Managers can view various details about their employees from this single location. Managers will use this pagelet to view job details, contact information, career and succession plans, compensation, performance reviews, and time tracking for their direct reports. This data comes from a number of PeopleSoft HCM products including ePerformance, Career Planning, Succession Planning, Time and Labor, Absence Management, Compensation, and ELM.
The HCM data that is brought into the pagelet is organized into a grid with tabs, as defined on the Direct Reports Pagelet Setup page and the user preferences. Each tab contains a group of fields displaying employee data from a specific area from within HCM. See Understanding the Direct Line Reports Pagelet Features.
Note: Users can personalize the tabs and columns of the grid in this pagelet by clicking the Personalize link above the grid in the pagelet. Because of this, columns and tabs shown in this document may vary from your application. The tabs and columns shown here are the delivered default values.
See Personalizing Column and Sort Order within the Pagelet Grids.
The Direct Line Reports pagelet uses access types to determine which employees report to a manager. The Direct Line Reports pagelet component uses the access type registered in the Direct Reports Setup under
See Understanding the Direct Line Reports Pagelet Features.
These topics discuss the:
Direct Line Reports pagelet: Summary tab.
My Organization page.
Direct Line Reports pagelet: Job Details tab.
Direct Line Reports pagelet: Contact tab.
Direct Line Reports pagelet: Career Plan tab.
Direct Line Reports pagelet: Compensation tab.
Direct Line Reports pagelet: Performance tab.
Direct Line Reports pagelet: Time tab.
Direct Line Reports pagelet: Succession tab.
Direct Line Reports Pagelet: Summary Tab
The Summary tab displays a high level overview of employee’s job and rankings.
Image: Direct Line Reports pagelet: Summary tab
This example illustrates the fields and controls on the Direct Line Reports pagelet: Summary tab. You can find definitions for the fields and controls later on this page.
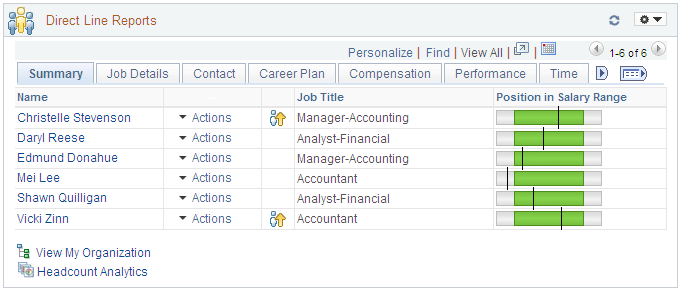
The grid displays your direct reports based on the reporting structure specified in the Direct Reports Setup Access Type Security.
The employee Name and the Action columns are frozen in the grid and these columns will be available on every tab in the grid.
|
Field or Control |
Definition |
|---|---|
| Name |
Displays the employee’s full name. Click the employee’s name link in the Name column to access the Talent Summary page for a person. The Talent Summary page displays various pagelets displaying much of the information available in the Direct Line Reports grid in greater detail. Employees with an Inactive status in HR will be shown on the My Organization page, by clicking the View My Organization link, only when it is necessary, to display the name so that drilling down to direct reports is possible. An inactive employee will not appear if he or she does not have direct reports. When you are using Position Management and the administrator has selected to allow empty positions, the text Empty Position will appear in the name field. When the administrator has set the system not to allow empty position, the inactive employee name will display in the name field through the View My Organization link, My Organization page, if the employee has direct reports. |
| First Name and Last Name |
Displays the first and last names of the employee. These fields are delivered hidden but can be added using the Direct Reports Pagelet Setup page. Click the employee’s first or last name link to access the Talent Summary page for a person. |
| Actions |
Click this menu drop-down list to select manager self service actions to perform for your employees. The system will direct you to the appropriate manager self service page. PeopleSoft delivers various manager self service transactions to work in conjunction with the Manager Dashboard that enables managers to view or manage employee information in the PeopleSoft database, as they would from the manager self service pages. This menu list also enables you to quickly access the Company Directory and Talent Summary pages for an employee. For a list of manager self service action available through the Manager Dashboard, see the “Related Actions” subtopic under Understanding the Direct Line Reports Pagelet Features. |
 (high potential icon) (high potential icon) |
This column displays the High Potential icon if an employee is identified as a high potential in the career plan. You can access this information by navigating to |
| Job Title |
Displays the employee’s job title. For example, an employee who holds two jobs and reports to the same manager for both of those jobs will have two rows of data in the grid, one for each job title. The Job Title field is available in both the Summary tab and the Job Details tab. The administrator has the ability to hide the Summary tab job title column separately from the Job Details tab job title column. |
| Performance Rating |
Displays a graphical representation of the most recent performance review rating for an employee. The number of stars is determined by the rating model that is being used. There will be one star for each value in the rating model. The performance rating that is shown is taken from the last completed performance review of the document type specified in the Direct Reports Pagelet Setup page. Pause over the star image to see the rating as text. To get the column to display the stars, you must enter numeric values in the Numeric Rating column on the Rating Model page. The pagelet uses the Numeric Rating value to determine the number of stars that should appear for each rating. If there is no Numeric Rating value for a rating in the rating model, the stars will not display. Note: The Numeric Rating field is not a required field, so be sure to enter numeric values to get the star ratings to appear. See Rating Model Page. |
| Position in Salary Range |
Displays a graphical representation of an employee’s position in the salary range for that job. The vertical bar depicts where the employee’s salary falls in that range. Pause on the graphic to view the actual salary of the employee and view the minimum, midpoint, and maximum salary values for the job. |
 View My Organization View My Organization |
Click this link when you are a higher level manager to access the My Organization pagelet and view the same data for direct and indirect reports in an hierarchical grid. Note: You will not see the View My Organization link when you do not have indirect reports. |
 Headcount
Analytics Headcount
Analytics |
Select this link to display a list of headcount analytic reports: Headcount Movement and Current Headcount. Select the appropriate report from the list. See Viewing Quick Analytics Headcount Pivot Grids. |
My Organization Pagelet
Use the My Organization pagelet (UX_DIRECTS_HGRID) to view information about your direct and indirect reports in a hierarchical list (or Hgrid) format.
Navigation
Click the View My Organization link in the Direct Line Reports pagelet on the Manager Dashboard.
Image: My Organization pagelet
This example illustrates the fields and controls on the My Organization pagelet. You can find definitions for the fields and controls later on this page.
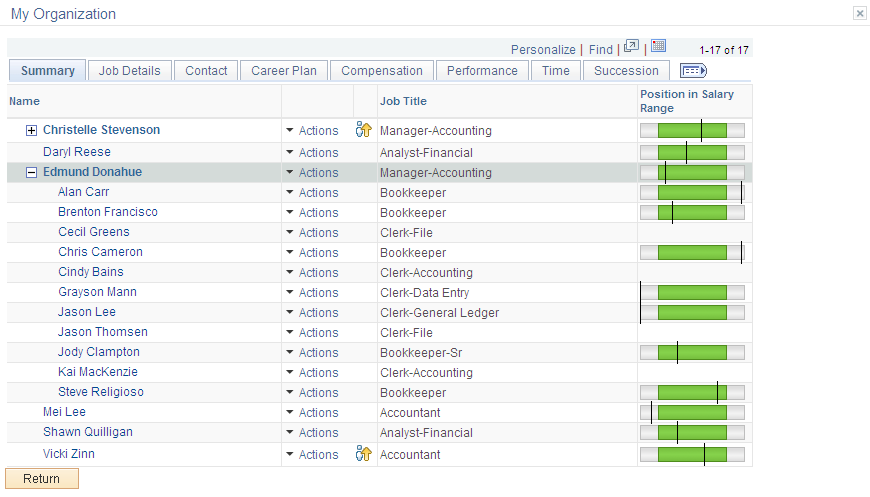
Higher level managers have the ability to view and complete actions for their direct and indirect employees. The page displays your reporting structure in an hierarchical list (Hgrid) format. Employees that are also managers are represented by a + or – sign preceding their name. You can expand (+) or collapse (–) different levels to view the reporting structure of managers and employees that report up to you.
Note: The page will display up to nine levels of managers and employees. The system will display a message when reporting structures exceed nine levels.
Direct Line Reports Pagelet: Job Details Tab
The Job Details tab displays information about the employee’s current job and work history.
Image: Direct Line Reports pagelet: Job Details tab
This example illustrates the fields and controls on the Direct Line Reports pagelet: Job Details tab. You can find definitions for the fields and controls later on this page.
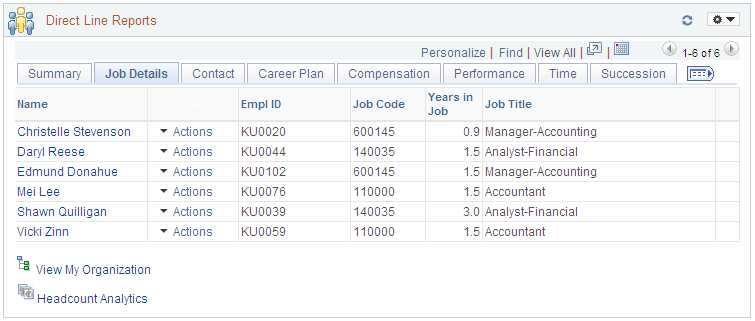
The last column displays a schedule icon, if applicable. This indicates where an employee is today. The column displays only one icon to indicate the employee schedule for the day, even if more than one schedule applies. There are five icons and the grid determines which icon to display using this priority sequence:
|
Field or Control |
Definition |
|---|---|
 (planned absence) (planned absence) |
Indicates that the employee has a planned absence for today. |
 (holiday) (holiday) |
Indicates that the employee is on a holiday break today. hierarchical |
 (not scheduled) (not scheduled) |
Indicates that the employee is not scheduled to work today based on the employee’s holiday schedule in Job Data. |
 (training) (training) |
Indicates that the employee is in training today. Information is obtained from ELM or HR Training. |
 (no show) (no show) |
Indicates that the employee did not show up to work today when he or she is scheduled to work. |
Direct Line Reports Pagelet: Contact Tab
The Contact tab displays different methods for contacting an employee.
Image: Direct Line Reports pagelet: Contact tab
This example illustrates the fields and controls on the Direct Line Reports pagelet: Contact tab. You can find definitions for the fields and controls later on this page.
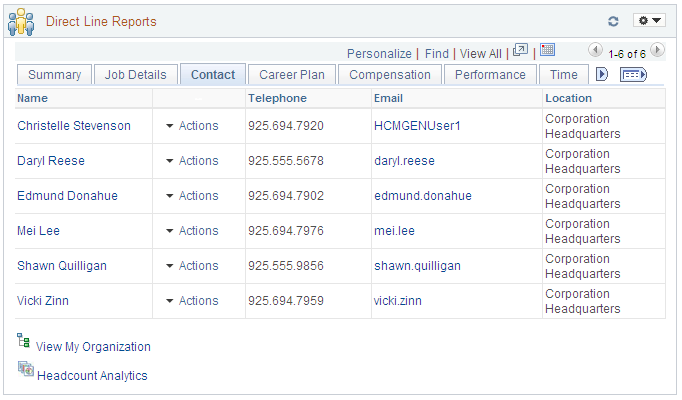
The employee’s preferred phone number and email that appear on this page come from personal data in HR. The Department and Chat columns are hidden when delivered and must be enabled by the system administrator.
The last column displays an IM chat icon if the employee has defined an instant messaging ID in HR. A green icon will appear when the employee is active, or will be grayed out when the employee is not online. The icon will appear under the following conditions:
The employee has defined an instant messaging ID in HR.
The Instant Message Presence Icon is selected for direct line reports in the Org Chart Viewer.
The employee’s IM protocol and IM domain matches the protocol and domain for the direct line reports in the Org Chart Viewer.
For more information about enabling the IM chat icon for direct reports, see the Columns field definition for instant messaging under Direct Reports Pagelet Setup Page.
Direct Line Reports Pagelet: Career Plan Tab
The Career Plan tab displays information about the employee’s mobility preferences and last review date.
Image: Direct Line Reports pagelet: Career Plan tab
This example illustrates the fields and controls on the Direct Line Reports pagelet: Career Plan tab. You can find definitions for the fields and controls later on this page.
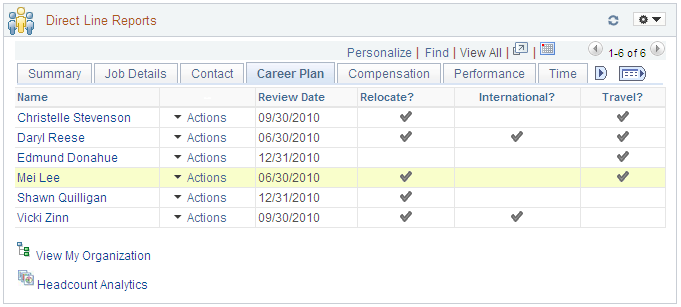
Use this page to view the data from the most recent effective dated career plan. The Review Date reflects the Career Plan Review Date for this current career plan. Mobility preferences are seen in the career plan, but are maintained in the person’s profile. A check mark identifies that an employee is willing to relocate, take an international assignment, or travel for a job.
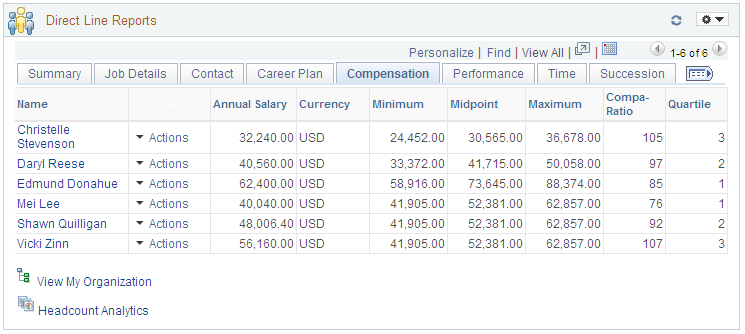
Direct Line Reports Pagelet: Compensation Tab
The Compensation tab displays how employees fit into the salary range for their jobs.
Image: Direct Line Reports pagelet: Compensation tab
This example illustrates the fields and controls on the Direct Line Reports pagelet: Compensation tab. You can find definitions for the fields and controls later on this page.
|
Field or Control |
Definition |
|---|---|
| Minimum, Midpoint, and Maximum |
Displays the minimum, midpoint and maximum amounts suggested for the salary range for the job code of the employee. If no salary grade is associated with the job code, no information will display. This information, along with the annual salary can be seen visually on the Summary tab in the Position in Salary Range column. |
| Compa-Ratio |
Indicates as a percentage where workers' salaries lie in relation to the midpoint range for their salary grades. The compa-ratio displays 100 percent, when the salary is exactly at the midpoint of the salary range. It is a number less than 100 when the salary is below the midpoint of the salary range. It is a number greater than 100 when the salary is greater than the midpoint. This field is delivered as available in both the Summary tab and the Compensation tab and displays the same information. The administrator has the ability to hide the Summary tab Compa-Ratio column separately from the Compensation tab Compa-Ratio column on the Direct Reports Pagelet Setup page. |
| Quartile |
Indicates where the employee’s salary relates to the salary range when the range is divided into quarters. Values are 1, 2, 3, or 4, the higher the number, the higher the employee is within the salary range. |
| %Range |
Displays how close the employee’s salary is to the midpoint of the salary range. This field is delivered hidden by default. |
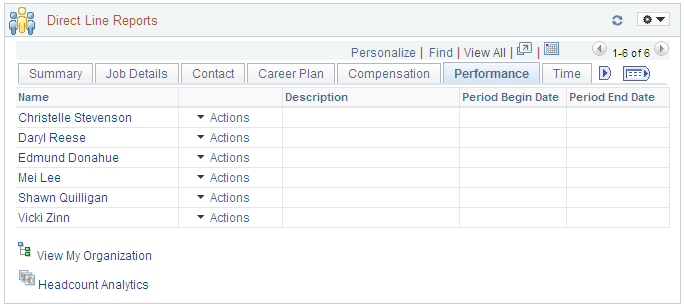
Direct Line Reports Pagelet: Performance Tab
The Performance tab displays the latest performance review information for a manager’s employees.
Image: Direct Line Reports pagelet: Performance tab
This example illustrates the fields and controls on the Direct Line Reports pagelet: Performance tab. You can find definitions for the fields and controls later on this page.
|
Field or Control |
Definition |
|---|---|
| Last Rating |
Identifies the rating that the employee received on his or her last completed performance document for the document type that is specified on the Direct Reports Pagelet Setup page by the administrator. The rating is taken from the overall rating section of the performance document. If the document type has not been specified in the setup or the employee does not have a completed performance rating from the specified document, the performance rating information will not display. |
| Period Begin Date and Period End Date |
Displays the dates the performance period began and ended where the employee received their Last Rating. |
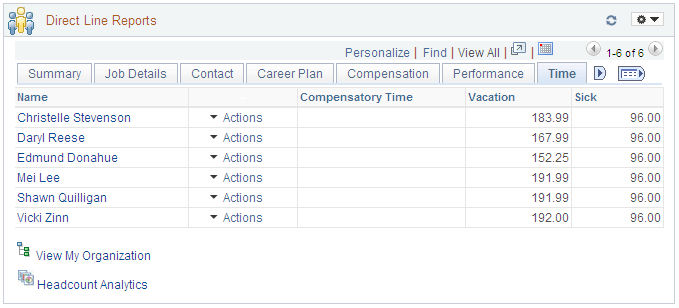
Direct Line Reports Pagelet: Time Tab
The Time tab displays the employee’s available compensatory, vacation, and sick hours.
Image: Direct Line Reports pagelet: Time tab
This example illustrates the fields and controls on the Direct Line Reports pagelet: Time tab. You can find definitions for the fields and controls later on this page.
|
Field or Control |
Definition |
|---|---|
| Compensatory Time |
Shows the number of comp time hours available to the employee. The comp time balance is retrieved from Time and Labor. An employee must be enrolled in Time and Labor to accrue compensatory time. You enroll employees in the Time and Labor by navigating to or by clicking the Time Reporter Data link on the Job Data - Employment Data page. |
| Vacation and Sick |
Displays the number of vacation or sick hours available to the employee and balances are retrieved from Time and Labor. These fields are delivered hidden by default. |
| Absence Management Leave Balance 1, 2, and 3 (column label names will vary) |
Displays user defined information from Absence Management. The administrator identifies these fields on the Direct Reports Pagelet Setup page in conjunctions with the Global Payroll and Absence Management pages. The Absence Management Leave Balance 3 field is delivered hidden by default. |
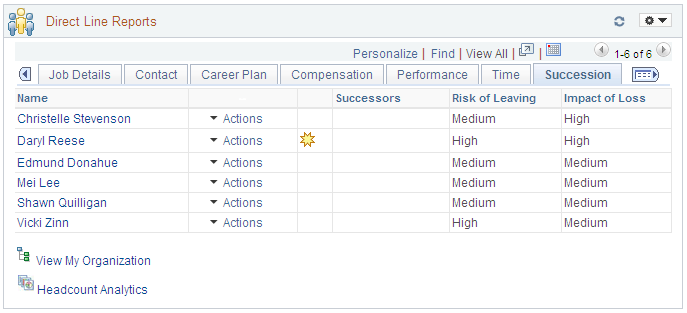
Direct Line Reports Pagelet: Succession Tab
The Succession tab displays employee’s succession plan information.
Image: Direct Line Reports pagelet: Succession tab
This example illustrates the fields and controls on the Direct Line Reports pagelet: Succession tab. You can find definitions for the fields and controls later on this page.
|
Field or Control |
Definition |
|---|---|
 (key person) (key person) |
The first column after the Actions field displays the Key Person icon to indicate that an employee has been identified as a vital, or key, employee within the organization for succession planning. |
| Successors |
Displays the number of candidates that have been identified as successors in the Succession Plan. The number of successors is the sum of the candidates listed on a succession plan for a key person. To add succession candidates to a person’s succession plan, create or modify a succession plan by navigating to and entering the candidates on the Candidates page. |
| Risk of Leaving and Impact of Loss |
Show the employee’s risk of leaving and the impact of that loss, as defined in the career plan for an employee. |
The My Team’s Performance Status pagelet displays the performance status of documents that are owned by the manager’s team.
Image: My Team’s Performance Status pagelet
This example illustrates the fields and controls on the My Team’s Performance Status pagelet.
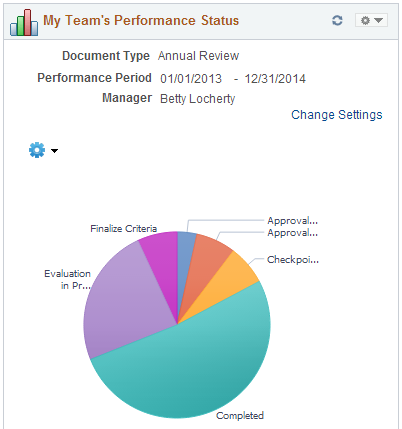
The pie chart shows the progress of ePerformance documents for the manager’s organization. Documents represented in the pie chart are filtered by the document type, performance period, and manager that are specified at the top of the pagelet. The chart displays all supported document status, except for Canceled.
The performance status pivot chart supports these access types:
By Supervisor ID (access type – 2)
By Department Manager ID (access type – 3)
By Reports To Position (access type – 4)
By Part Posn Mgmt Supervisor (access type – 5)
By Part Posn Mgmt Dept Mgr ID (access type – 6)
The chart uses the access type that is specified on the Direct Reports Transaction Configuration Page for the EP_APPR_SELECT component.
Note: To support the performance status pivot chart, run the Direct Reports Table Build process periodically. This process populates direct report flat tables corresponding to each access type. The pivot chart selects data from flat tables through PSQuery.
|
Field or Control |
Definition |
|---|---|
| Change Settings |
Click to access the Change Settings Page to update parameters that are used to build the chart. For example, if you wish to view the progress of a particular manager’s team in your organization, you can change the manager using this link. The system updates the pie chart to show only documents that pertain to the newly selected manager. |
 |
Click to select the Export Data option to export the data of the documents that are selected for the pie chart to a spreadsheet. This is the same as selecting the detailed view of a pie chart segment, except that this Export Data option includes all the documents, not just the ones in a particular document status. |
| Filters and Status |
This control appears only if you click a pie chart segment and select a DrillDown To option to manipulate the pie chart data. By default, the document status of the clicked segment is selected. Select one or more document statuses for their documents to be included in the pie chart. For example, you may select two document statuses as filters and drill down to view documents of these two statuses by department. Click the Status link to return to the original pie chart display. |
Pie Chart Display
For all the documents that meet the filter criteria, they are represented in the pie chart by document status and sub-statuses (for example, Approval Submitted, Checkpoint #, and Finalize Criteria).
Hover over a pie chart segment to view its document status and the number of documents that are in this status.
Click a pie chart segment to:
See a detailed view of the documents that are included in this status, in a grid format on a modal page.
The grid displays document information such as employee and manager names, document status, next due date and so on. A related action is available to users to open documents in the WorkCenter for edit (if the document status is not Completed) or review (if the document status is Completed, or if the user is not the manager listed on the document.
Drill down to further segregate the data (documents) of the selected status (segment) by these options:
Department—Data of the selected segment is represented by a pie chart, grouped by department.
Location—Data of the selected segment is represented by a pie chart, grouped by location.
Manager—Data of the selected segment is represented by a pie chart, grouped by manager.
Use the Change Settings page (EP_PG_DOCSTS_SEC) to edit the default settings used for launching the My Team’s Performance Status pagelet.
Navigation
Click the Change Settings link on the My Team’s Performance Status pagelet.
Image: Change Settings page
This example illustrates the fields and controls on the Change Settings page.
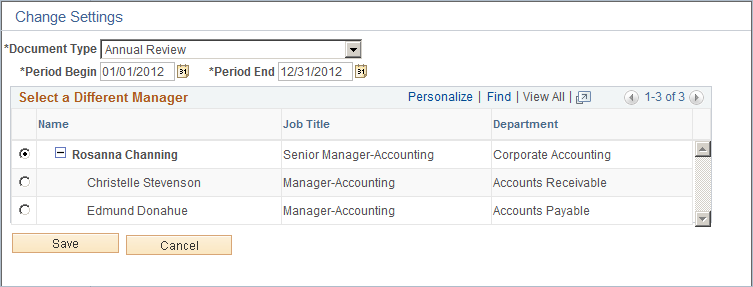
Use this page to update the parameters used for launching the performance status chart. The system includes in the status chart documents that match the specified document type, period, and manager.
|
Field or Control |
Definition |
|---|---|
| Document Type, Period Begin and Period End |
Update the default document type and evaluation period as needed. By default, the system displays the values that are specified in the Assign Document Defaults Page. |
| Select a Different Manager |
Displays the reporting structure that lists the direct and indirect managers of the logged on manager user, whose name is displayed in bold text in the grid. Select a manager for the system to filter documents for the chart to those that are owned by him or her. |