External Devices
You can configure communication with external devices in the External Devices section, which includes the following sub-sections:
RADIUS Authentication
Note:
User Roles cannot work together with RADIUS Authentication.
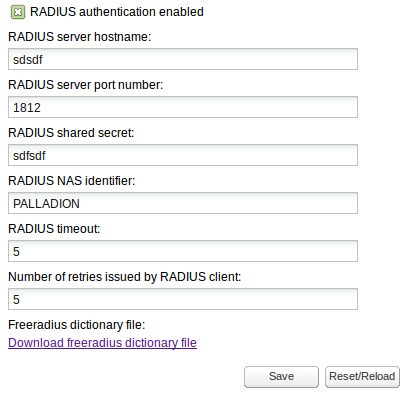
RADIUS authentication allows you to configure whether or not Operations Monitor will perform RADIUS authentication against a RADIUS authentication server each time you log in. See Figure 7-33 for an illustration:
Figure 7-33 Radius Authentication Settings

Description of "Figure 7-33 Radius Authentication Settings"
To enable RADIUS authentication on an Operations Monitor installation, click the RADIUS authentication enabled check box. When enabled:
The RADIUS server hostname and RADIUS server port number fields control the address of the RADIUS server against which Operations Monitor performs authentication.
The RADIUS shared secret field must contain the secret that is shared by Operations Monitor and the RADIUS server used for authentication.
The RADIUS NAS identifier is a string identifier and is used by the RADIUS server to determine whether or not the request is coming from Operations Monitor.
The RADIUS timeout is number of seconds to wait response from RADIUS server.
The Number of retries issued by RADIUS client is the number of attempts to connect to server, expressed as positive integer value. Number of retries multiplied by timeout value should not exceed 30 (seconds), otherwise both fields (timeout and number of retries) will be marked as invalid.
For more information about RADIUS authentication in Operations Monitor, see "Requirements for RADIUS Authentication".
SNMP Options
The SNMP Options subsection allows you to configure:
Whether Operations Monitor sends SNMP traps.
Whether Operations Monitor can be queried using SNMP.
Regarding the queries Operations Monitor can answer, they are in turn split in two:
All the counters of Operations Monitor are exported as gauges.
All operating parameters of the system of Operations Monitor.
SNMP Traps
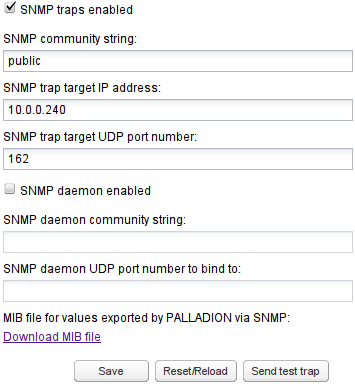
To enable SNMP traps, click the SNMP traps enabled check box as shown in Figure 7-34. When enabled, SNMP traps can be sent on several Alerts. You must configure the SNMP community name, IP address, and port where the SNMP traps will be sent.
To test the settings, a test trap can be sent by clicking Send test trap. To send SNMP traps to more than one target, you enter more than one SNMP trap target IP address.
If you specify more than one community string, Operations Monitor will use the first community string and the first IP address, and so on. You cannot specify more than one port.
SNMP traps are interpreted using the MIB file, which is downloaded from the SNMP Options configuration page. See Figure 7-34 for an illustration.
The traps include descriptive text which interprets the trap as well as the subsystem that caused the trap to be generated. Included in this description are the current value assigned to the system (value of the counter, IP address, actual user or device name), and the severity of the trap.
Some instances that generate traps are:
Counters exceeding thresholds.
IP addresses or user names meeting certain conditions.
Failing network devices.
SNMP Daemon
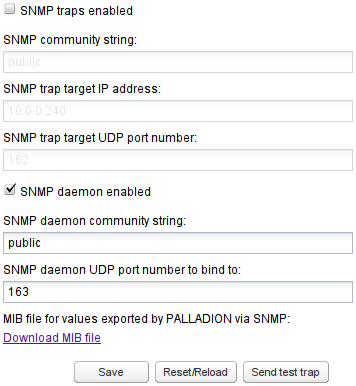
To enable SNMP Daemon, click the SNMP daemon enabled check box. With the SNMP daemon enabled, you can query Operations Monitor using SNMP. See Figure 7-35. For SNMP Daemon to work properly, you must also specify the community name and UDP port, which listens for SNMP requests coming in. Operations Monitor supports SNMP Version 2 over UDP.
Exported Counters
The counters are available in the MIB tree under the OID: .1.3.6.1.4.1.29631.2.2.0.256. Enter the following command to list all counter information using Net-SNMP's snmpwalk:
snmpwalk -Os -c public 10.1.0.78:162 -v 2c \
   .1.3.6.1.4.1.29631.2.2.0.256
The next node is the counter ID. Under it, the counter object has the following fields as listed in Table 7-7:
Table 7-7 Counter Object Fields
| Field | Description |
|---|---|
.0.0 |
The counter ID. |
.1.0 |
The name of the counter. |
.2.0 |
The device or IP/Prefix tag name (if it is a device or IP/Prefix tag counter). |
.3.0 .4.0 .5.0 |
The counter parameters. |
.6.0 |
The current second value. |
.7.0 .8.0 .9.0 |
The last minute average/min/max. |
.10.0 .11.0 .12.0 |
The last 5 minutes avg/min/max. |
.13.0 .14.0 .15.0 |
The last hour avg/min/max. |
For example, here is how to get the active calls counter. Note, that the ID of the counter (422 as used in this example), will vary from one box to another:
snmpwalk -Os -c public 10.1.0.78:162 -v 2c  \
     .1.3.6.1.4.1.29631.2.2.0.256.442

enterprises.29631.2.2.0.256.442.1.0 = STRING: "Active calls"
enterprises.29631.2.2.0.256.442.3.0 = INTEGER: 0
enterprises.29631.2.2.0.256.442.4.0 = INTEGER: 0
enterprises.29631.2.2.0.256.442.5.0 = INTEGER: 0
enterprises.29631.2.2.0.256.442.6.0 = Counter64: 136
enterprises.29631.2.2.0.256.442.7.0 = Counter64: 13751
enterprises.29631.2.2.0.256.442.8.0 = Counter64: 133
enterprises.29631.2.2.0.256.442.9.0 = Counter64: 141
enterprises.29631.2.2.0.256.442.10.0 = Counter64: 10319
enterprises.29631.2.2.0.256.442.11.0 = Counter64: 66
enterprises.29631.2.2.0.256.442.12.0 = Counter64: 141
enterprises.29631.2.2.0.256.442.13.0 = Counter64: 10068
enterprises.29631.2.2.0.256.442.14.0 = Counter64: 63
enterprises.29631.2.2.0.256.442.15.0 = Counter64: 141
Note:
When using snmpwalk the following should be considered:
Because of large values, the Counter64 type is used, but this is not available in SNMPv1. You must use SNMPv2 or later.
Even with Counter64 type in use, the counters act like gauges in SNMP talk. For example, over time the value of the counter is presented, and not the sum.
The averages are computed per-second. For example, for the last 5 minutes, all the values measured every second are added and then divided by 300. Since we cannot transport floats over SNMP, the avg * 100 is returned. In cacti <http://www.cacti.net/>, you would divide back with 100. In this example, the last 5-minute average, or .10.0, means: On average, there was 103.19 active calls in the last 5 minutes (measured every second).
We recommend this when creating the graphs. The min and max values might also be informative.
System Monitoring
Operations Monitor runs Net-SNMP which provides a large set of monitoring objects for the Operations Monitor system itself. For example, you can get the UC Davis http://www.net-snmp.org/docs/mibs/ucdavis.html values with:
snmpwalk -Os -c test1 10.1.0.72:161 -v 2c .1.3.6.1.4.1.2021
As these are standard Unix MIBs, most SNMP managers are able to interpret them.
FTP Server
You can create CDRs, which are based on the traffic displayed and the platform topology configured. For more information, see "Public CDR Generation".
The CDRs generated CDRs, can be retrieved and deleted using FTP or FTPS. To enable access via FTP or FTPS, click the FTP access enabled check box. You must also configure a username and password.
Voice Quality Collector
Operations Monitor can gather the voice quality information sent by IP phones in SIP PUBLISH messages and display it on the Voice Quality page.
As defined in RFC 6035, SIP User Agents may send voice quality reports derived from RTCP Extended Reports (RTCP-XR) and Operations Monitor acts as the collector of SIP vq-rtcpxr events using the PUBLISH method.
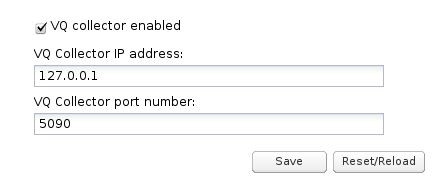
The vq-rtcpxr event collector is configurable as shown in Figure 7-36.
To configure the voice quality collector:
-
Select the VW collector enabled check box to enable the collection of voice quality metric reports.
-
In the VQ Collector IP address field, enter the IP address that is used by the vq-rtcpxr event collector to listen for PUBLISH messages.
-
In the VQ Collector port number field, enter the port number.
-
Click Save.
Note:
The same collector must be configured at the IP phone in order to let it send the voice quality metric reports to Operations Monitor.


