Earned Value and Risk Analysis Dashboard
Description: The Earned Value and Risks dashboard tracks costs and risks. Executives or PMs will be able to use this for getting information about EV, EAC for individual project managers across the portfolio or see how their organization performed on these parameters on a yearly or quarterly basis. Risk exposures are displayed by location and/or each project. This can help in devising better risk mitigating strategies.
Number of Canvases: 2
Default Canvas: Earned Value
Canvas/Dashboard Name: Earned Value and Risk Analytics
Data Source(s): P6 - EPPM
Subject Area: P6 - Activity
Datasets: Not applicable
Canvases
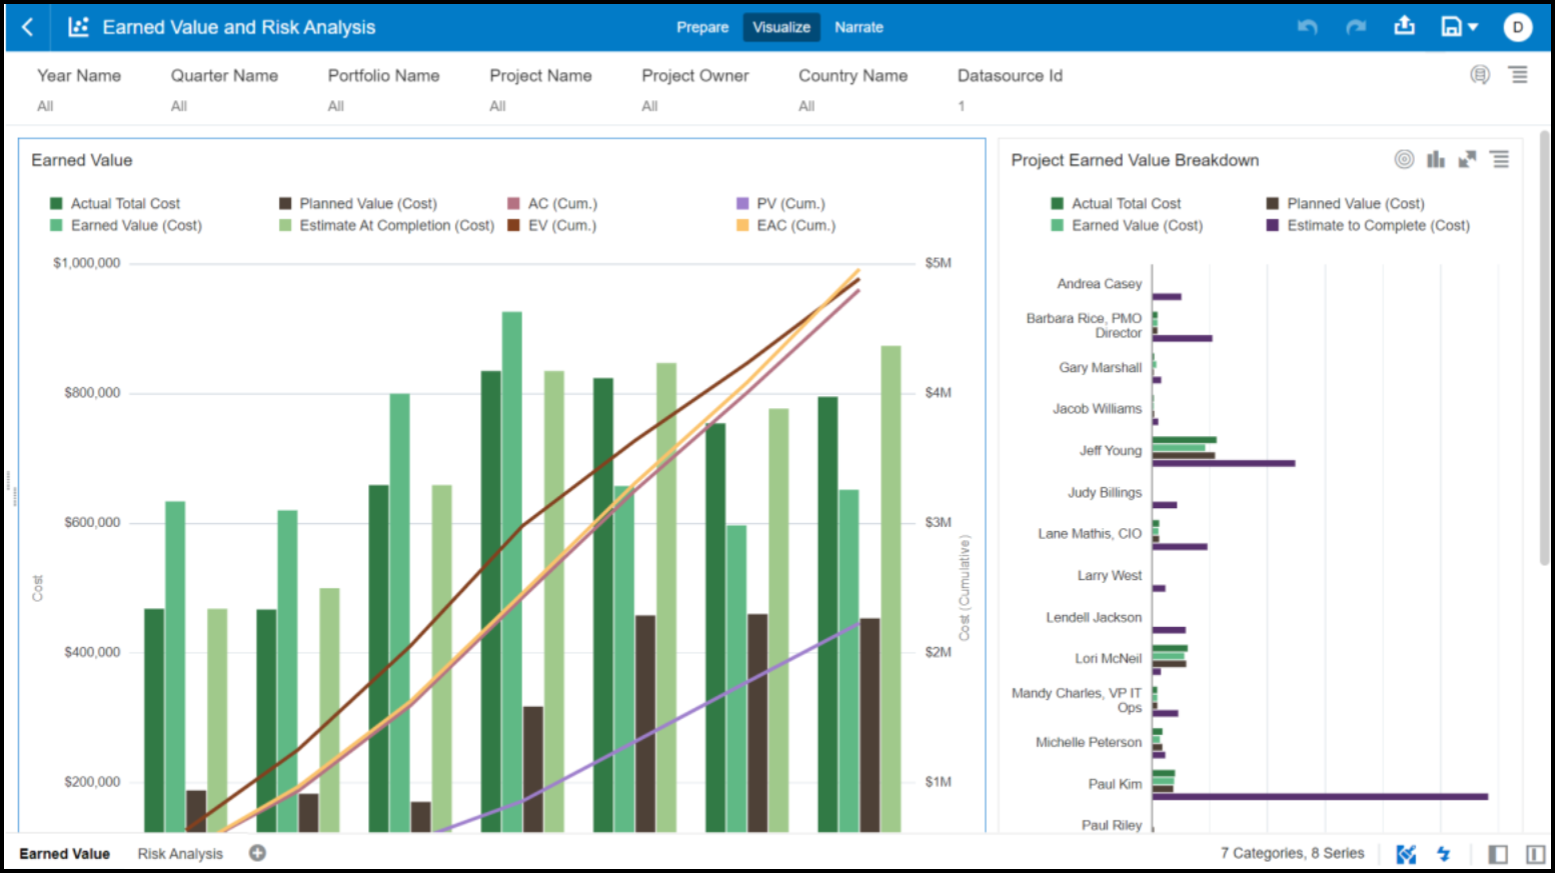
Figure 2: Earned Value
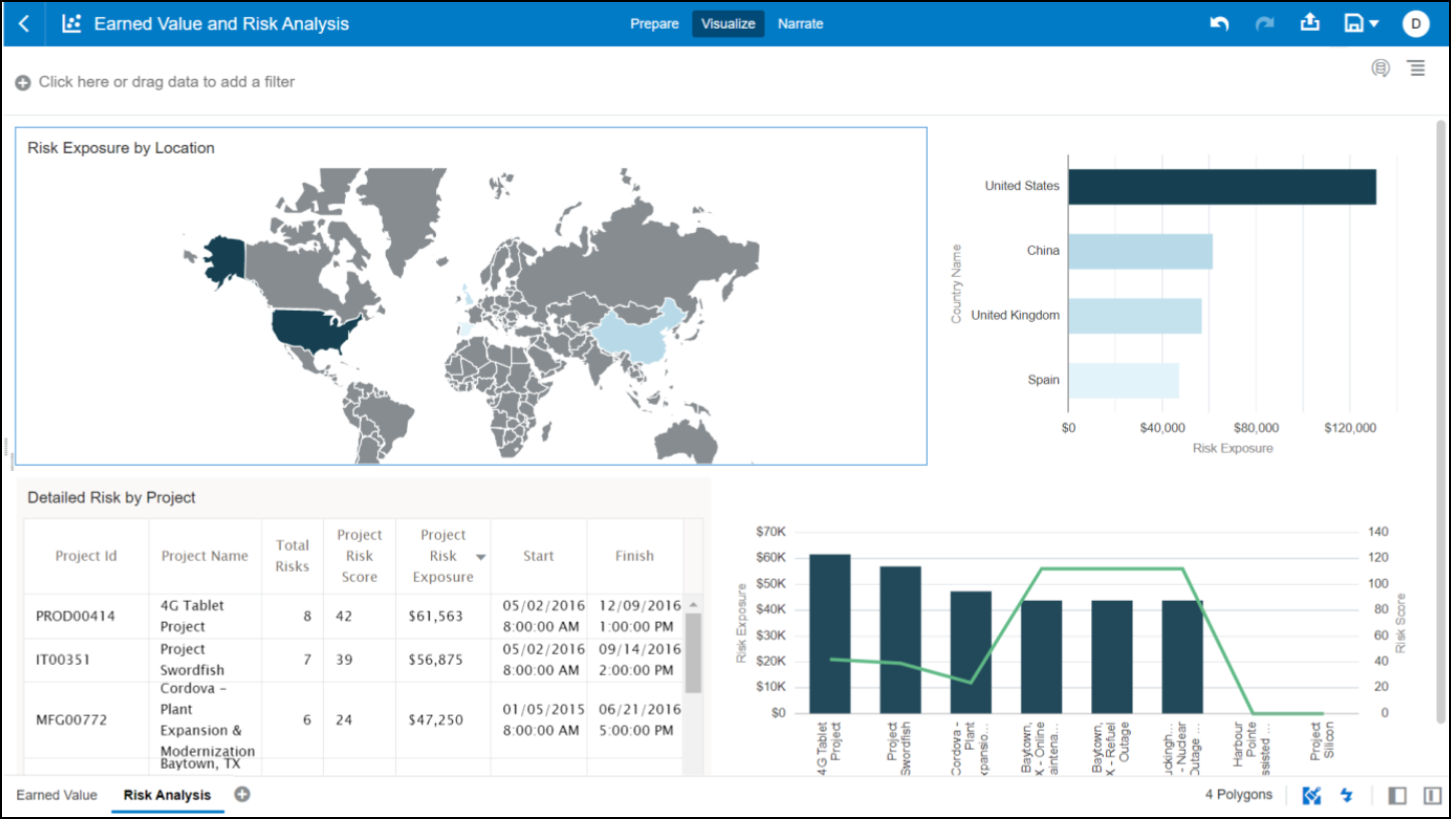
Figure 3: Risk Analytics
Table 5: Earned Value and Risk Analysis - Dimensions
Canvas | Dimension Name | Dimension / Attribute | Subject Area / Dataset |
|---|---|---|---|
Earned Value | Calendar | Year Name | P6 - Activity |
Earned Value | Calendar | Quarter Name | P6 - Activity |
Earned Value | Portfolio | Portfolio Name | P6 - Activity |
Earned Value | Project | Project Name | P6 - Activity |
Earned Value | Project | Project Owner | P6 - Activity |
Earned Value | Project | Country Name | P6 - Activity |
Earned Value | Project | Datasource ID | P6 - Activity |
Earned Value | Calendar | Month Name | P6 - Activity |
Earned Value | Calendar | Calendar Date | P6 - Activity |
Risk Analysis | Project | Country Name | P6 - Activity |
Risk Analysis | Project | Project ID | P6 - Activity |
Risk Analysis | Project | Project Name | P6 - Activity |
Risk Analysis | Project | Project Risk Score | P6 - Activity |
Risk Analysis | Project | Project Risk Exposure | P6 - Activity |
Risk Analysis | Project | Start | P6 - Activity |
Risk Analysis | Project | Finish | P6 - Activity |
Table 6: Earned Value and Risk Analysis - Measures
Canvas | Measure | Measure Type | Subject Area / Dataset |
|---|---|---|---|
Earned Value | Actual Total Cost | Fact | P6 - Activity |
Earned Value | Earned Value (Cost) | Fact | P6 - Activity |
Earned Value | Planned Value (Cost) | Fact | P6 - Activity |
Earned Value | Estimate At Completion (Cost) | Fact | P6 - Activity |
Earned Value | AC (Cum.) | Calculated from Fact | P6 - Activity |
Earned Value | PV (Cum.) | Calculated from Fact | P6 - Activity |
Earned Value | EAC (Cum.) | Calculated from Fact | P6 - Activity |
Earned Value | EV (Cum.) | Calculated from Fact | P6 - Activity |
Earned Value | Estimate to Complete | Fact | P6 - Activity |
Risk Analysis | Risk Exposure | Calculated from Fact | P6 - Activity |
Risk Analysis | Total Risks | Calculated from Fact | P6 - Activity |
Risk Analysis | Risk Score | Calculated from Fact | P6 - Activity |
Table 7: Earned Value and Risk Analysis - Filters
Canvas | Filter Type | Is Expression Filter | Dimension / Attribute / Measure | Subject Area / Dataset |
|---|---|---|---|---|
Earned Value | Dashboard | No | Year Name | P6 - Activity |
Earned Value | Dashboard | No | Quarter Name | P6 - Activity |
Earned Value | Dashboard | No | Portfolio Name | P6 - Activity |
Earned Value | Dashboard | No | Project Name | P6 - Activity |
Earned Value | Dashboard | No | Project Owner | P6 - Activity |
Earned Value | Dashboard | No | Country Name | P6 - Activity |
Earned Value | Dashboard | No | Datasource ID | P6 - Activity |
Earned Value | Visualization | No | Calendar Date | P6 - Activity |
Risk Analysis | Visualization | No | Risk Exposure | P6 - Activity |
Risk Analysis | Visualization | No | Total Risks | P6 - Activity |
Table 8: Earned Value and Risk Analysis - Calculated Members
Calculated Member | Expression | Source | Subject Area / Dataset |
|---|---|---|---|
Risk Exposure | SUM(Project Risk Exposure)
| Derived From Fact | P6 - Activity |
Risk Score | SUM(Project Risk Score)
| Derived From Fact | P6 - Activity |
AC (Cum.) | RSUM(Actual Total Cost)
| Derived From Fact | P6 - Activity |
EV (Cum.) | RSUM(Earned Value (Cost))
| Derived From Fact | P6 - Activity |
PV (Cum.) | RSUM(Planned Value (Cost))
| Derived From Fact | P6 - Activity |
EAC (Cum.) | RSUM(Estimate At Completion (Cost))
| Derived From Fact | P6 - Activity |
Total Risks | COUNT(DISTINCT RiskID by Project ID)
| Derived From Fact | P6 - Activity |
Related Topics
Last Published Friday, December 8, 2023