Summarization Bar
The Summarization Bar allows users to quickly view metric or dimension values that summarize aspects of the underlying data.
Each summary item contains one of the following types of values:
| Summary Item | Value Description |
|---|---|
| Metric value | The actual value of a specific metric, such as total sales or average profit. |
| Dimension value | The dimension value associated with either the top or bottom value of an associated metric value, such as the product category with the highest total sales. |
| Number of flags | The number of flags. Flags are based on the value of a metric for a selected dimension or dimensions.
For example, a flag summary item can reflect the number of product categories with more than 500 total sales. |
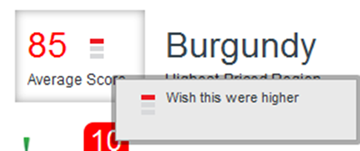
Values can use icons and color highlighting to provide additional context for that value. You can also display a tooltip containing a description and value details:

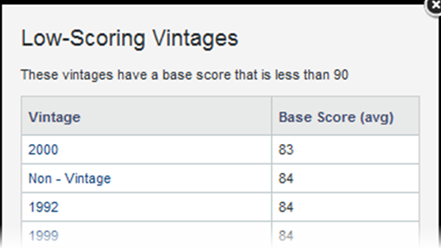
For flags, you can click the number to display the list of values.

Some summary values can redirect to a configured URL. Dimension values may be refinable -- see Using a component to refine data for details.
- Configuring Summarization Bar display options
The Display Options tab of the Summarization Bar edit view contains settings to control the label position and text size for all of the summary items. - Adding, renaming, and deleting summary items
When you first add a Summarization Bar component to a project page, it automatically displays a single metric value summary item that shows the number of records in the base view of the first data set. You can add, rename, reorder, or remove displayed items. - Configuring a metric value summary item
For a metric summary value, on the Define Item tab of the Summarization Bar edit view, you select the metric value to display. - Configuring a dimension value spotlight
For a dimension value spotlight summary item, on the Define Item tab of the Summarization Bar edit view, you select the dimension and metric to use. - Configuring metric and dimension value display and actions
For metric and dimension value spotlight summary items, the summary item includes a label above or below the displayed metric or dimension value. You can also configure the display options and action for the summary item. - Configuring conditional formatting
For a metric or dimension spotlight value summary item, you can configure different formatting based on the metric value. - Configuring flag summary items
For a flag summary item, on the Define Flags tab of the Summarization Bar edit view, you select the dimensions and set up the metric conditions.
Parent topic: Working with Components