Gain Visibility Into PeopleSoft
To maintain the efficiency of your PeopleSoft infrastructure, monitor the health and performance of your PeopleSoft application and its underlying infrastructure.
When discovering a PeopleSoft application, Oracle Management Cloud not only discovers PeopleSoft components such as PIA and Application Server Domain and Process Scheduler Domain but also it also discovers the underlying infrastructure supporting those components like WebLogic Server, Oracle Database and the Host.
- Status and alert summary across all components – including underlying infrastructure components.
- Errors found in application, middleware and database logs.
- Statistics on how many processes are completed – whether successful or not- per minute.
- Memory and CPU related KPIs across the hosts supporting PeopleSoft components.
The PSFT Application Health dashboard is available from the predefined PeopleSoft Monitoring Dashboards dashboard set. This dashboard set contains additional dashboards which are specific to certain PeopleSoft components. Use the various dashboards in the dashboard set to monitor the health of processes and all entities of a specific type of PeopleSoft component.
| Dashboard Name | Dashboard Description |
|---|---|
| PSFT Application Health Dashboard | The PeopleSoft Application provides the overall health of a single application so you can quickly identify potential problems. The dashboard offers in-context drill-downs into additional monitoring data, as well as providing additional log data to help you triage problems more quickly. |
| PSFT Process Monitor Dashboard | This dashboard summarizes the status and health of all processes (with the exception of processes with a run status of success) associated with a single PeopleSoft application. |
| PSFT PIA Health Dashboard | This dashboard summarizes the status and health of all PeopleSoft PIA entities for a single PeopleSoft application. |
| PSFT Application Server Health Dashboard | This dashboard summarizes the status and health of all PeopleSoft Application Server Domains for a single PeopleSoft application. |
| PSFT Process Scheduler Health Dashboard | This dashboard summarizes the status and health of all PeopleSoft Process Scheduler Domains for a single PeopleSoft application. |
For the steps to access the dashboards, see Use PeopleSoft Dashboards.
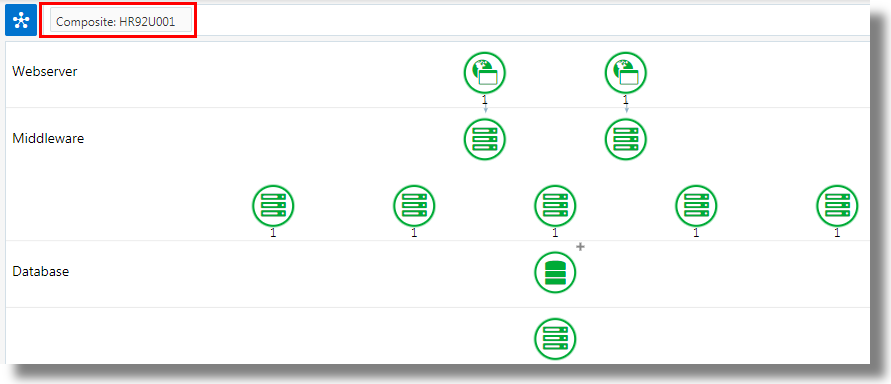
In addition to having all components of a PeopleSoft application represented in a predefined dashboard and dashboard set, Oracle Management Cloud also provides a topology view for a PeopleSoft application as well.
This topology view visualizes all relationships between PeopleSoft components and their underlying infrastructure, and provides intuitive drilldowns into additional data. Having this topology view of a PeopleSoft application allows you to gauge the impact of a specific availability or performance problem across the application’s tiers – either upstream or downstream from the problematic component.
To access the topology view, navigate to Infrastructure Monitoring Home. Click the OMC Navigation ![]() icon > click Monitoring > click Entities > click the link on the PeopleSoft composite entity > click the topology view icon on the top left corner.
icon > click Monitoring > click Entities > click the link on the PeopleSoft composite entity > click the topology view icon on the top left corner.
For example, here's a topology showing entities associated with composite HR92U001: