About XBRL Taxonomy Concepts
Use the Concept tab to select a taxonomy, navigate, search, and select taxonomy concepts for mapping to financial statement data. A taxonomy concept or element (used interchangeably) refers to a member that is defined in a taxonomy. For example, the concept Gross Profit is defined in a taxonomy. The Disclosure Management Mapping Tool renders taxonomy concepts in a tree-view structure (showing their parent-child relationships). The Disclosure Management Mapping Tool enables taxonomy concepts to be mapped to data in a Microsoft Office document.
Selecting Taxonomies
The administrator registers the taxonomies available to the Disclosure Management Mapping Tool.
Disclosure Management supports mappings from one taxonomy for each Disclosure Management report. A Disclosure Management primary report represents the collection of reports and doclets.
When users change a taxonomy, they are prompted to confirm the change. If the change is confirmed, mappings that are consistent with the original taxonomy remain intact, while mismatched ones are no longer applicable and will no longer be visible. For more information, see Changing a Taxonomy.
If a taxonomy has already been attached to a Disclosure Management report, the taxonomy is automatically opened with the document at login.
To select a taxonomy:
-
Open the Disclosure Management report in Smart View Microsoft Office. See Connecting to Narrative Reporting in Smart View.
-
From the Disclosure Management ribbon, click
 .
.
-
In the Disclosure Management Mapping Tool panel, select the Concept tab.
-
In the Actions menu, choose Select Taxonomy.
-
Select a taxonomy, and then click OK.
The top-level taxonomy node displays in the Taxonomy pane.
Note:
If more than one cell is selected for a particular table and the concept type is eligible for group tagging (based by server side rules for corresponding concept type) you are prompted with "Would like to map the entire table". If you select Yes, one mapping is created for the selected cells, If you select No, separate mappings are created for each cell.
For rendering a XBRL table from Microsoft Word you need to select the Rich Text option in the application. This is accessed by opening the Review tab in the Mapping tool UI. Select the mapped value in the UI (notice radio buttons at bottom of UI for user selection of the desired format.) Additionally, to complete a rendering of a XBRL table from Microsoft Word ( level 3 text block tags) ) it is required that the user also select text characters immediately preceding the table such as a table title or sentence outside the table, so that the table is properly identified.
Changing the Taxonomy Language
Taxonomies can be shown in different localized language labels based on the languages created by the author of the taxonomy. When another language is selected, all labeling related to the concept tree and its various views, search, and detail reflect the selected language.
Taxonomies can also be shown by their "Name". The "Name" option shows the unique XBRL name that is defined for a concept. The "Name" option is useful for users who prefer to view taxonomy concepts with their given XBRL name rather than their localized labels.
To change the language of the taxonomy:
-
Open the Disclosure Management report in Smart View Microsoft Office. See Connecting to Narrative Reporting in Smart View.
-
From the Disclosure Management ribbon, click
 .
.
-
On the Disclosure Management Mapping Tool panel, select the Concept tab.
-
With an open taxonomy, click the drop-down located on the panel ribbon and select a language code, or select Name to display XBRL taxonomy names.
Note:
To select a taxonomy, click Actions, and then Select a Taxonomy.
Disclosure Management is not certified for the following languages: Bi-directional, and Arabic usages.
Taxonomy Views
Taxonomies and tree structure views are defined in the taxonomy. Disclosure Management provides five views, (Presentation, Definition, Dimension, Calculation and Tuple) which can be viewed on the Concept tab of the Disclosure Management Mapping Tool panel. You display a view for an active taxonomy on the drop-down list (located on the far right of the Concept tab ribbon).
Following, are notable characteristics of the available views:
-
Presentation View - The Presentation view is a type of relationship which is a presentation linkbase (relationship file that defines how concepts relate to one another presentationally in a taxonomy) which provides a hierarchical organization of elements from parent to child. In some cases, the presentation hierarchy presents a similar representation as your financial report.
-
Definition View - The Definition view contains a variety of miscellaneous multi-dimensional relationships within the taxonomy. It describes how the elements relate to each other. Most commonly, this represents the definition linkbase from your taxonomy.
-
Dimension View - The Dimension view is displayed in a flat list. After you select a view, the top pane shows the primary items defined in the active taxonomy. The first item shows "Default Dimensions". In the view, the "Dimension Members" pane is in the bottom pane of the Concept tab.
When you select a primary item from the top pane, the Dimension Members pane (bottom pane) updates to display the dimension tree that represents the assignable domains and domain members related to the selected primary item.
When you select the default dimension item, the Dimension Members tab updates to display the default dimensions that are assignable to all taxonomy members.
Note:
For Presentation, Definition, and Dimension views, when you select a primary item from the top pane, the bottom pane updates to display the tree that represents the assignable domains and domain members related to the selected primary item.
When you select the default presentation, definition, or dimension item, the members tab updates to display the default dimensions that are assignable to all taxonomy members.
-
Calculation View - A hierarchical organization of concepts indicating calculation relationships and indicates how different concepts relate to each other through rollups. The totals are the parent nodes and the contributors are represented as the leaf nodes. The concepts are displayed with debit and credit indicators and the weight indicators next to each item. This information is also displayed in the Details tab.
-
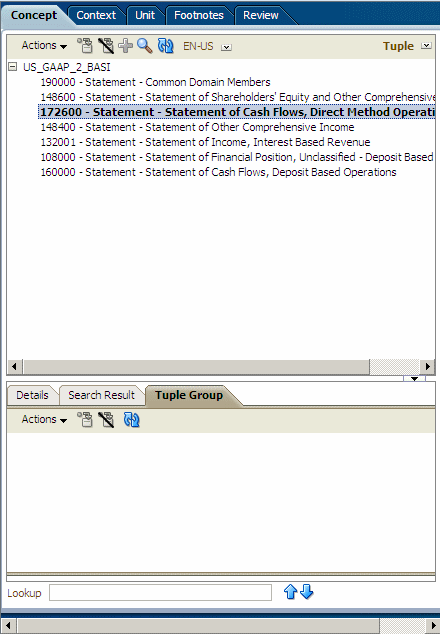
Tuple View - An XBRL tuple is a collection of related concepts. A tuple allows these concepts to be reported as a grouping, such that several different groupings of the same concepts may be reported. Tuples may also include nested tuples, although a circular dependency may not exist.
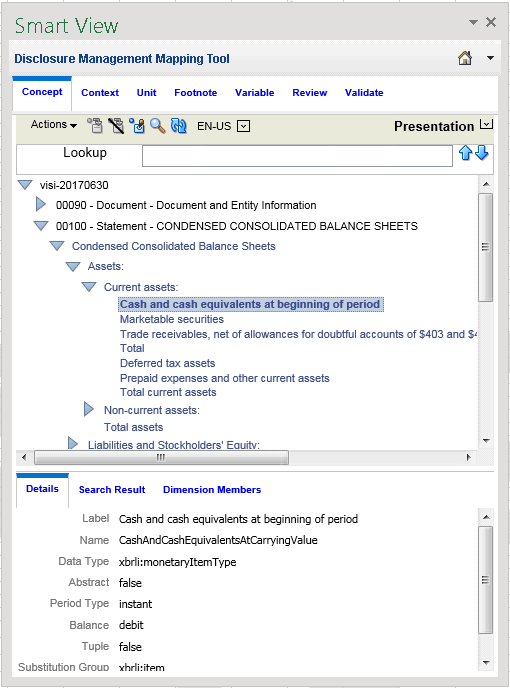
To change to taxonomy views:
-
Open the Disclosure Management report in Smart View Microsoft Office. See Connecting to Narrative Reporting in Smart View.
-
From the Disclosure Management ribbon, click
 .
.
-
On the Disclosure Management Mapping Tool, select the Concept tab.
-
With an open taxonomy in the Taxonomy pane, click
 .
.
-
Select a view to use for viewing the taxonomy.
Changing Taxonomy Views
When working with a taxonomy, you can examine the structure of the taxonomy from multiple perspectives or views. Disclosure Management provides several views for displaying a taxonomy. The structure and number of concepts shown in a view depends on the specifications designer. A concept shown in one view may not appear in another view. Additionally, one concept can appear multiple times in the same view.
To change the view:
-
Open the Disclosure Management report in Smart View Microsoft Office. See Connecting to Narrative Reporting in Smart View.
-
From the Disclosure Management ribbon, click
 .
.
-
On the Disclosure Management Mapping Tool, select the Concept tab.
-
With an open taxonomy, click
 , and then select a taxonomy view.
Presentation View
The Presentation view arranges concepts within the taxonomy in parent-child hierarchies.

Calculation View
The Calculation view arranges concepts by additive and subtractive relationships between numeric concepts. XBRL calculations represent simply addition and subtraction across concepts whose values share the same context (point in time) and unit (measure) references.
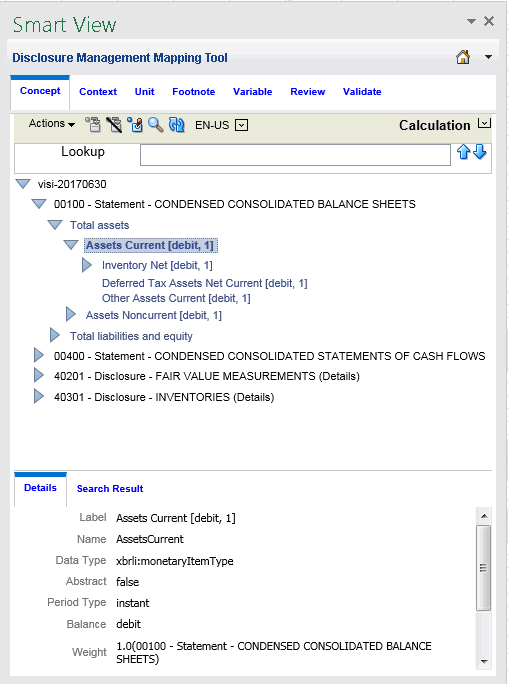
Definition View
The Definition view contains a variety of miscellaneous relationships within the taxonomy. Most commonly, it is used to represent dimensional relationships.
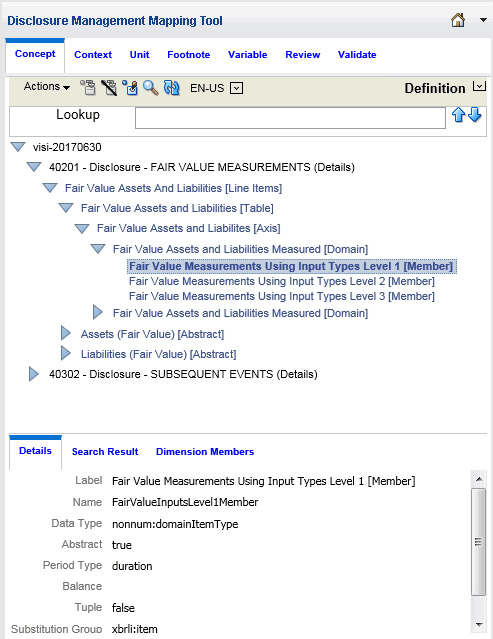
Dimension View
The Dimension view arranges concepts that are primary items and have XBRL dimensionality. The Dimension view evaluates the available primary items, hypercubes, dimensions, domains, and domain members in a taxonomy.
Note:
The dimension view is not defined within a taxonomy; rather, it is a Disclosure Management provided view available to all taxonomies that use XBRL dimensions.
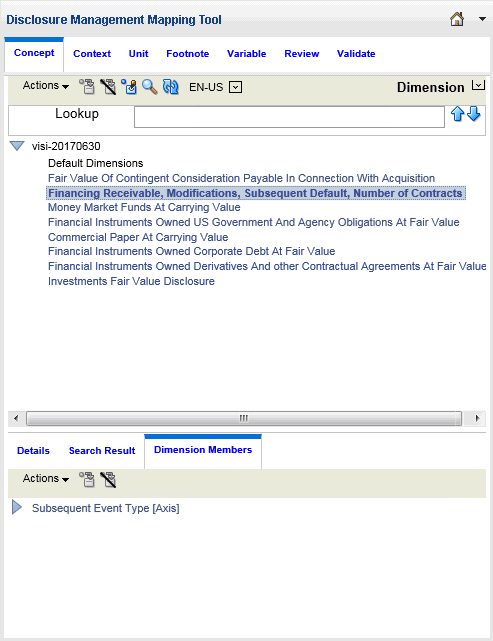
Tuple View
Arranges concepts by tuple relationships. Tuples are a group of related concepts containing multiple values. An individual tuple member by itself may not provide enough relevant information; however, a group of tuple members provides more complete information.
Note:
The tuple view is not defined within a taxonomy; rather, it is a Disclosure Management provided view available to all taxonomies that use XBRL tuples.
Mapping Concepts
Mapping enables you to correlate taxonomy concepts with financial statement data. The same item can be mapped multiple times to create multiple fact values.
To map a taxonomy concept to data in a Microsoft Office document (report/document level mapping):
-
Highlight the data point to map.
To select multiple data points in Excel table cells, press Ctrl + Shift. A word, sentence, or paragraph of free-form text in Microsoft Word can be selected.
For Microsoft Word tables, you must select the data value or multiple cells before mapping.
Taxonomy concepts can be mapped by dragging in Microsoft Word or Excel.
-
On the Disclosure Management Mapping Tool panel, select the Concept tab, and select a taxonomy concept, and then click
 .
.
When a report/document level mapping is created, the cell is shaded yellow.
To map a taxonomy concept for a data cell from a Smart View Office document:
-
In the document, highlight the member (metadata label).
-
On the Smart View ribbon, select Panel, then in the panel, click the Switch to drop-down and select the Concept tab.
-
Navigate to the taxonomy concept in the Taxonomy pane, and then click
 .
.
Tip:
To prevent errors when tagging a paragraph that has a table directly below it without a line feed in between, insert a line feed between the paragraph and the table before tagging, include text above the table (for example, a title), and extend the range of the tag beyond the table (for example, include a space or line feed after the table).
See also Tagging Indirect Data Sources.
Removing Mapped Concepts
You can remove a taxonomy concept map from a data point in an Office document. If your selection includes two or more mapped data points, the Remove Mappings dialog lists the associated mappings of the data points.
To remove a mapped concept for a data point in an Office document:
-
Open the Disclosure Management report in Smart View Microsoft Office. See Connecting to Narrative Reporting in Smart View.
-
From the Disclosure Management ribbon, click
 .
.
-
On the Disclosure Management Mapping Tool, select the Concept tab.
-
In the taxonomy list, select an XBRL concept.
-
Click the Remove Mapping button
 .
.
-
The Remove Mappings dialog displays, per row, a list of values that are mapped with the selected XBRL concept.
-
Select the rows you want to delete and click
 .
.
Note:
To reverse the deleted row, select
 .
.
-
Select OK.
If the concept has associated XBRL dimensions, these are also removed from the map repository.
Note:
Removing a mapped concept by clicking OK cannot be undone, and you must remap the XBRL concept to recreate the taxonomy concept association.
Quick Mapping
Use the Quick Mapping feature to map the concept, context, and unit at the same time instead of switching between the individual Concept, Context and Unit tabs when mapping. Additionally, you can create global contexts and units that can be used in both Microsoft Excel and Word. 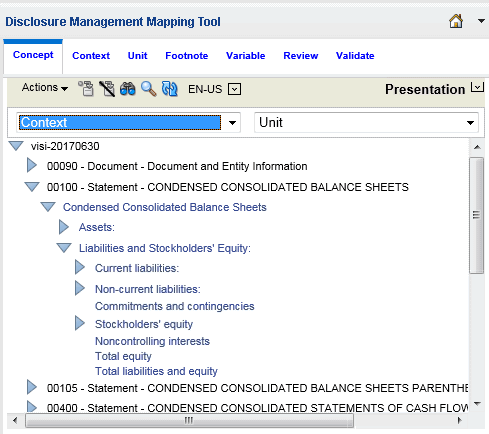
To apply a quick mapping:
-
Navigate to the taxonomy concept in the Taxonomy pane, and click
 .
.
-
From the Context drop down, select the context.
-
From the Unit drop down, select the unit.
-
Select the data point to map.
To select multiple data points in Excel table cells, press Ctrl + Shift. A word, sentence, or paragraph of free-form text in Microsoft Word can be selected.
For Microsoft Word tables, you must select the data value or multiple cells before mapping.
Taxonomy concepts can be mapped by dragging in Microsoft Word or Excel.
-
Click
 to map the concept.
Mapping NIL Values
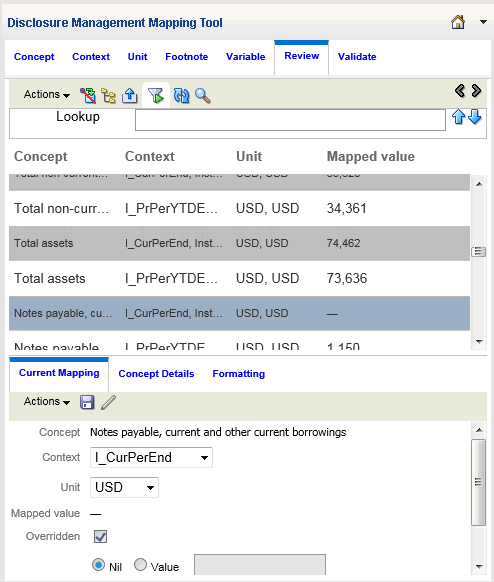
You can assign a "nil" value in Disclosure Management by highlighting and mapping a space or empty cell in Microsoft Word or Excel. Once the nil value is assigned, a new entry appears in Review mode with a "‒" in the Mapped Value field. Facts reported with the content of a nil value indicate that the value is not known or does not apply to the element. In the XML Schema, facts reported with the content of a nil value are assigned a ""true"" attribute as in the following example:
<us-gaap:AccountsReceivableNetCurrentcontextRef=""I-2010"" precision=""INF"" unitRef=""USD"" xsi:nil=""true""/>
Refreshing Taxonomies
Refreshing a taxonomy tree retrieves the latest content from the Disclosure Management server.
To refresh the taxonomy tree, select ![]() .
.
Viewing Concept Detail
Details about a selected taxonomy concept are available on the Concept Details pane of the Disclosure Management Mapping Tool. This information reflects properties related to the selected concept, such as Label, Name, or Data Type.
Note:
Some properties are optional.
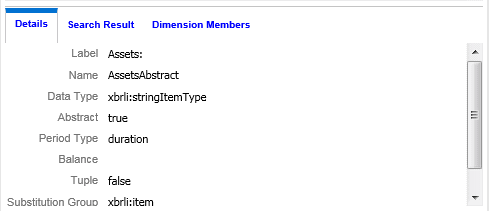
To display the Concept Details tab. Click ![]() located directly below the Concept tab horizontal scroll bar.
located directly below the Concept tab horizontal scroll bar.
Table 7-1 Concepts Detail Pane Fields and Descriptions
| Field | Description |
|---|---|
| Label | Identifies the human-readable name for the concept. |
| Name | Identifies the unique name of a concept in a taxonomy. Each concept has a standard name that equates to the concept name and is unique in the taxonomy. |
| Data Type | Identifies the expected data format that can be associated with the concept (such as numeric or string). |
| Abstract | An abstract concept cannot be used to map data in a report or document. |
| Period Type |
An attribute of a concept that shows whether the concept is reported in an instant or duration time period. The period type of the concept must match the period type definition in a context. For example, a context that is defined as an "instant" cannot be associated with a taxonomy concept whose period type is "duration". |
| Balance | An optional attribute that identifies the balance associated to a numeric value. Possible values: credit or debit. |
| Tuple |
Facts containing multiple values and identified by a single XML concept holding nested items. A tuple member by itself may not provide enough relevant information; however, a group of tuple members provides the information needed. For example, the tuple concept "company address" may consist of the following tuple members: "Name", "Street", "City", "State", "Postal Code," and "Country". A single tuple member by itself (such as "City"), is not sufficient to describe the concept "company address". The Disclosure Management Mapping Tool provides a "tuple view" under the Concept tab that shows all existing tuples defined within a taxonomy. |
| Substitution Group | An XSD (XML schema) entity that enables the implementation of a multiple inheritance structure. Many substitution groups are available in XBRL and can be defined in regulator taxonomies if desired. |
| Documentation | Identifies any specific citations used to provide further documentation about the concept. |
Changing a Taxonomy
In Disclosure Management only one taxonomy can be associated with an Office document; however, you can change the taxonomy associated with an Office document. Before taking this action, carefully consider the consequences.
When you change a taxonomy in a document, Disclosure Management determines whether any taxonomy maps exist in the Office document. If a taxonomy map does exist, the following warning is displayed: "Changing the taxonomy associated with this document may lead to loss of existing maps. Are you sure you want to change the taxonomy?"
If you elect to change the taxonomy, the following processes take place:
-
All full concept mappings are updated, and the namespace of each element is changed from the source taxonomy to the target one. If any mappings are invalid (referred to as "mismatched concepts"), the mappings are reported as errors during validation.
-
The contexts, units, and footnotes are retained (definitions and maps remain intact because they are saved with the document).
If no taxonomy mapping has been made to the document, user confirmation is unnecessary and the taxonomy can be changed. The Disclosure Management Mapping Tool does not automatically render the new taxonomy selected by the user.
Searching Taxonomy Concepts
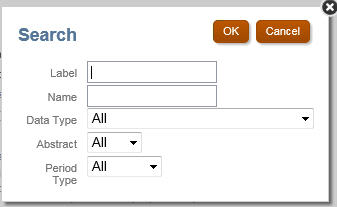
When you are working with taxonomies that have thousands of concepts, you can search concepts by concept label and additional filters (concept name, date type, abstract, and period type).
To search for a taxonomy concepts:
-
Open the Disclosure Management report in Smart View Microsoft Office. See Connecting to Narrative Reporting in Smart View.
-
From the Disclosure Management ribbon, click
 .
.
-
On the Disclosure Management Mapping Tool, select the Concept tab.
-
On the Concept tab, select
 .
.
-
In Label, enter the name for the concept. For example, to search expense related concepts, enter "Expense".
-
Optional: In the Name, enter the unique identifier of the concept.
-
Optional: In the Data Type, select the type of data associated with the concept. The set of values depends on the types defined in scope of the taxonomy.
Options are:
-
All
-
None
-
(based on the taxonomy, various types will display in the drop-down list)
-
-
Optional: In Abstract, select the true or false abstract attribute of a concept.
Options are:
-
All
-
False
-
True
-
-
Optional: In Period Type, select the period or type associated with the concept.
Options are:
-
All
-
None
-
Duration
-
Instant
-
-
Click OK.
The results of the search are shown in the Search Results tab.

The Search Results tab can always be displayed by clicking
 located directly below the horizontal scroll bar.