View Deployment-Specific Statistics
To view deployment-specific statistics:
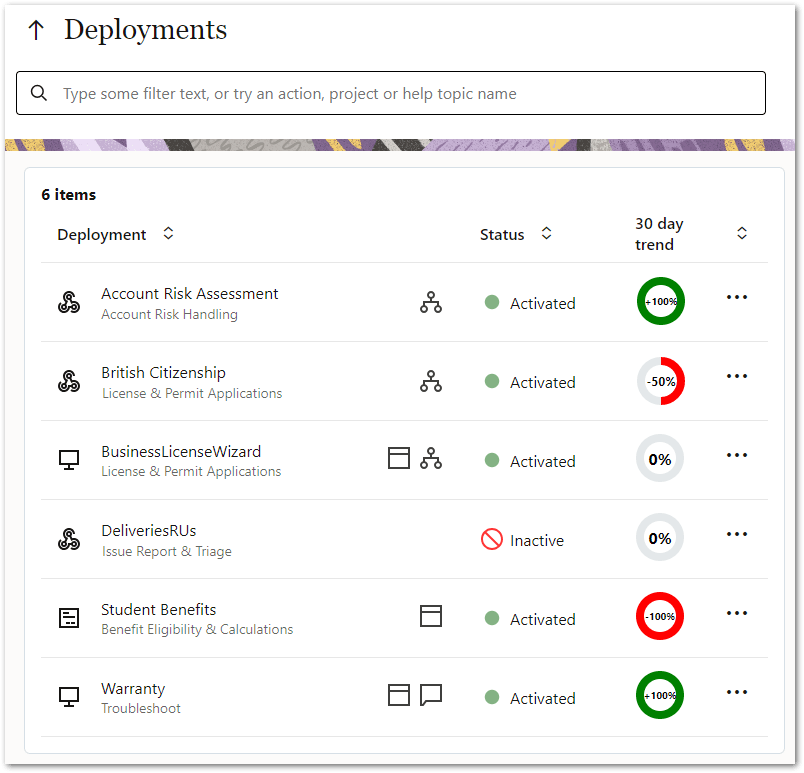
- In Intelligent Advisor Hub, navigate to the Deployments Page. The Deployments page shows month-to-month usage trends for every deployment.
- Click a deployment name. The deployment details page is displayed showing charts for deployment-specific statistics.
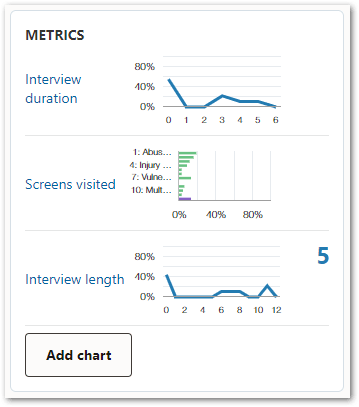
By default, these charts are:
In the METRICS panel you can:
- hover over the chart name to see more detail on what is being shown on the chart
- click on any of these charts to configure the data displayed (that is, change the chart type or customize the chart), or to Download Usage Data for offline analysis
- see, where the chart has multiple versions selected, a summary count of:
- the previous 24 hour activity (midnight through 11:59pm on the server) if the chart is showing the last 30 days of activity, or
- the previous month's activity if the chart is showing the last year of activity.
- add a new chart
30 day trends
The 30 day trend on the Deployments page compares the number of interactions started in the last 30 days (between now and 30 days ago) against the number of interactions started in the previous 30 days (between 30 days ago and 60 days ago). The difference is expressed as a ratio of how many more or less interactions have been used in the last 30 days than the previous 30 days.
To explain this further:
- If the number of sessions used in both periods are identical, then the deployment usage has not changed. The indicator will therefore display 0%.
- If the number of sessions in the current period is greater than in the previous period, then the deployment usage has increased. The indicator will be a positive value:
- If the number of sessions in the previous period is zero, then the indicator will display +100%.
- Otherwise, the indicator will display the difference between the current period and previous period as a percentage of the previous period. For example:
- Current period = 150, previous period = 100, indicator = ((150-100)/100) * 100 = +50%
- Current period = 150, previous period = 75, indicator = ((150-75)/75) * 100 = +100%
- Current period = 150, previous period = 50, indicator = ((150-50)/50) * 100 = +200%
- If the number of sessions in the current period is less than in the previous period, then the deployment usage has decreased. The indicator will be a negative value:
- If the number of sessions in the current period is zero, the indicator will display -100%.
- Otherwise, the indicator will use the same difference equation to present the ratio as a negative percentage. For example:
- Current period = 150, previous period = 200, indicator = ((150 - 200)/200) * 100 = -25%
- Current period = 150, previous period = 300, indicator = ((150 - 300)/300) * 100 = -50%