Create and use calculations
Calculations enable you to combine multiple measures, using a variety of functions, and then use the result as one of the Values (X-Axis) items in your chart.
Note: Calculation columns you create within a project are not visible in other projects.
To create a calculation:
- If you haven't yet created a new project, follow the steps to To create an Audience Insight project:.
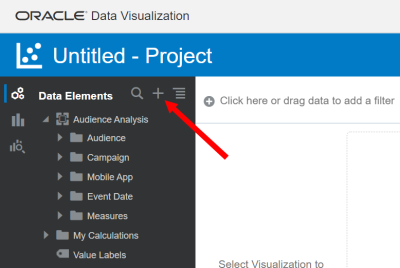
- On the Project page, locate the Data Elements panel on the left-hand side and click the Add icon
 .
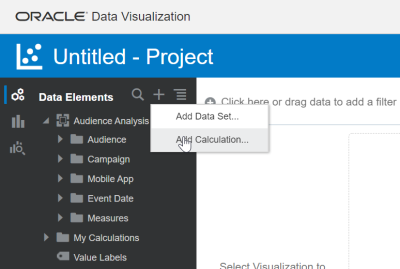
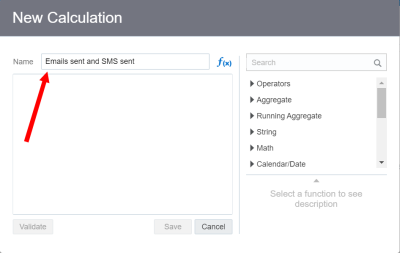
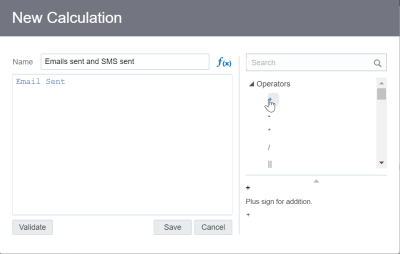
. - Select Add Calculation. The New Calculation dialog is displayed.
- Enter a Name for the calculation.
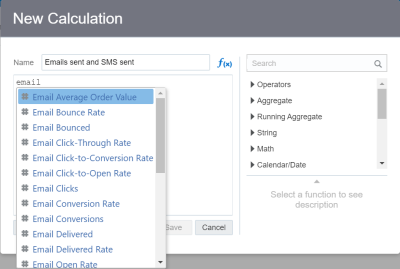
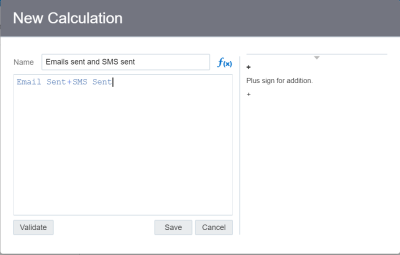
- In the calculation window use the search function to find the name of the measure you want to add. For example, enter "email" to view the list of measures available that are related to emails.
- Drag and drop functions from the right-hand side onto the calculation window.
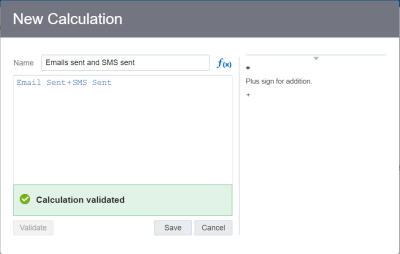
- Click Validate to validation the calculation. Perform any corrections needed.
- After the calculation validates successfully, click Save.
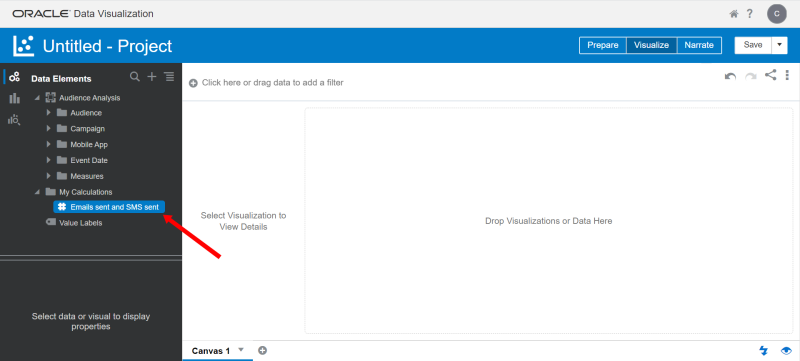
Your calculation is saved to the My Calculations folder in the Data Elements panel.
To use a calculation in a chart:
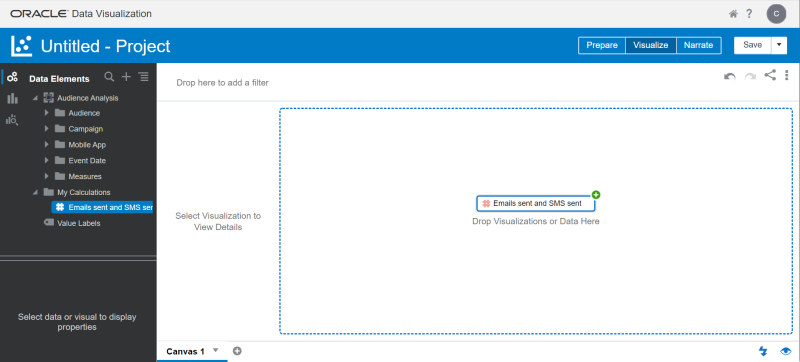
- In the Data Elements panel, locate the My Calculations folder and open it.
- Locate the calculation that you want to use, and then drag and drop it onto the canvas, in the area labeled Drop Visualizations or Data Here.
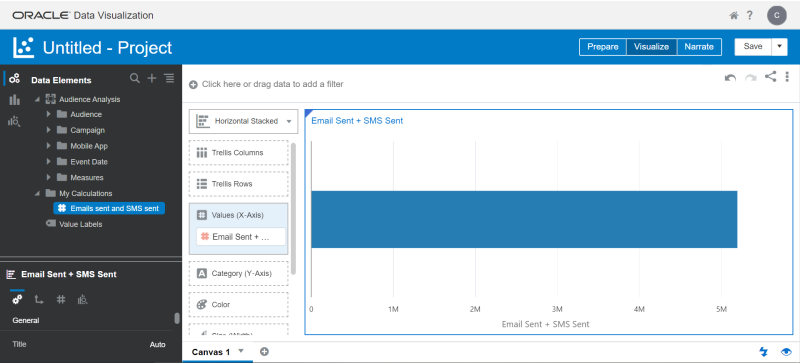
The calculation is added to the Values (X-Axis) for the chart. If you haven't created your filter yet, the system automatically picks a chart for you and adds the calculation as one of the Values (X-Axis) items. You can then pull over the Audience Name object for the Category, and add the Audience name as the filter.
