Get started with Audience Insight
Audience Insight enables you to analyze audience performance, before and after you run marketing campaigns and programs.
Audience Insight basics
This section shows how to create an Audience Insight project, how to create a basic chart in your project, and how to save your project.
Before you begin: Create one or more published Audiences. See Audiences for more information about how to create and publish Audiences.
To create an Audience Insight project:
- From the navigation menu, select Audience Insight, and then select Custom Visual Reports.
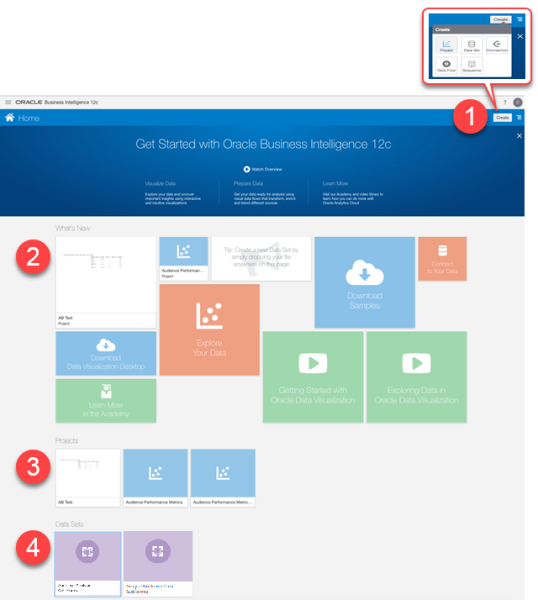
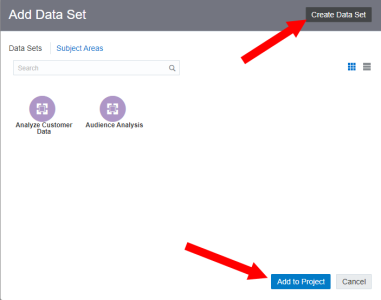
- In the top-right corner, click Create and select Project. The Add Data Set dialog will display.
- Select the data set you want to add to the project and click Add to Project. If you need to create a new data set, click Create Data Set.
The Oracle Business Intelligence Home page opens in a new web browser window.
Note: CX Audience uses the Data Visualizer tool in Oracle Business Intelligence 12c for Audience Insight. Please note that not all features shown in the interface are available for CX Audience users. The instructions in this section and in related topics will guide you to the areas that you can use.
About the Oracle Business Intelligence Home page:
 - The Create button enables you to create a new project.
 - You can find last edited/run projects in the What's New section. If you have created a project before, click the project to continue working on it.
 - The Projects section shows a list of all projects.
 - You can select from two data sets: Audience Analysis and Analyze Customer Data. You can also create a new project by clicking this data set.
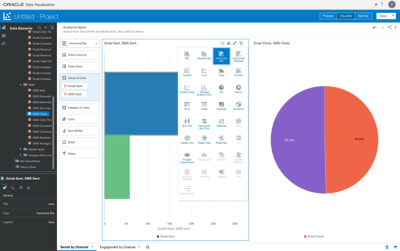
To create an Audience Insight chart:
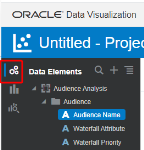
- Click Data Elements, and then drag and drop the Audience Name object to the filter section of the page (labeled "Click here or drag data to add a filter").
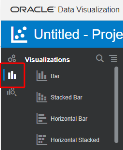
Choose one or more Audience names. All Published Audience names show up in the list. You can add multiple audience names here to filter the report results. - Click the Visualizations button, and then choose the type of chart. The chart properties pane is displayed on the left, and the chart area is displayed on the right.
- Click the Data Elements button to return to the list of measures and dimensions. Drag the Audience Name object to the Category (Y-Axis) section.
- For the Values (X-Axis) section:
- Go to the Data Elements list and expand the Measures folder. You can see each supported channel metrics represented: Email, SMS, Mobile Apps, Uniques (First Look). (Learn more about the Audience Report attributes.) All event data is brought in to CX Audience through the Responsys integration - you do not need to take any additional steps for that to happen.
- Drag one or more measures to the Values (X-Axis) section.
The chart you created is displayed.
To save a project:
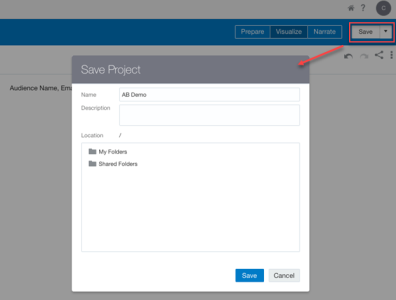
- Click Save or Save As to save the project.
- In the Save Project dialog, choose My Folders to save for your personal access, or choose Shared Folders for sharing the project with all users.
Tip: To refresh your data without refreshing your browser window, click the action menu, and then choose Refresh Data. 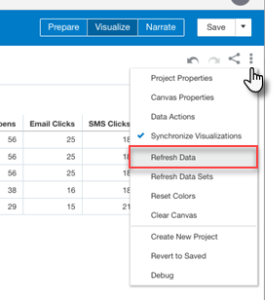
reporting, Audience Insights, Audience Insight, audience insight, audience insights, insights, Insight, analysis, analytics, Insights, insight, create project, create chart, save project, creating projects, creating charts, saving projects
Design Audience Insight charts
Learn about Audience Reporting attributes
Visualize Data from the Oracle Analytics Cloud Help Center
