Analyzing customer data
The Audience Insight tool allows you to analyze custom tables you create in Oracle CX Audience. You can use the data in custom tables to create a number of different charts and tables. You can also analyze lookup tables to break down behavioral data by product lines.
Learn more about visualizing data from the Oracle Business Intelligence Help Center.
Oracle Business Intelligence
Please keep in mind the following when visualizing data using Oracle Business Intelligence.
- You can visualize data with any columns from PET tables, Profile tables and any Custom table joined to a Profile table.
- You can create separate charts that visualize data from different custom tables in the same dashboard. However, filters on the top are applied to all charts in a dashboard.
- You should always create calculated columns in order to visualize aggregated metrics such as the sum of “Total Order Amount” or the count of “Recipients”. Wherever possible you should visualize aggregated metrics for better performance.
- You should always apply date range filters before visualizing the data from custom transaction tables. This allows for better query performance.
- Existing custom tables are not available in “Analyze Customer Data” subject area automatically. They have to edit the properties of the custom table and enable it for analytics to see it the subject area. Once enabled, it takes around 3-5 minutes to show up in the subject area.
- You can export a maximum of 100,000 rows.
- If a query runs for more than 10 minutes, then it will automatically time out. If this happens, we recommend reviewing filters and only using the ones that are necessary.
- You can visualize data from only one custom table in a single chart.
- You can visualize data only from first level custom tables. You can't visualize data from second level, third level, and subsequent custom tables.
- The following features for Oracle Analytics Server are currently not accesible in CX Audience:
- Creating Data Flows
- Creating Connections to external systems
- Creating custom Data Sets from external files.
- Blending data from different data sources
Enabling custom tables for analysis
To analyze data in a custom table, you will need to enable data analytics for the table.
To enable analytics for an existing custom table:
- In the navigation menu, click Data and select Manage Customer Data.
- Click the Custom Tables tab.
- Next to the name of the custom table you want to enable, open the edit menu and select Change Schema.
- Under Data Analytics, click the check box for Enable data analytics for this table.
- Click Update.
To enable analytics for a new custom table:
- Follow the steps for Creating custom tables.
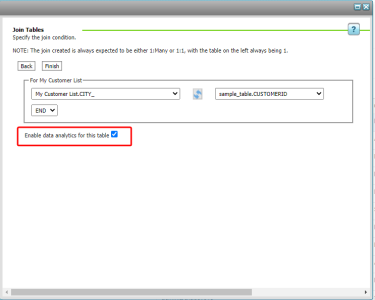
- When configuring the Join Tables section, click the check box for Enable data analytics for this table.
Analyzing customer data
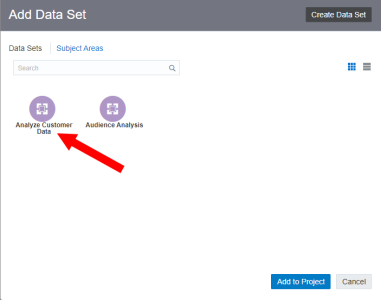
When you start to create a project with Audience Insight and need to add a data set, select Subject Areas and click Analyze Customer Data.
Learn more about Getting started with Audience Insight.
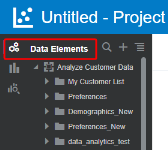
After creating the new project, custom tables you've enabled for analysis with be displayed under Data Elements.
Learn more about Designing Audience Insight charts.
Get started with Audience Insight
Design Audience Insight charts


