SMS reporting and metrics
Important: This feature is only available if your organization has purchased SMS services. Please contact your account manager for additional information and pricing.
Note: You must have the View Operational Reports
SMS asset operational reports
After you've sent an SMS message, you can use various reports and metrics to measure the message's performance.
Important: SMS operational reports only report on the last 3 months of SMS activity.
You can access reports directly from an SMS message. If you want to report on multiple SMS messages or a campaign, you should use Insight reports.
To access SMS asset operational reports:
- Navigate to Assets
 , then click SMS.
 - Open the SMS you want to report on.
- Click Actions > Operational Reports.
Overview of SMS asset operational reports
The following table describes the metrics on SMS asset operational reports:
| Metric | Description |
|---|---|
| Clickthroughs | Number of clickthroughs |
| Sends | Number of messages sent, including both outbound and response messages |
| Fails | Number of failed messages. Failed messages were not sent at all. A message failure could be a skipped message (no code available for the country) or an error with the SMS service. |
SMS usage report
You can use SMS Usage Report to review consumption of SMS over a period of time. It surfaces usage in terms of interactions which is the unit of purchase on your ordering document, as well as splits and other useful metrics.
Note: The report shows data in UTC time zone. The usage data in the report may be up to 2 days prior
To access the usage report:
- Navigate to Assets , then click SMS.
- Click Usage Report.
Overview of the SMS usage report
Important: The Usage Timeline chart shows usage data for the last 15 months.The Usage Analysis table shows usage data for the last 15 months, displayed by month as default. You can update the time range to view usage data for a specific period.
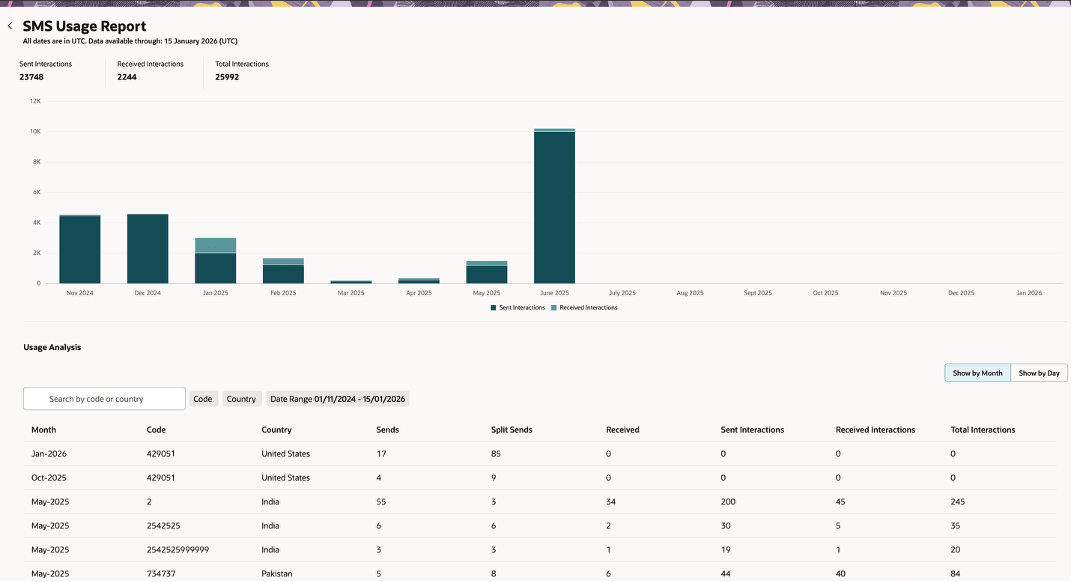
The following table describes the metrics on the SMS usage report:
| Metric | Description |
|---|---|
| Sends | Number of messages sent, including both outbound and response messages |
| Split Sends | Number of message parts sent. Learn more about message splits. |
| Received | Number of messages received |
| Sent Interactions | Interactions consumed due to sent messages |
| Received Interactions | Interactions consumed due to received messages |
| Total Interactions | Sum of sent and received interactions |
Tip: To review consumption for a specific contract period, set the date range filter in the Usage Analysis table to the contract’s start and end dates. Total consumption for that period is calculated as the sum of the Total Interactions column.